Report on Business Statistics and Data Analysis: Stock Prices
VerifiedAdded on 2023/06/08
|10
|2207
|269
Report
AI Summary
This report provides a comprehensive business statistics and data analysis of stock prices, interest rates, and exchange rates. It includes descriptive statistics, time series graphs, scatter plots, correlation analysis, and regression analysis to understand the relationship between stock prices and macroeconomic variables. The analysis reveals insights into the fluctuations of stock prices and the impact of interest rates and exchange rates on the stock market. The report concludes that business statistics is crucial for analyzing data and improving business performance, with data obtained from Desklib.
Business Statistics and
Data Analysis
Data Analysis
Paraphrase This Document
Need a fresh take? Get an instant paraphrase of this document with our AI Paraphraser
Contents
INTRODUCTION...........................................................................................................................3
TASK...............................................................................................................................................3
1. Descriptive statistics for each variable which includes interest rate, stock price and
exchange rate...............................................................................................................................3
2. Plot a time series graph for each variable and explain in brief about the about the movement
of variables...................................................................................................................................4
3. Plot scatter graph of stock price against macroeconomic variables such as exchange rate and
interest rate...................................................................................................................................6
4. Compute correlation between stock price and macroeconomic variables and findings..........6
5. Compute regression line between............................................................................................7
CONCLUSION................................................................................................................................9
REFERENCES..............................................................................................................................10
INTRODUCTION
The business statistics is defined as the statistical study of the business data in order to gain
the insights of the information which is related to the business organisation. The data analysis is
defined as the study of the information in an effective manner in order to improve over the
various aspect within the business enterprise. The stick price is the proportional value of the
business organisations worth. it is very important for every business organization to analyse the
data and perform according to the various aspect in order to improve its financial position. there
is use of the descriptive statistics in order to summarise the characteristics of the sample or
different data sets. It is essential that the organisation is able to analyse its data in an effective
way in order to improve their performance. This is the report which will include the various
calculation such as descriptive statistics for each variable, time series grip for different variable,
and regression for the different variables.
TASK
1. Descriptive statistics for each variable which includes interest rate, stock price and exchange
rate.
MCX Index Interest
Rate
Exchange
Rate
Mean 20034.87041 0.484043469 1.319579592
Standard Error 288.8544113 0.048111776 0.007691082
Median 20021.5 0.61149 1.3206
Mode #N/A #N/A #N/A
Standard
Deviation 2021.980879 0.336782433 0.053837572
Sample Variance 4088406.676 0.113422407 0.002898484
Kurtosis
-
0.309574154
-
1.768864116
-
0.744994481
Skewness
-
0.151343319
-
0.270762321
-
0.067199417
Range 9001.06 0.88694 0.2056
Minimum 15101.13 0.0255 1.2156
Maximum 24102.19 0.91244 1.4212
Sum 981708.65 23.71813 64.6594
Count 49 49 49
⊘ This is a preview!⊘
Do you want full access?
Subscribe today to unlock all pages.
Trusted by 1+ million students worldwide
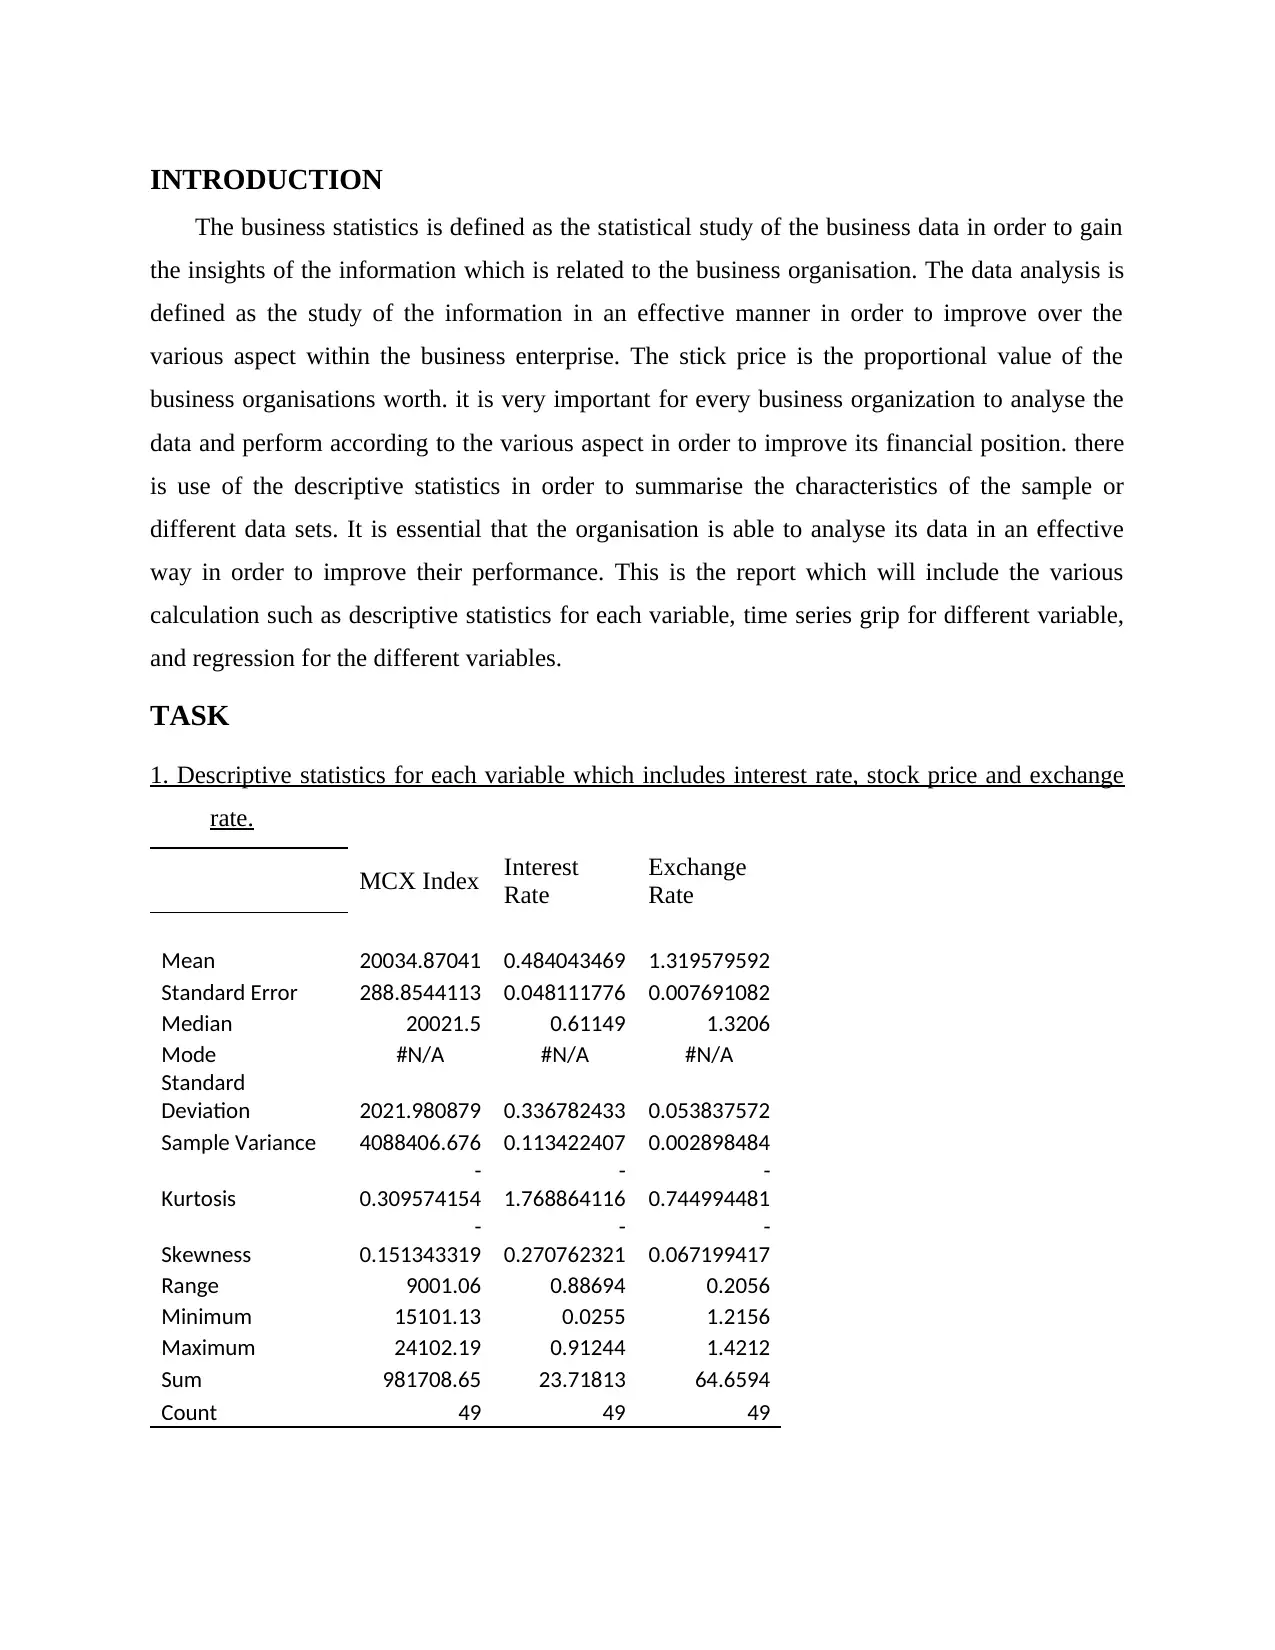
From the above table, it can be interpreted that the means price of the share was 20034.87
during the period. It has fluctuated by 2021.98 during the given period of time. The prices of
share had fluctuated more than 9000 which states the it has moved up-down during the period.
The minimum price that the share had touched during the time frame was 15101 and the
maximum was 24102.
Interest rate has been near to 0.48% during the year which states that the commencement
of load was easy and it was easily accessible. At the mid of the time period the amount was 0.61.
The lowest interest rate 0.026 during the period of time. The fluctuations in the interest rate is
high as it effects the flow of money in the economy and the amount invested in the company.
The amount invested in the companies effects the amount of earnings of the company. In the
following case it can be seen that
Average interest rate during the year was 1.32, it has been seen that it has touched the
lower 1.216 which has touched its highest 1.42. Total Count of the data is 49 which states the
total number of observations. The median of the data is 1.32 which is the median number of the
data set provided.
2. Plot a time series graph for each variable and explain in brief about the about the movement of
variables.
Paraphrase This Document
Need a fresh take? Get an instant paraphrase of this document with our AI Paraphraser
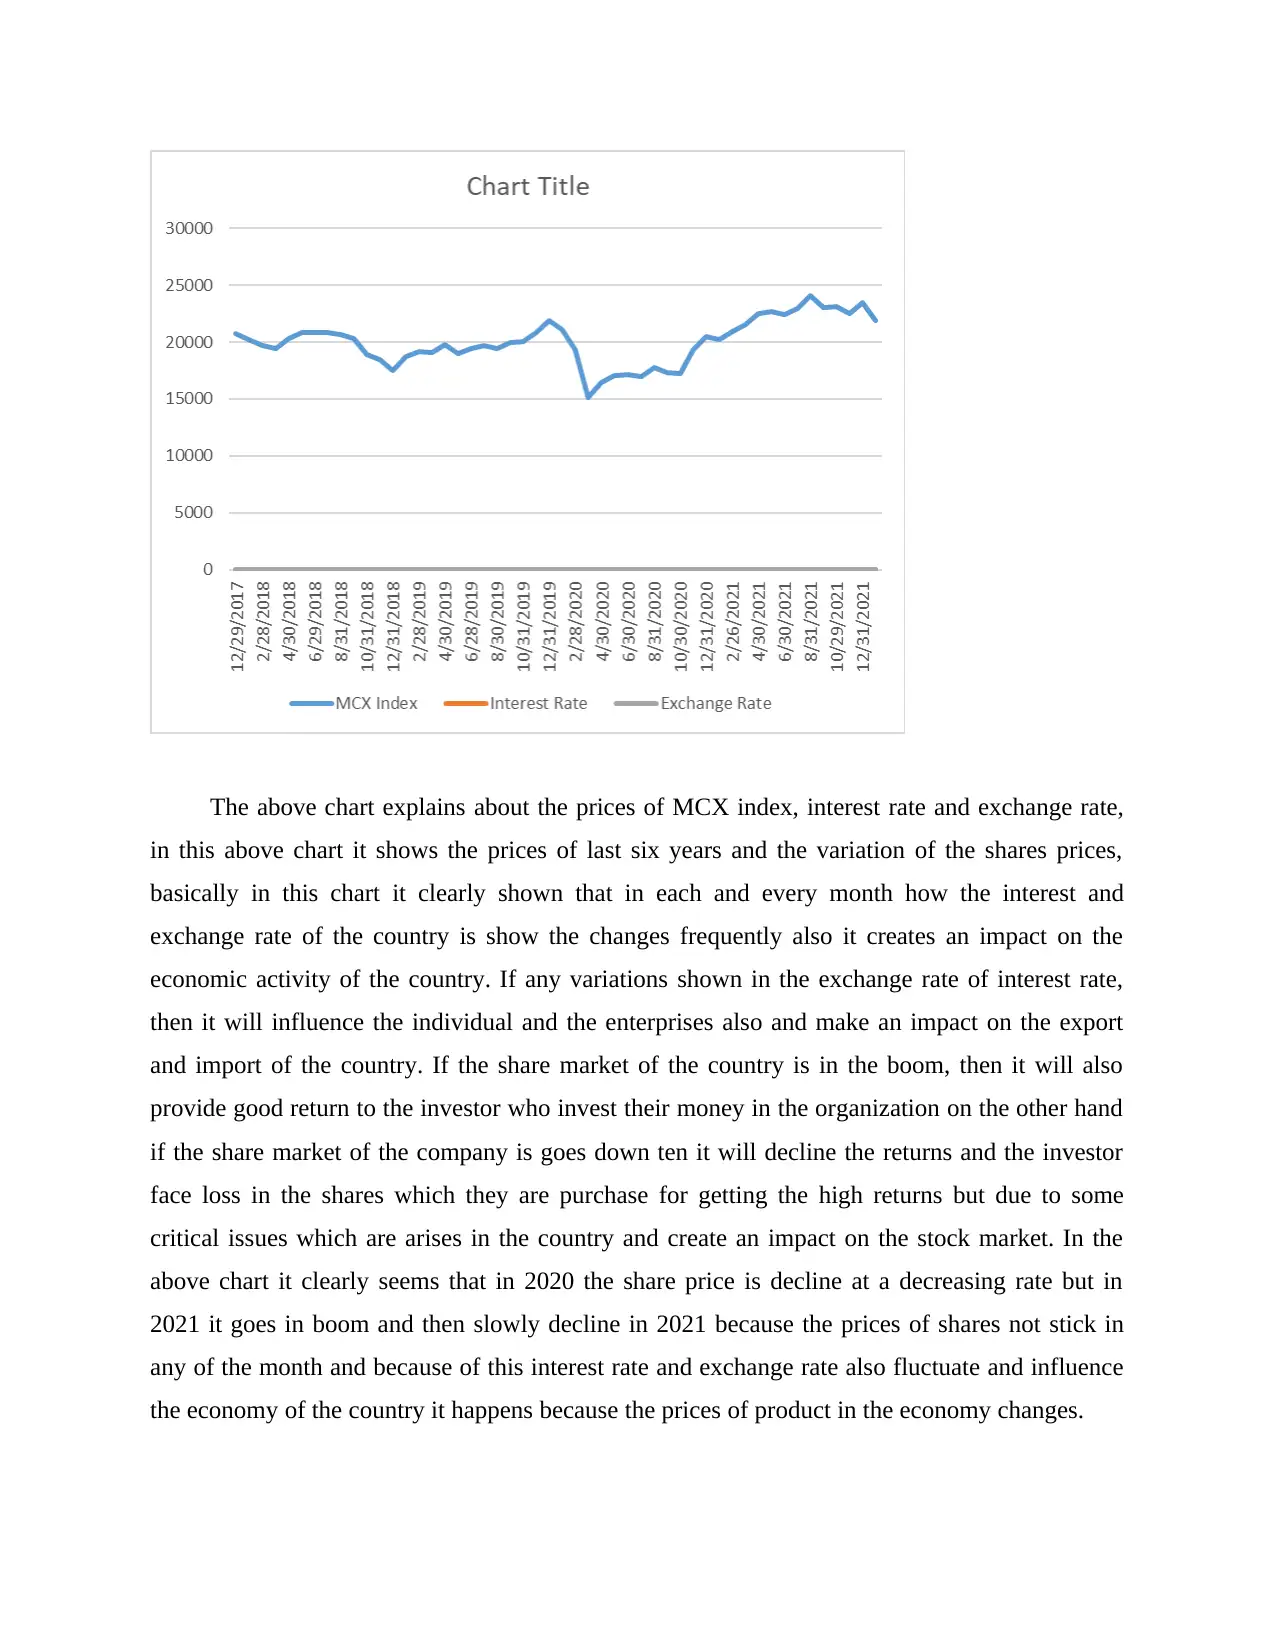
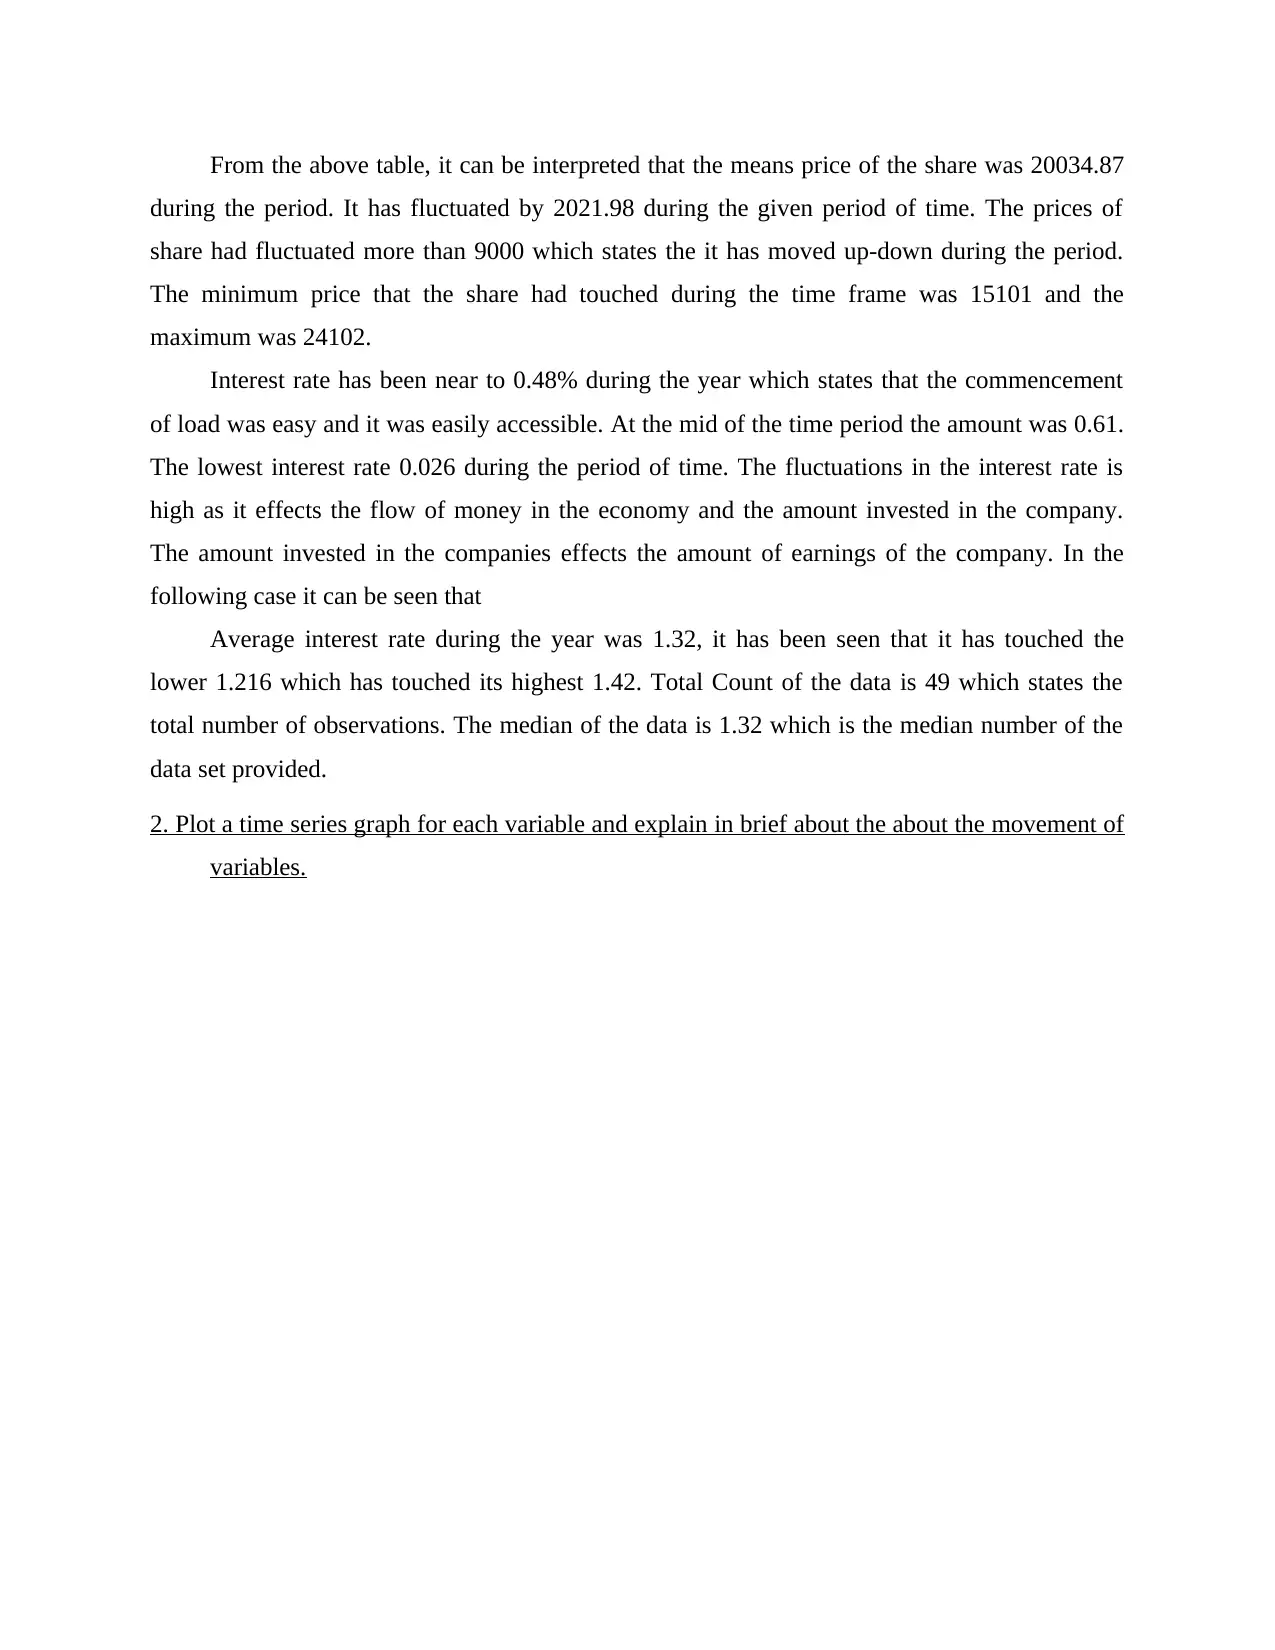
The above chart explains about the prices of MCX index, interest rate and exchange rate,
in this above chart it shows the prices of last six years and the variation of the shares prices,
basically in this chart it clearly shown that in each and every month how the interest and
exchange rate of the country is show the changes frequently also it creates an impact on the
economic activity of the country. If any variations shown in the exchange rate of interest rate,
then it will influence the individual and the enterprises also and make an impact on the export
and import of the country. If the share market of the country is in the boom, then it will also
provide good return to the investor who invest their money in the organization on the other hand
if the share market of the company is goes down ten it will decline the returns and the investor
face loss in the shares which they are purchase for getting the high returns but due to some
critical issues which are arises in the country and create an impact on the stock market. In the
above chart it clearly seems that in 2020 the share price is decline at a decreasing rate but in
2021 it goes in boom and then slowly decline in 2021 because the prices of shares not stick in
any of the month and because of this interest rate and exchange rate also fluctuate and influence
the economy of the country it happens because the prices of product in the economy changes.
3. Plot scatter graph of stock price against macroeconomic variables such as exchange rate and
interest rate.
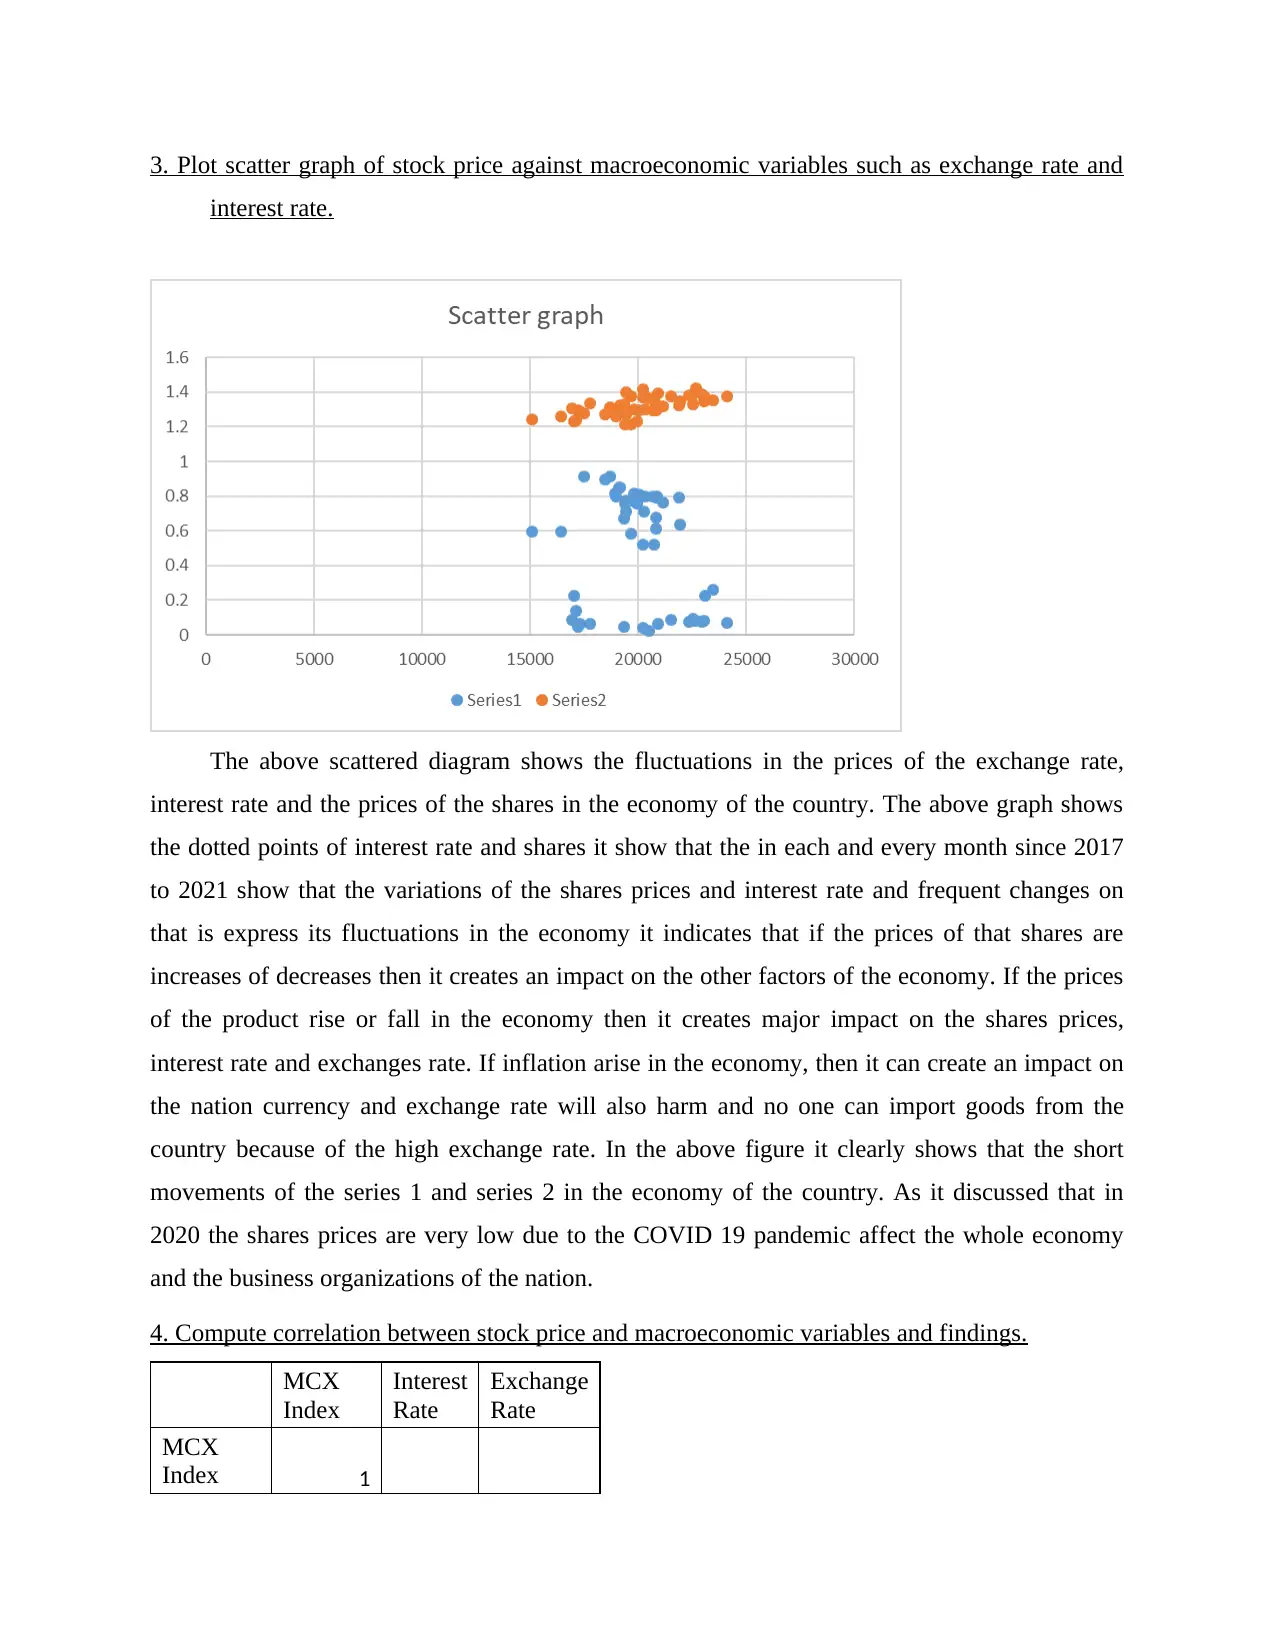
The above scattered diagram shows the fluctuations in the prices of the exchange rate,
interest rate and the prices of the shares in the economy of the country. The above graph shows
the dotted points of interest rate and shares it show that the in each and every month since 2017
to 2021 show that the variations of the shares prices and interest rate and frequent changes on
that is express its fluctuations in the economy it indicates that if the prices of that shares are
increases of decreases then it creates an impact on the other factors of the economy. If the prices
of the product rise or fall in the economy then it creates major impact on the shares prices,
interest rate and exchanges rate. If inflation arise in the economy, then it can create an impact on
the nation currency and exchange rate will also harm and no one can import goods from the
country because of the high exchange rate. In the above figure it clearly shows that the short
movements of the series 1 and series 2 in the economy of the country. As it discussed that in
2020 the shares prices are very low due to the COVID 19 pandemic affect the whole economy
and the business organizations of the nation.
4. Compute correlation between stock price and macroeconomic variables and findings.
MCX
Index
Interest
Rate
Exchange
Rate
MCX
Index 1
interest rate.
The above scattered diagram shows the fluctuations in the prices of the exchange rate,
interest rate and the prices of the shares in the economy of the country. The above graph shows
the dotted points of interest rate and shares it show that the in each and every month since 2017
to 2021 show that the variations of the shares prices and interest rate and frequent changes on
that is express its fluctuations in the economy it indicates that if the prices of that shares are
increases of decreases then it creates an impact on the other factors of the economy. If the prices
of the product rise or fall in the economy then it creates major impact on the shares prices,
interest rate and exchanges rate. If inflation arise in the economy, then it can create an impact on
the nation currency and exchange rate will also harm and no one can import goods from the
country because of the high exchange rate. In the above figure it clearly shows that the short
movements of the series 1 and series 2 in the economy of the country. As it discussed that in
2020 the shares prices are very low due to the COVID 19 pandemic affect the whole economy
and the business organizations of the nation.
4. Compute correlation between stock price and macroeconomic variables and findings.
MCX
Index
Interest
Rate
Exchange
Rate
MCX
Index 1
⊘ This is a preview!⊘
Do you want full access?
Subscribe today to unlock all pages.
Trusted by 1+ million students worldwide
Interest
Rate -0.22401 1
Exchange
Rate 0.623702 -0.4562 1
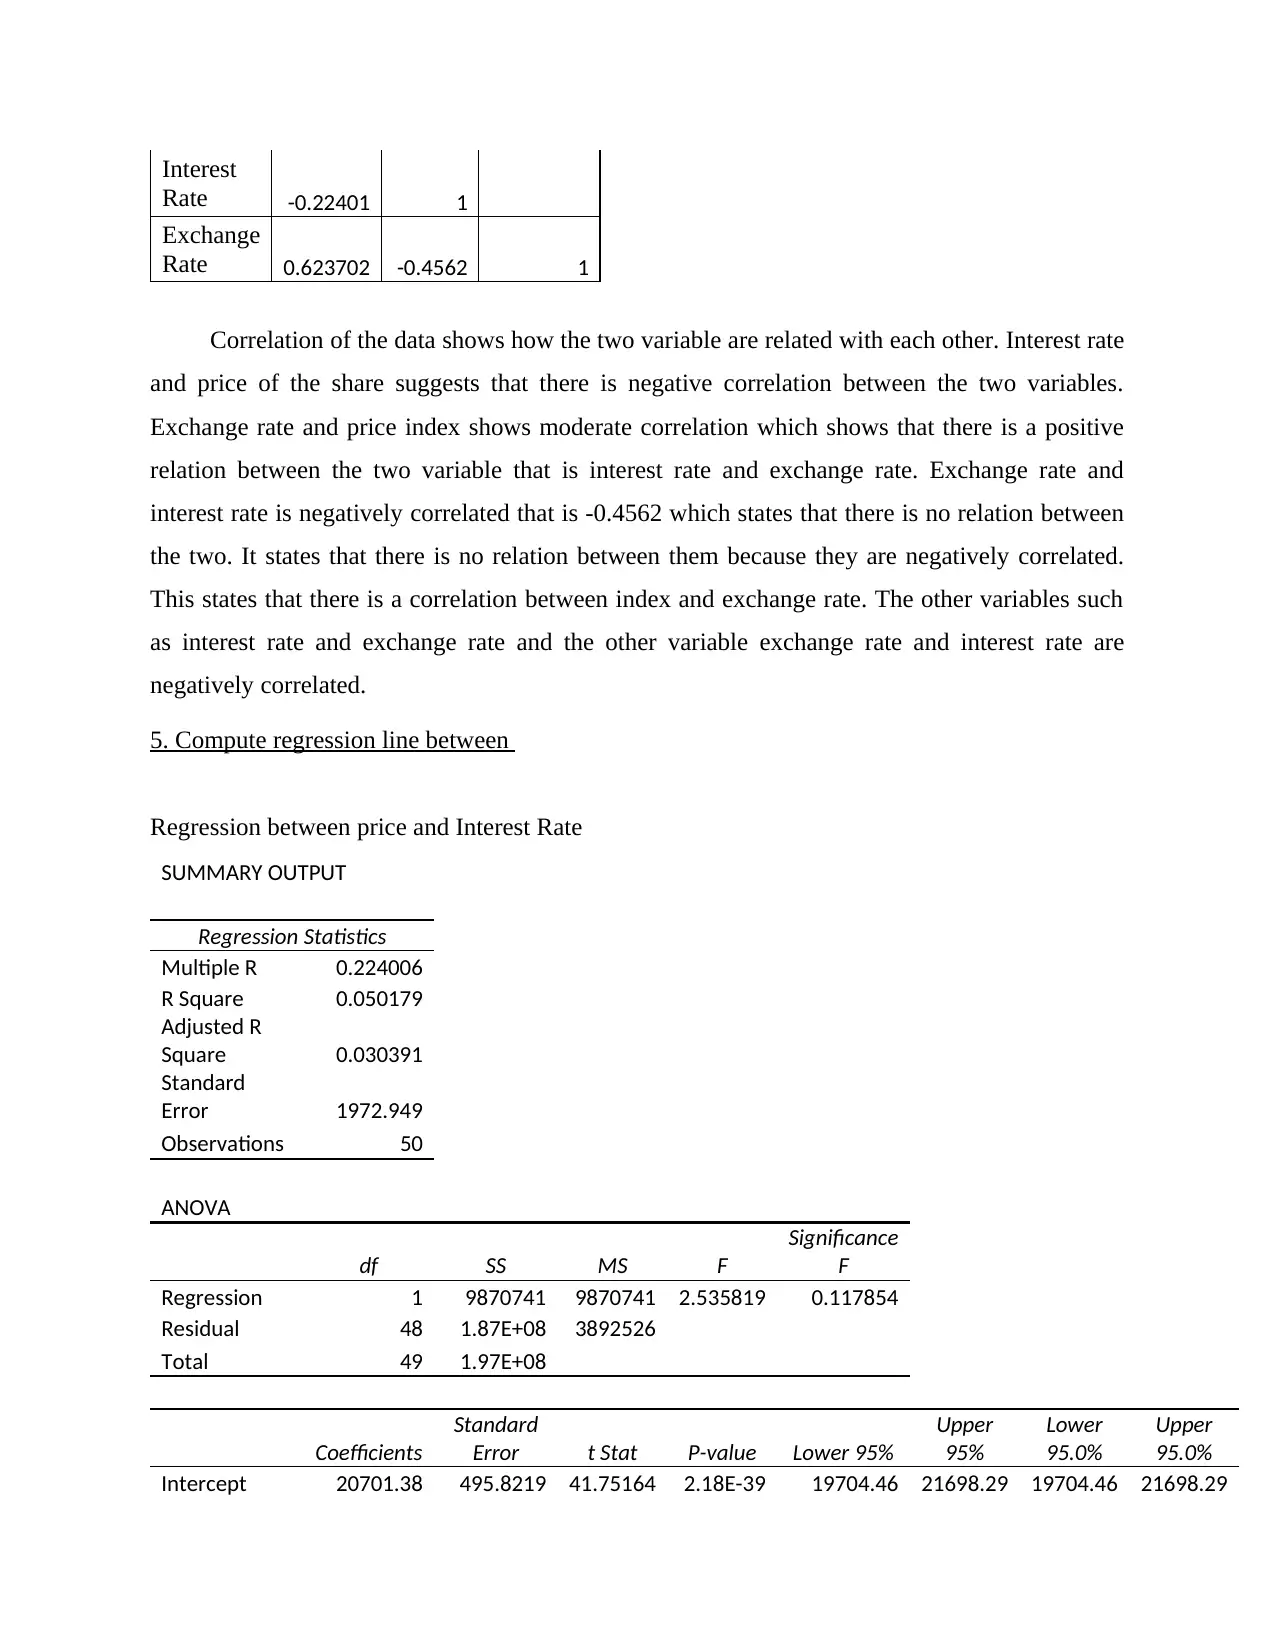
Correlation of the data shows how the two variable are related with each other. Interest rate
and price of the share suggests that there is negative correlation between the two variables.
Exchange rate and price index shows moderate correlation which shows that there is a positive
relation between the two variable that is interest rate and exchange rate. Exchange rate and
interest rate is negatively correlated that is -0.4562 which states that there is no relation between
the two. It states that there is no relation between them because they are negatively correlated.
This states that there is a correlation between index and exchange rate. The other variables such
as interest rate and exchange rate and the other variable exchange rate and interest rate are
negatively correlated.
5. Compute regression line between
Regression between price and Interest Rate
SUMMARY OUTPUT
Regression Statistics
Multiple R 0.224006
R Square 0.050179
Adjusted R
Square 0.030391
Standard
Error 1972.949
Observations 50
ANOVA
df SS MS F
Significance
F
Regression 1 9870741 9870741 2.535819 0.117854
Residual 48 1.87E+08 3892526
Total 49 1.97E+08
Coefficients
Standard
Error t Stat P-value Lower 95%
Upper
95%
Lower
95.0%
Upper
95.0%
Intercept 20701.38 495.8219 41.75164 2.18E-39 19704.46 21698.29 19704.46 21698.29
Rate -0.22401 1
Exchange
Rate 0.623702 -0.4562 1
Correlation of the data shows how the two variable are related with each other. Interest rate
and price of the share suggests that there is negative correlation between the two variables.
Exchange rate and price index shows moderate correlation which shows that there is a positive
relation between the two variable that is interest rate and exchange rate. Exchange rate and
interest rate is negatively correlated that is -0.4562 which states that there is no relation between
the two. It states that there is no relation between them because they are negatively correlated.
This states that there is a correlation between index and exchange rate. The other variables such
as interest rate and exchange rate and the other variable exchange rate and interest rate are
negatively correlated.
5. Compute regression line between
Regression between price and Interest Rate
SUMMARY OUTPUT
Regression Statistics
Multiple R 0.224006
R Square 0.050179
Adjusted R
Square 0.030391
Standard
Error 1972.949
Observations 50
ANOVA
df SS MS F
Significance
F
Regression 1 9870741 9870741 2.535819 0.117854
Residual 48 1.87E+08 3892526
Total 49 1.97E+08
Coefficients
Standard
Error t Stat P-value Lower 95%
Upper
95%
Lower
95.0%
Upper
95.0%
Intercept 20701.38 495.8219 41.75164 2.18E-39 19704.46 21698.29 19704.46 21698.29
Paraphrase This Document
Need a fresh take? Get an instant paraphrase of this document with our AI Paraphraser
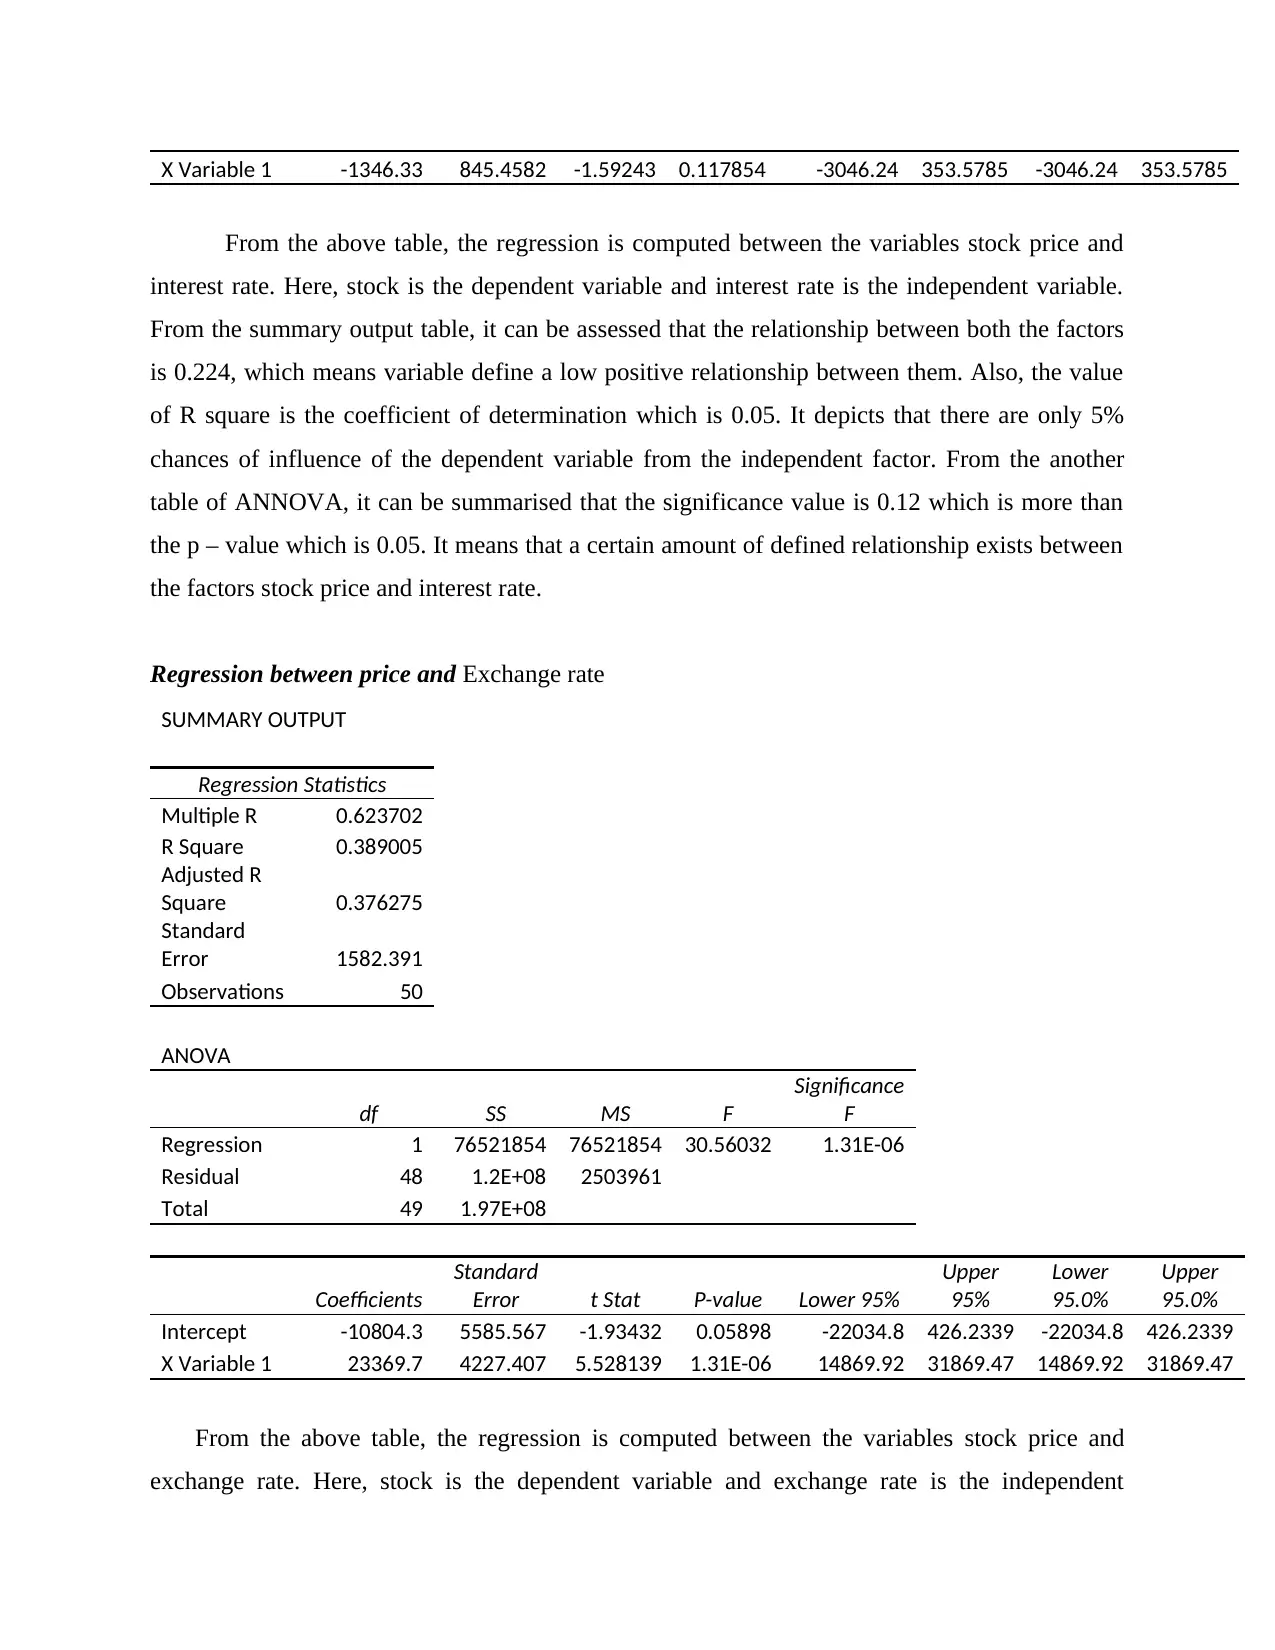
X Variable 1 -1346.33 845.4582 -1.59243 0.117854 -3046.24 353.5785 -3046.24 353.5785
From the above table, the regression is computed between the variables stock price and
interest rate. Here, stock is the dependent variable and interest rate is the independent variable.
From the summary output table, it can be assessed that the relationship between both the factors
is 0.224, which means variable define a low positive relationship between them. Also, the value
of R square is the coefficient of determination which is 0.05. It depicts that there are only 5%
chances of influence of the dependent variable from the independent factor. From the another
table of ANNOVA, it can be summarised that the significance value is 0.12 which is more than
the p – value which is 0.05. It means that a certain amount of defined relationship exists between
the factors stock price and interest rate.
Regression between price and Exchange rate
SUMMARY OUTPUT
Regression Statistics
Multiple R 0.623702
R Square 0.389005
Adjusted R
Square 0.376275
Standard
Error 1582.391
Observations 50
ANOVA
df SS MS F
Significance
F
Regression 1 76521854 76521854 30.56032 1.31E-06
Residual 48 1.2E+08 2503961
Total 49 1.97E+08
Coefficients
Standard
Error t Stat P-value Lower 95%
Upper
95%
Lower
95.0%
Upper
95.0%
Intercept -10804.3 5585.567 -1.93432 0.05898 -22034.8 426.2339 -22034.8 426.2339
X Variable 1 23369.7 4227.407 5.528139 1.31E-06 14869.92 31869.47 14869.92 31869.47
From the above table, the regression is computed between the variables stock price and
exchange rate. Here, stock is the dependent variable and exchange rate is the independent
From the above table, the regression is computed between the variables stock price and
interest rate. Here, stock is the dependent variable and interest rate is the independent variable.
From the summary output table, it can be assessed that the relationship between both the factors
is 0.224, which means variable define a low positive relationship between them. Also, the value
of R square is the coefficient of determination which is 0.05. It depicts that there are only 5%
chances of influence of the dependent variable from the independent factor. From the another
table of ANNOVA, it can be summarised that the significance value is 0.12 which is more than
the p – value which is 0.05. It means that a certain amount of defined relationship exists between
the factors stock price and interest rate.
Regression between price and Exchange rate
SUMMARY OUTPUT
Regression Statistics
Multiple R 0.623702
R Square 0.389005
Adjusted R
Square 0.376275
Standard
Error 1582.391
Observations 50
ANOVA
df SS MS F
Significance
F
Regression 1 76521854 76521854 30.56032 1.31E-06
Residual 48 1.2E+08 2503961
Total 49 1.97E+08
Coefficients
Standard
Error t Stat P-value Lower 95%
Upper
95%
Lower
95.0%
Upper
95.0%
Intercept -10804.3 5585.567 -1.93432 0.05898 -22034.8 426.2339 -22034.8 426.2339
X Variable 1 23369.7 4227.407 5.528139 1.31E-06 14869.92 31869.47 14869.92 31869.47
From the above table, the regression is computed between the variables stock price and
exchange rate. Here, stock is the dependent variable and exchange rate is the independent
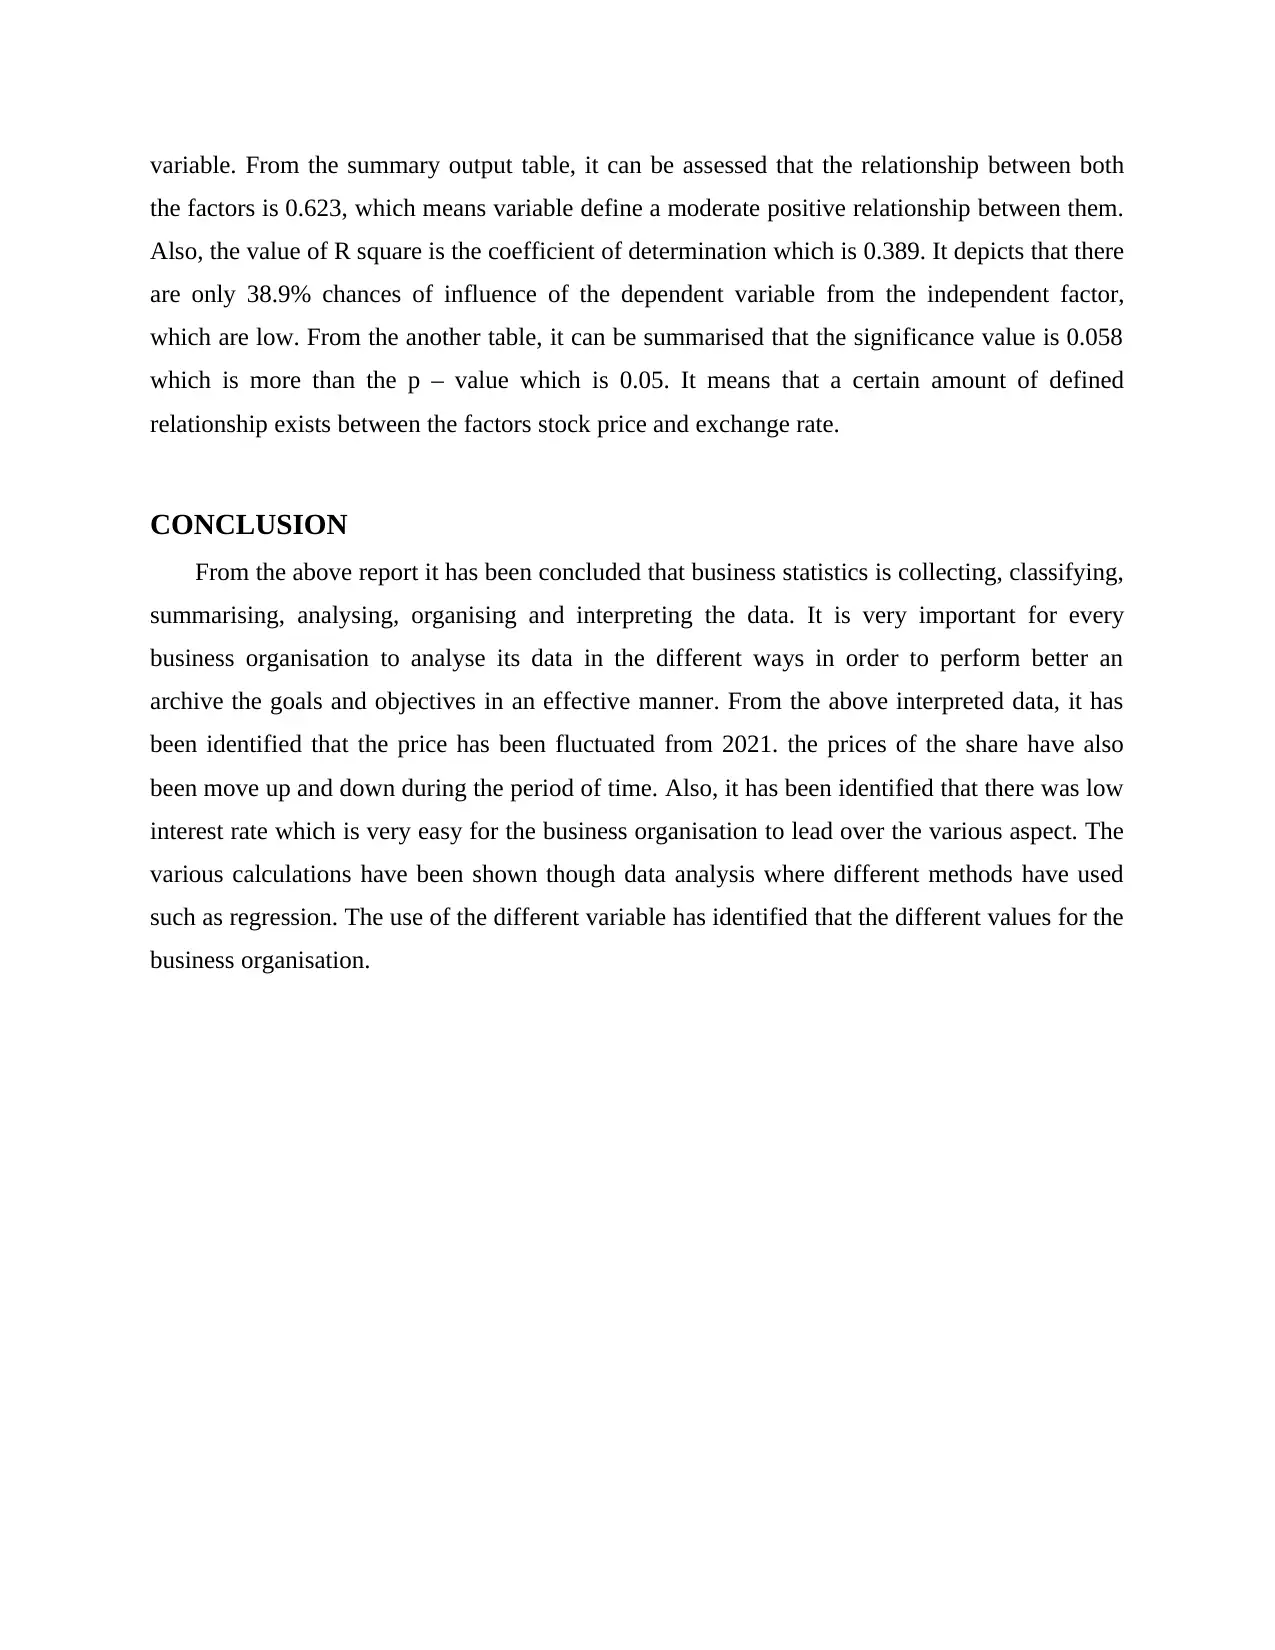
variable. From the summary output table, it can be assessed that the relationship between both
the factors is 0.623, which means variable define a moderate positive relationship between them.
Also, the value of R square is the coefficient of determination which is 0.389. It depicts that there
are only 38.9% chances of influence of the dependent variable from the independent factor,
which are low. From the another table, it can be summarised that the significance value is 0.058
which is more than the p – value which is 0.05. It means that a certain amount of defined
relationship exists between the factors stock price and exchange rate.
CONCLUSION
From the above report it has been concluded that business statistics is collecting, classifying,
summarising, analysing, organising and interpreting the data. It is very important for every
business organisation to analyse its data in the different ways in order to perform better an
archive the goals and objectives in an effective manner. From the above interpreted data, it has
been identified that the price has been fluctuated from 2021. the prices of the share have also
been move up and down during the period of time. Also, it has been identified that there was low
interest rate which is very easy for the business organisation to lead over the various aspect. The
various calculations have been shown though data analysis where different methods have used
such as regression. The use of the different variable has identified that the different values for the
business organisation.
⊘ This is a preview!⊘
Do you want full access?
Subscribe today to unlock all pages.
Trusted by 1+ million students worldwide
REFERENCES
Books and Journals
Babbie, E., Wagner III, W.E. and Zaino, J., 2022. Adventures in social research: Data analysis
using IBM SPSS statistics. Sage Publications.
Hoerl, R.W. and Snee, R.D., 2020. Statistical thinking: Improving business performance. John
Wiley & Sons.
Jackson, K. and Bazeley, P., 2019. Qualitative data analysis with NVivo. Sage.
Mola, F., Conversano, C. and Vichi, M. eds., 2018. Classification,(Big) Data Analysis and
Statistical Learning. New York: Springer.
Myers, R., 2019. Data management and statistical analysis techniques. Scientific e-Resources.
Purwanto, A., 2020. Does Quality, Safety, Environment and Food Safety Management
SystemInfluence Business Performance? Answersfrom Indonesian Packaging
Industries. International Journal of Control and Automation, 13(1), pp.22-35.
Qin, S.J. and Chiang, L.H., 2019. Advances and opportunities in machine learning for process
data analytics. Computers & Chemical Engineering, 126, pp.465-473.
Rydell, L. and Kucera, J., 2021. Cognitive attitudes, behavioral choices, and purchasing habits
during the COVID-19 pandemic. Journal of Self-Governance & Management
Economics, 9(4).
Sisson, S.A., Fan, Y. and Beaumont, M. eds., 2018. Handbook of approximate Bayesian
computation. CRC Press.
Thompson, K. and Kim, H.J., 2022. Incorporating Economic Conditions in Synthetic Microdata
for Business Programs. Journal of Survey Statistics and Methodology.
1 out of 10
Related Documents


Your All-in-One AI-Powered Toolkit for Academic Success.
+13062052269
info@desklib.com
Available 24*7 on WhatsApp / Email
![[object Object]](/_next/static/media/star-bottom.7253800d.svg)
Unlock your academic potential
Copyright © 2020–2025 A2Z Services. All Rights Reserved. Developed and managed by ZUCOL.