Analysis of Climate Change Integration into Business Strategy Report
VerifiedAdded on 2023/06/15
|17
|3647
|203
Report
AI Summary
This report investigates the integration of climate change into business strategies, focusing on its impact on carbon disclosure scores and the role of legitimacy theory. It reviews existing literature, presents a conceptual model with independent variables like climate change integration, internal carbon pricing, and risk consideration, and a dependent variable of carbon disclosure score, controlled by firm size. The research employs descriptive and inferential statistics, analyzing data from a sample of 56 companies from the CDP survey 2015, adopting random sampling, data was collected from 28 Companies responding YES and 28 Companies responding NO. The findings reveal variations in carbon disclosure scores based on the integration of climate change into business strategy, with companies integrating climate change showing higher disclosure scores. The report also discusses the implications of legitimacy theory, suggesting that companies perceived as legitimate are more likely to integrate GHG initiatives into their business strategies.
Assigned research question: Is climate change integrated into your business
strategy.
Introduction
Climate changes have significant influences on the visions and profit maximisation strategies of
the organisation. The awareness of the climate changes is increasing day by day throughout the
world in almost every industry. Every organisation has its distinctive opportunities, challenges
and integrating climate change which plays a key role in the policy-making process. The
fundamental issue we want to address here is the incorporation of climate change in the business
strategy. Furthermore, we will relate this issue to the legitimacy theory which means an
organisation seeks to ensure that they operate within the bounds and norms according to the local
societies. To put in simple words, the business activities are perceived to be legitimate. The
bounds and norms are not static so the organisation has to be responsive and the best way is to
rely on the notion of a social contract.
Literature Review –
A plethora of research is available which deal with the issue of climate change and its
incorporation in the process of business policymaking. In this section, we will cover some
important previous studies that deal with the issue of climate change as well as with the
Paraphrase This Document
Need a fresh take? Get an instant paraphrase of this document with our AI Paraphraser
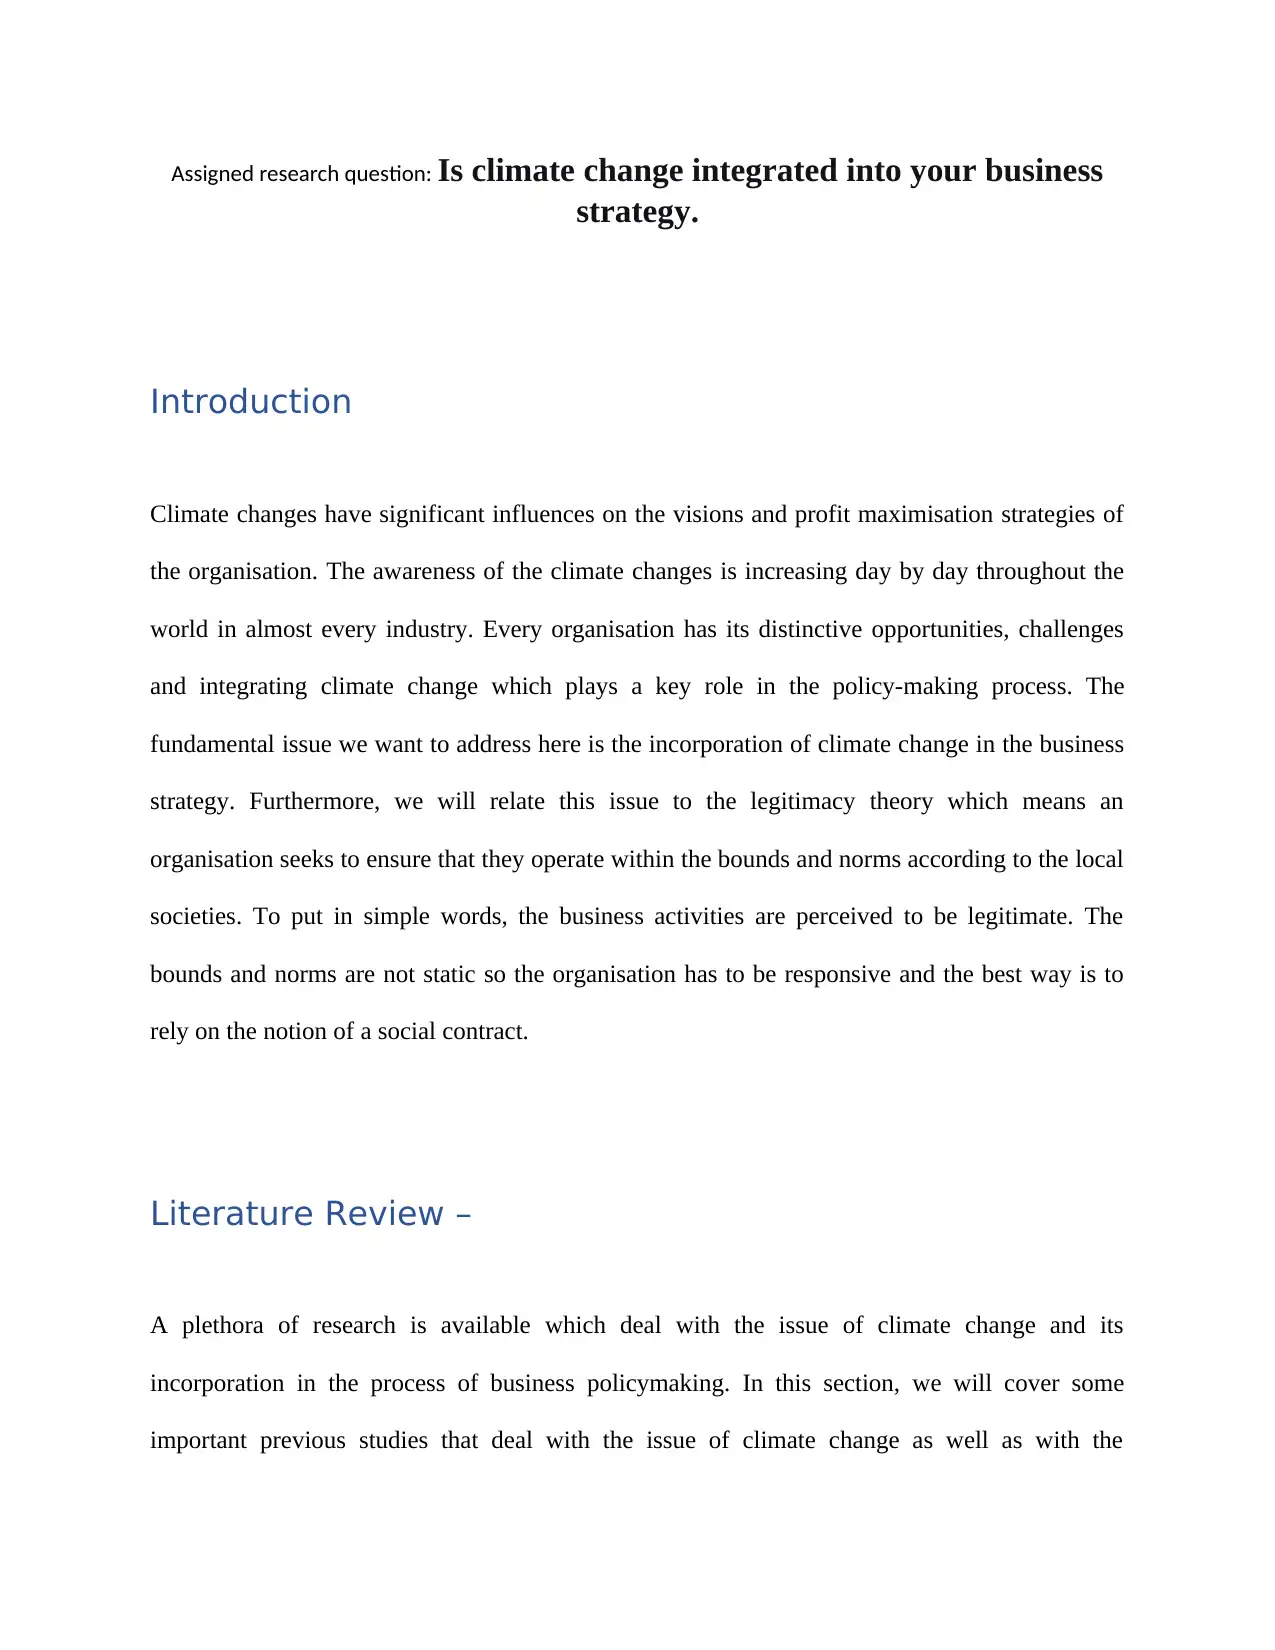
perspective of legitimacy theory. An important study conducted by the McKinsey & Company
which dealing with the generalised perspective on climate change risk that varies industry to
industry. This research is covering almost all major sectors like oil and gas, Chemicals,
agriculture, transport etc. The best way to compile that report is show with the help of the
following chart;
Figure 1. Impact of McKinsey & Co on carbon disclosure. Source: McKinsey & Company
(2017)
Legitimacy theory also aids to assess the Green House Gas emission and social performance of
the firm making it one of the best tool analyse and compare the firm’s performance with climate
change.
A research study had highlighted the issue of legitimacy gap and concluding that this gap arises
when there is a clash between expectations of society and actions of an organisation. There is a
strong correlation between the expectations of society and legitimacy gap. To put in other words,
which dealing with the generalised perspective on climate change risk that varies industry to
industry. This research is covering almost all major sectors like oil and gas, Chemicals,
agriculture, transport etc. The best way to compile that report is show with the help of the
following chart;
Figure 1. Impact of McKinsey & Co on carbon disclosure. Source: McKinsey & Company
(2017)
Legitimacy theory also aids to assess the Green House Gas emission and social performance of
the firm making it one of the best tool analyse and compare the firm’s performance with climate
change.
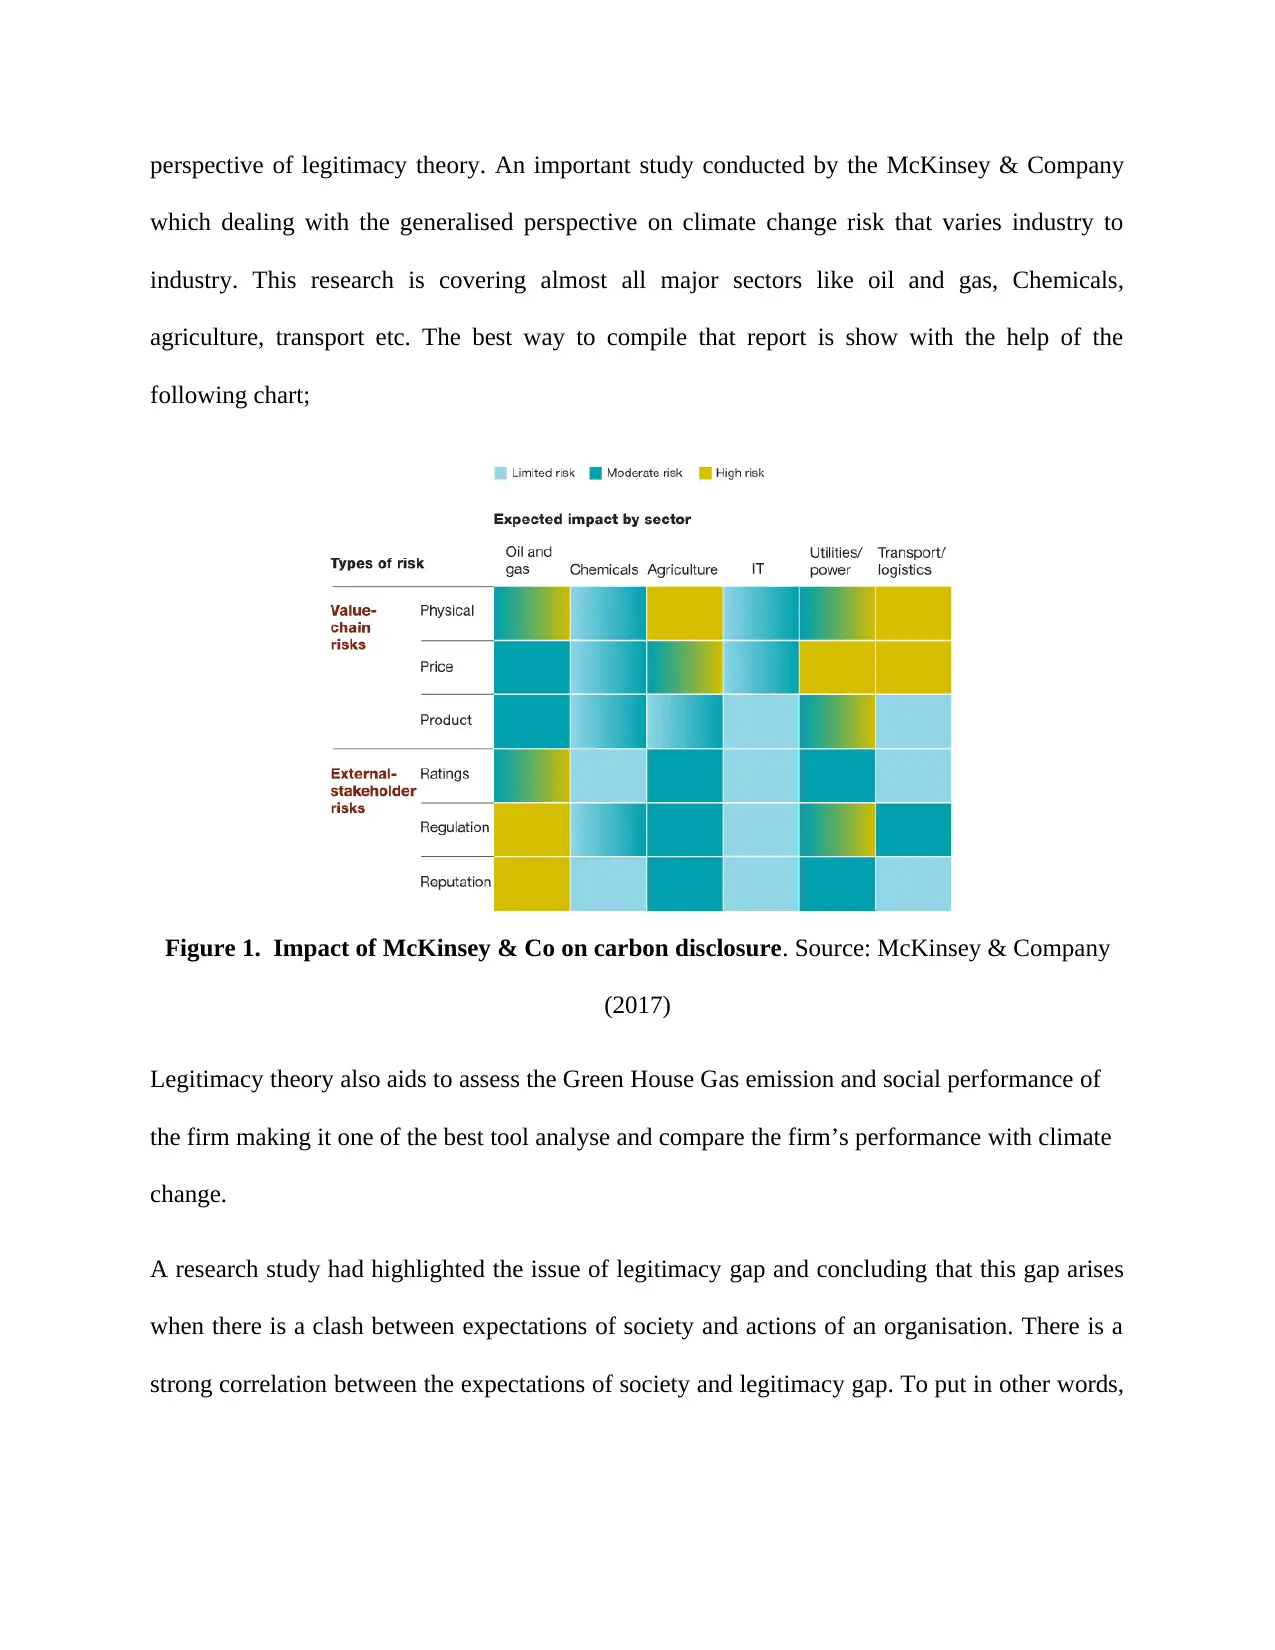
A research study had highlighted the issue of legitimacy gap and concluding that this gap arises
when there is a clash between expectations of society and actions of an organisation. There is a
strong correlation between the expectations of society and legitimacy gap. To put in other words,
it means the gap will increase when the expectations of society changes or the unknown
information become known to the society (Set
hi, 1975).
Figure 2. Legitimacy gap. Source: Sethi (1975)
Another research is suggesting the climate change action plan that can be used as a proactive
management of risk that is associated with the climate and also discussing the opportunities and
impacts. This study is based on five stages where the first stage is deal with the understanding
footprints which means mapping the emissions and improving the reporting and accuracy. The
second step is describing the implementation of suitable measures to reduce these emissions. The
next stage is dealing with the engaging externalities which mean for instance to develop methane
and shale development communication or take part in the process of global legislation and
regulations. The final stage is dealing with the building capacity which means to give proper
attention to research and development to form an action plan to incorporate the climate change in
business strategies (Mousa and Hassan, 2015).
Conceptual Model:
⊘ This is a preview!⊘
Do you want full access?
Subscribe today to unlock all pages.
Trusted by 1+ million students worldwide
Integration of climate change in business
Internal price of carbon
Future consideration of risk
Carbon disclosure score
Independent Variables
Control variables: Size of the firm
Dependent Variables
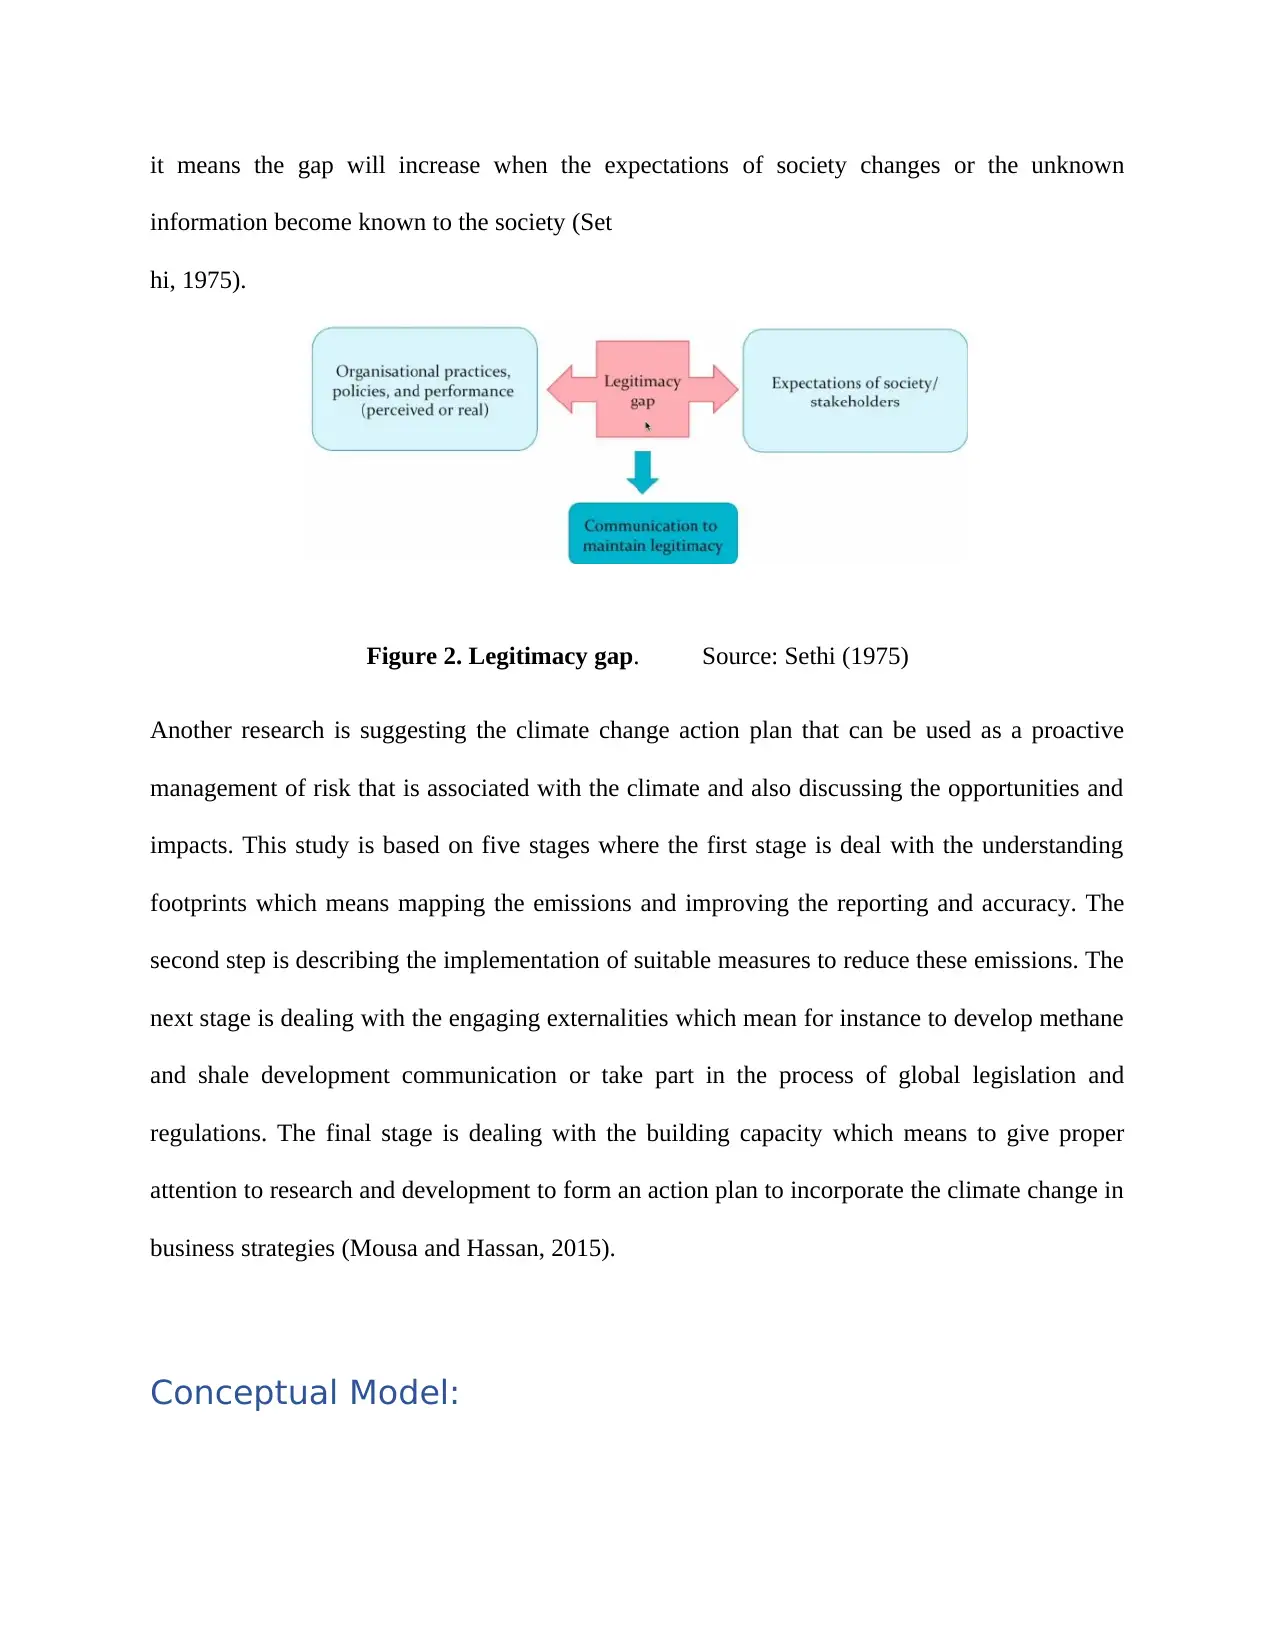
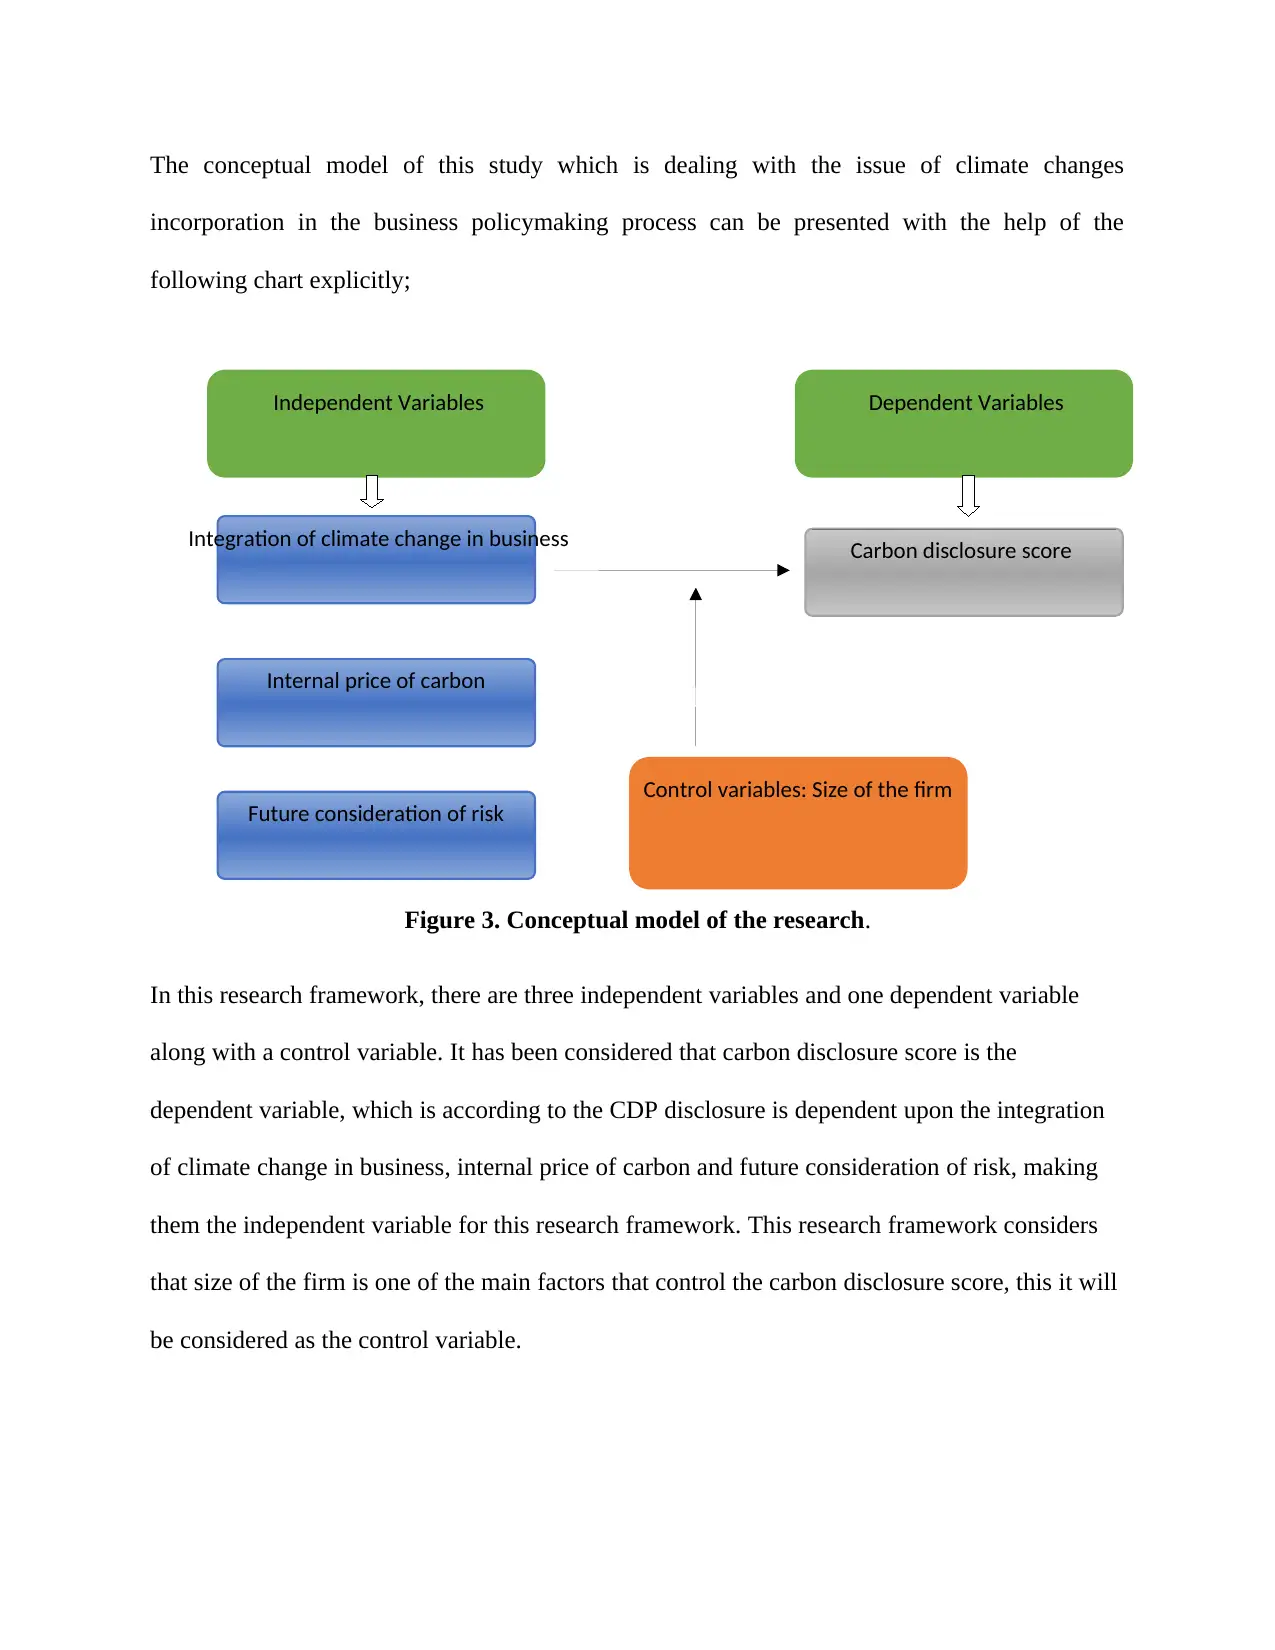
The conceptual model of this study which is dealing with the issue of climate changes
incorporation in the business policymaking process can be presented with the help of the
following chart explicitly;
Figure 3. Conceptual model of the research.
In this research framework, there are three independent variables and one dependent variable
along with a control variable. It has been considered that carbon disclosure score is the
dependent variable, which is according to the CDP disclosure is dependent upon the integration
of climate change in business, internal price of carbon and future consideration of risk, making
them the independent variable for this research framework. This research framework considers
that size of the firm is one of the main factors that control the carbon disclosure score, this it will
be considered as the control variable.
Internal price of carbon
Future consideration of risk
Carbon disclosure score
Independent Variables
Control variables: Size of the firm
Dependent Variables
The conceptual model of this study which is dealing with the issue of climate changes
incorporation in the business policymaking process can be presented with the help of the
following chart explicitly;
Figure 3. Conceptual model of the research.
In this research framework, there are three independent variables and one dependent variable
along with a control variable. It has been considered that carbon disclosure score is the
dependent variable, which is according to the CDP disclosure is dependent upon the integration
of climate change in business, internal price of carbon and future consideration of risk, making
them the independent variable for this research framework. This research framework considers
that size of the firm is one of the main factors that control the carbon disclosure score, this it will
be considered as the control variable.
Paraphrase This Document
Need a fresh take? Get an instant paraphrase of this document with our AI Paraphraser
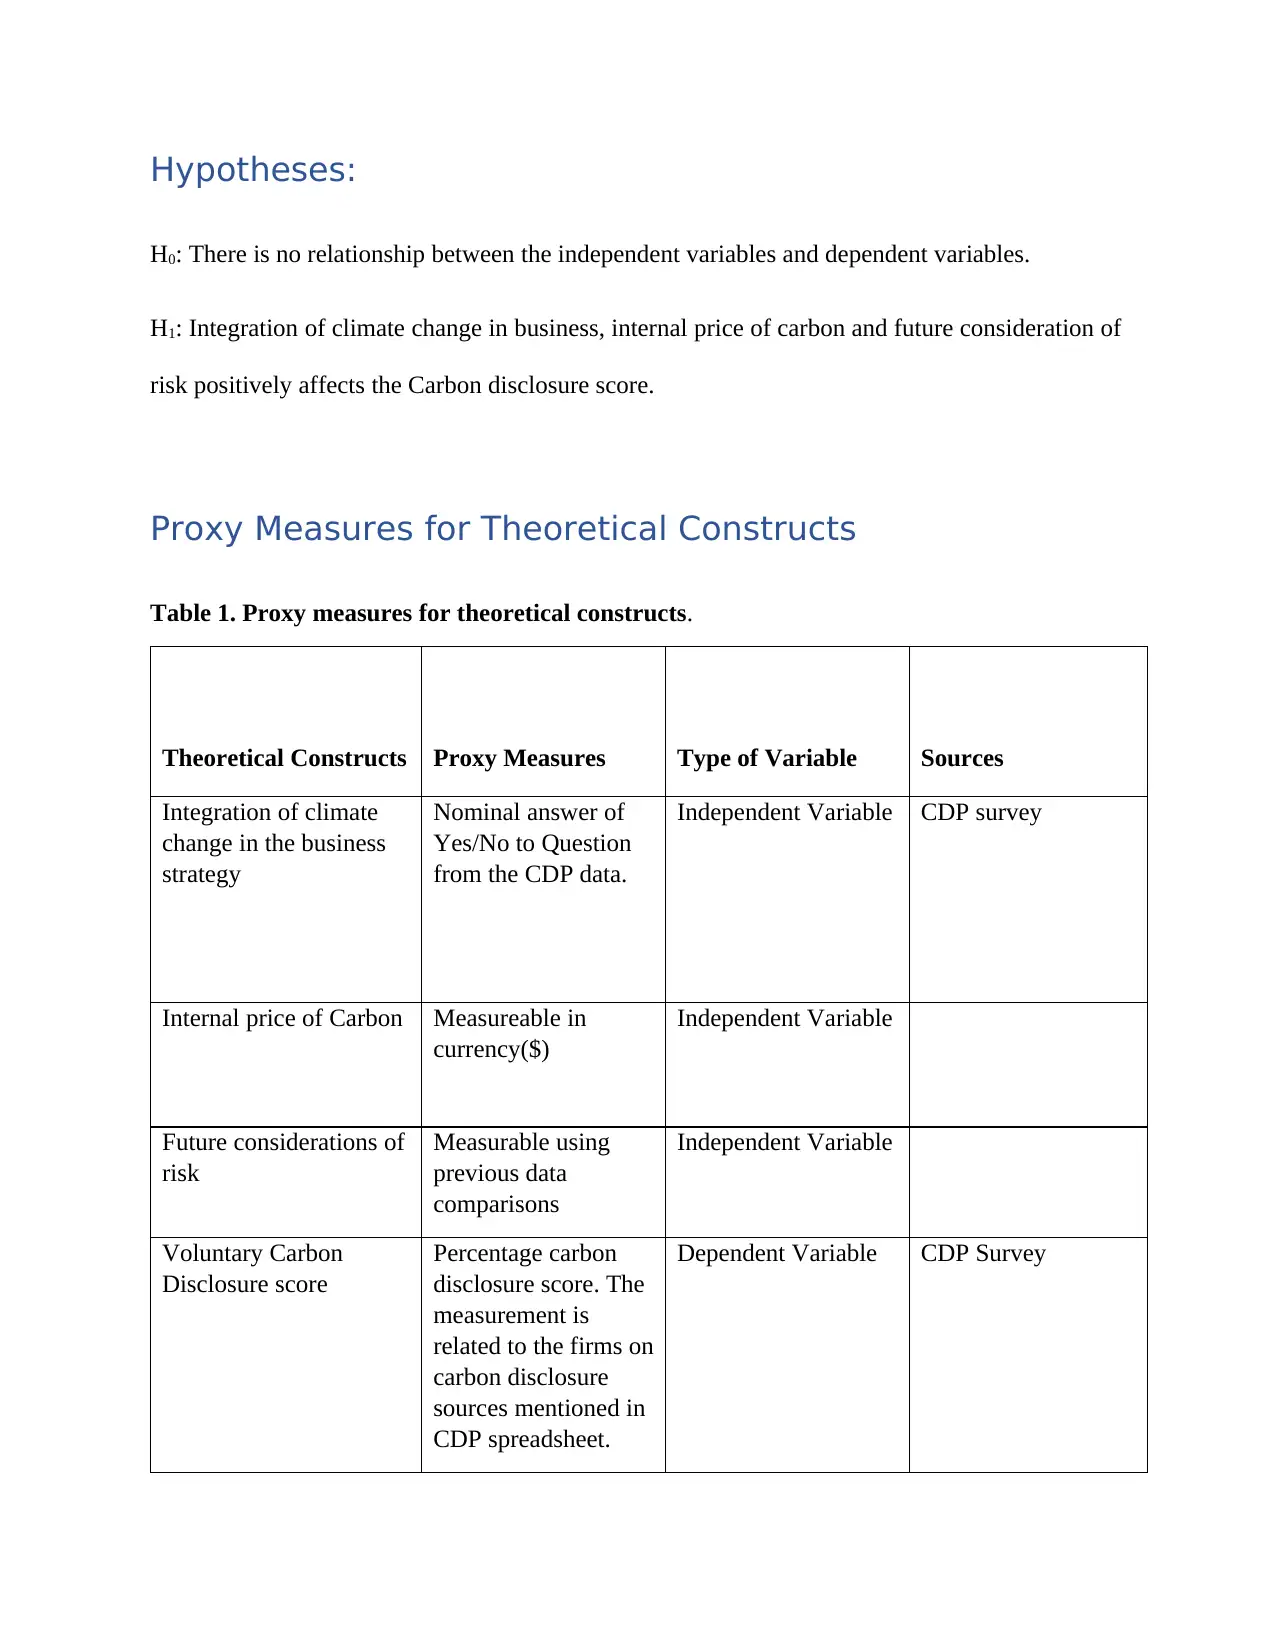
Hypotheses:
H0: There is no relationship between the independent variables and dependent variables.
H1: Integration of climate change in business, internal price of carbon and future consideration of
risk positively affects the Carbon disclosure score.
Proxy Measures for Theoretical Constructs
Table 1. Proxy measures for theoretical constructs.
Theoretical Constructs Proxy Measures Type of Variable Sources
Integration of climate
change in the business
strategy
Nominal answer of
Yes/No to Question
from the CDP data.
Independent Variable CDP survey
Internal price of Carbon Measureable in
currency($)
Independent Variable
Future considerations of
risk
Measurable using
previous data
comparisons
Independent Variable
Voluntary Carbon
Disclosure score
Percentage carbon
disclosure score. The
measurement is
related to the firms on
carbon disclosure
sources mentioned in
CDP spreadsheet.
Dependent Variable CDP Survey
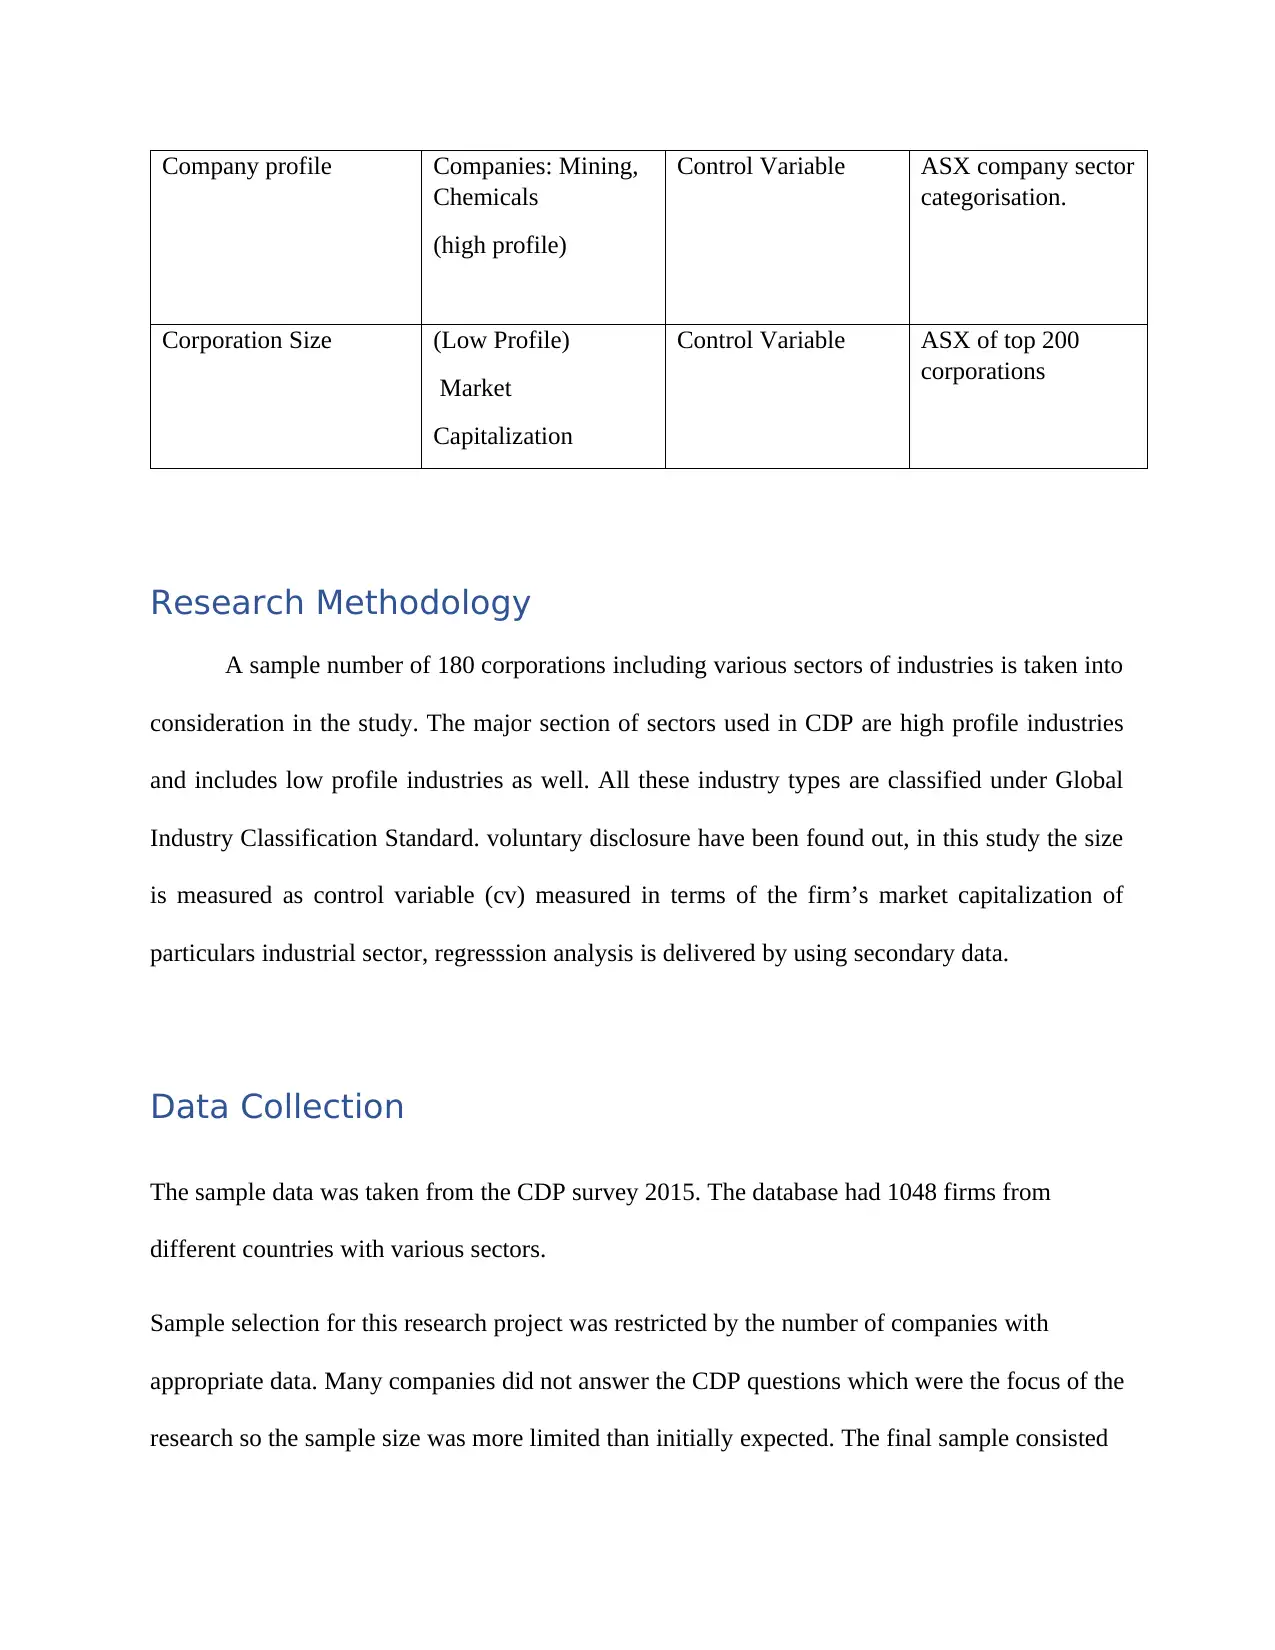
Company profile Companies: Mining,
Chemicals
(high profile)
Control Variable ASX company sector
categorisation.
Corporation Size (Low Profile)
Market
Capitalization
Control Variable ASX of top 200
corporations
Research Methodology
A sample number of 180 corporations including various sectors of industries is taken into
consideration in the study. The major section of sectors used in CDP are high profile industries
and includes low profile industries as well. All these industry types are classified under Global
Industry Classification Standard. voluntary disclosure have been found out, in this study the size
is measured as control variable (cv) measured in terms of the firm’s market capitalization of
particulars industrial sector, regresssion analysis is delivered by using secondary data.
Data Collection
The sample data was taken from the CDP survey 2015. The database had 1048 firms from
different countries with various sectors.
Sample selection for this research project was restricted by the number of companies with
appropriate data. Many companies did not answer the CDP questions which were the focus of the
research so the sample size was more limited than initially expected. The final sample consisted
⊘ This is a preview!⊘
Do you want full access?
Subscribe today to unlock all pages.
Trusted by 1+ million students worldwide
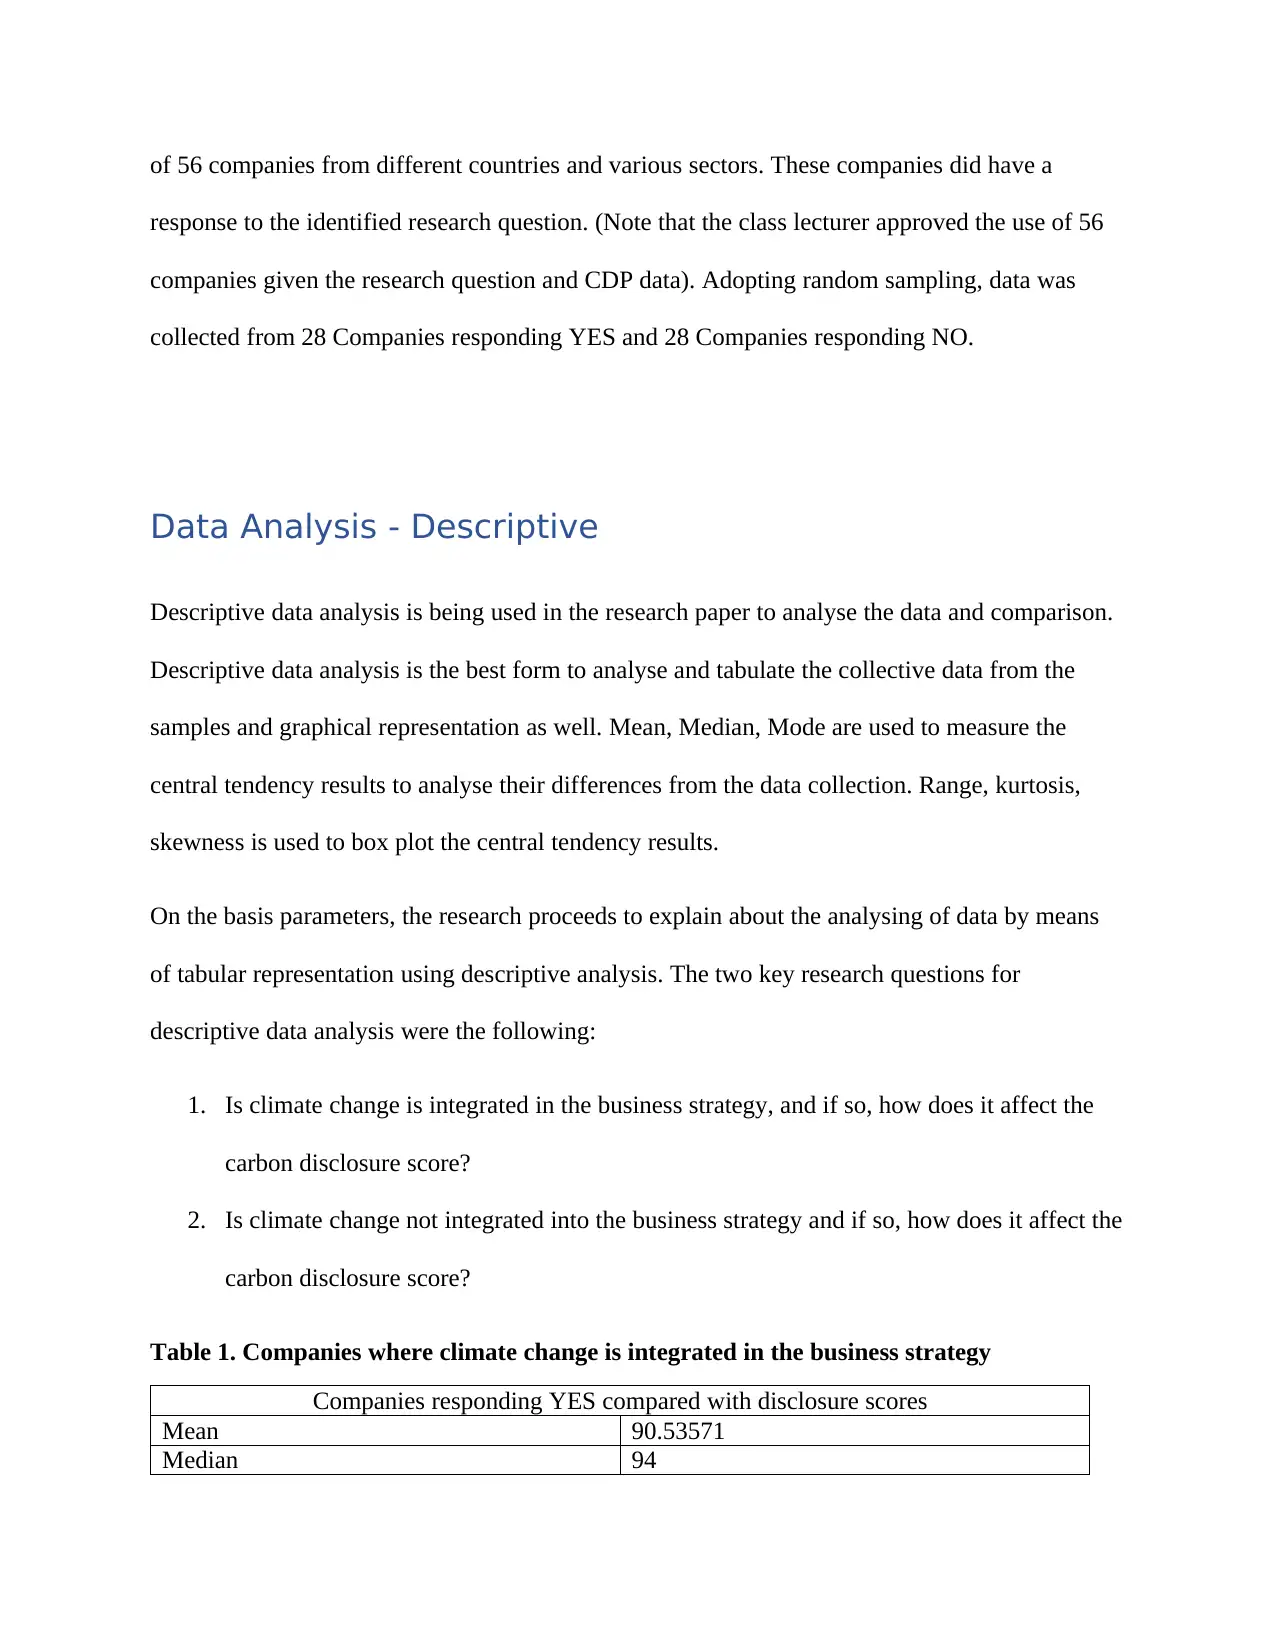
of 56 companies from different countries and various sectors. These companies did have a
response to the identified research question. (Note that the class lecturer approved the use of 56
companies given the research question and CDP data). Adopting random sampling, data was
collected from 28 Companies responding YES and 28 Companies responding NO.
Data Analysis - Descriptive
Descriptive data analysis is being used in the research paper to analyse the data and comparison.
Descriptive data analysis is the best form to analyse and tabulate the collective data from the
samples and graphical representation as well. Mean, Median, Mode are used to measure the
central tendency results to analyse their differences from the data collection. Range, kurtosis,
skewness is used to box plot the central tendency results.
On the basis parameters, the research proceeds to explain about the analysing of data by means
of tabular representation using descriptive analysis. The two key research questions for
descriptive data analysis were the following:
1. Is climate change is integrated in the business strategy, and if so, how does it affect the
carbon disclosure score?
2. Is climate change not integrated into the business strategy and if so, how does it affect the
carbon disclosure score?
Table 1. Companies where climate change is integrated in the business strategy
Companies responding YES compared with disclosure scores
Mean 90.53571
Median 94
Paraphrase This Document
Need a fresh take? Get an instant paraphrase of this document with our AI Paraphraser
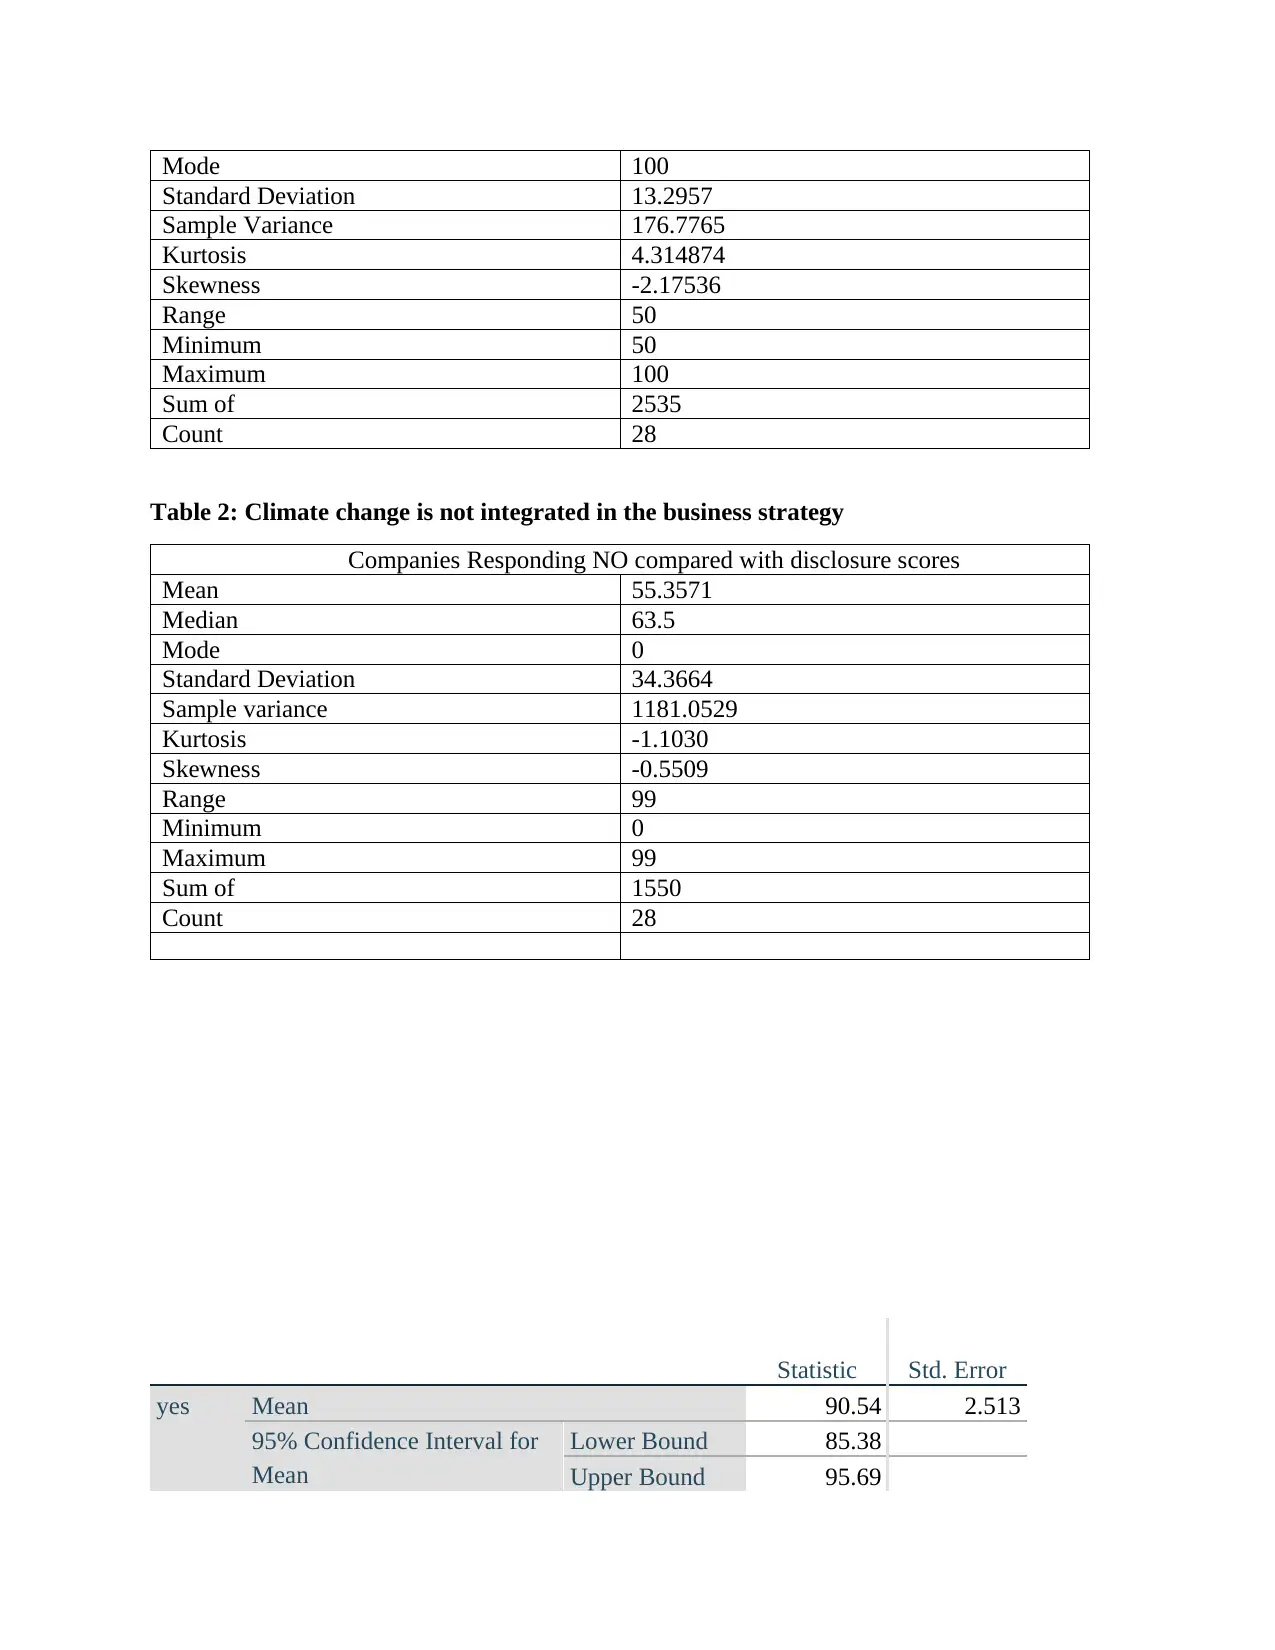
Mode 100
Standard Deviation 13.2957
Sample Variance 176.7765
Kurtosis 4.314874
Skewness -2.17536
Range 50
Minimum 50
Maximum 100
Sum of 2535
Count 28
Table 2: Climate change is not integrated in the business strategy
Companies Responding NO compared with disclosure scores
Mean 55.3571
Median 63.5
Mode 0
Standard Deviation 34.3664
Sample variance 1181.0529
Kurtosis -1.1030
Skewness -0.5509
Range 99
Minimum 0
Maximum 99
Sum of 1550
Count 28
Statistic Std. Error
yes Mean 90.54 2.513
95% Confidence Interval for
Mean
Lower Bound 85.38
Upper Bound 95.69
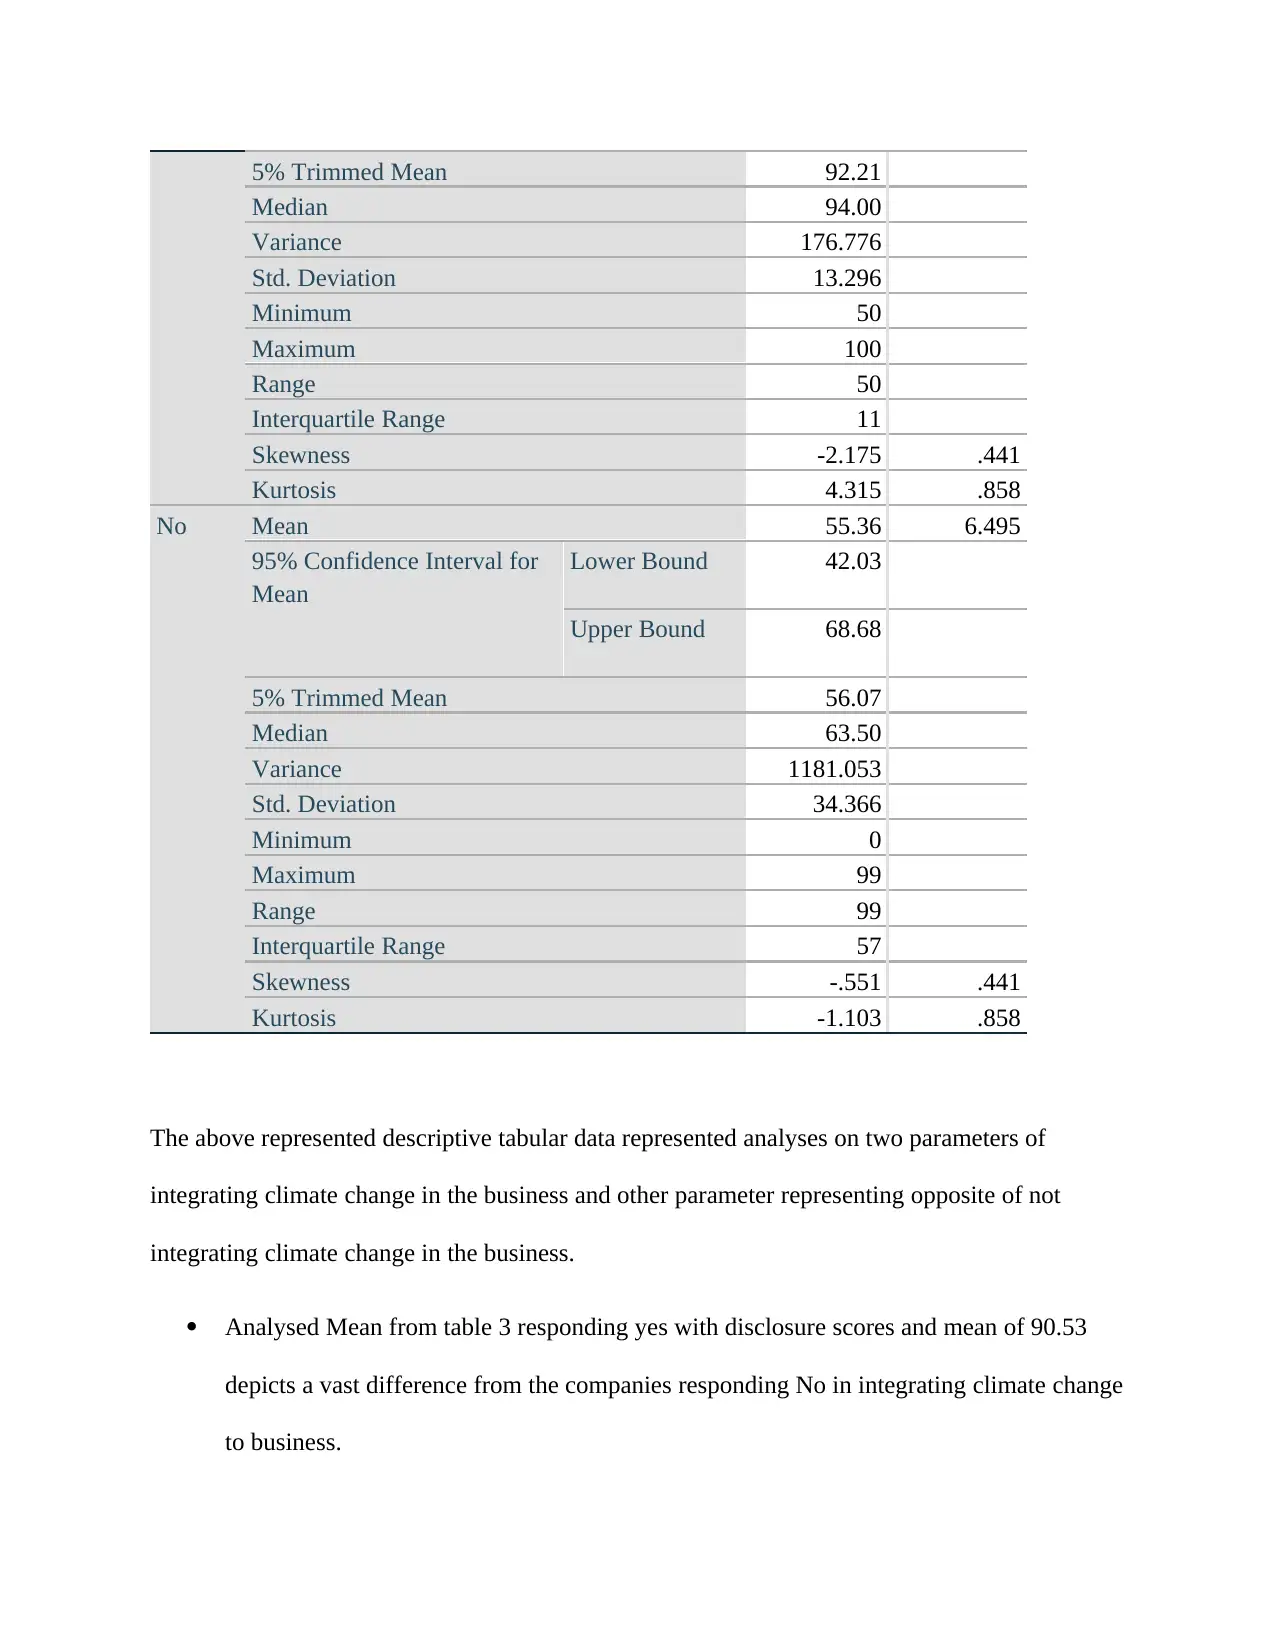
5% Trimmed Mean 92.21
Median 94.00
Variance 176.776
Std. Deviation 13.296
Minimum 50
Maximum 100
Range 50
Interquartile Range 11
Skewness -2.175 .441
Kurtosis 4.315 .858
No Mean 55.36 6.495
95% Confidence Interval for
Mean
Lower Bound 42.03
Upper Bound 68.68
5% Trimmed Mean 56.07
Median 63.50
Variance 1181.053
Std. Deviation 34.366
Minimum 0
Maximum 99
Range 99
Interquartile Range 57
Skewness -.551 .441
Kurtosis -1.103 .858
The above represented descriptive tabular data represented analyses on two parameters of
integrating climate change in the business and other parameter representing opposite of not
integrating climate change in the business.
Analysed Mean from table 3 responding yes with disclosure scores and mean of 90.53
depicts a vast difference from the companies responding No in integrating climate change
to business.
⊘ This is a preview!⊘
Do you want full access?
Subscribe today to unlock all pages.
Trusted by 1+ million students worldwide
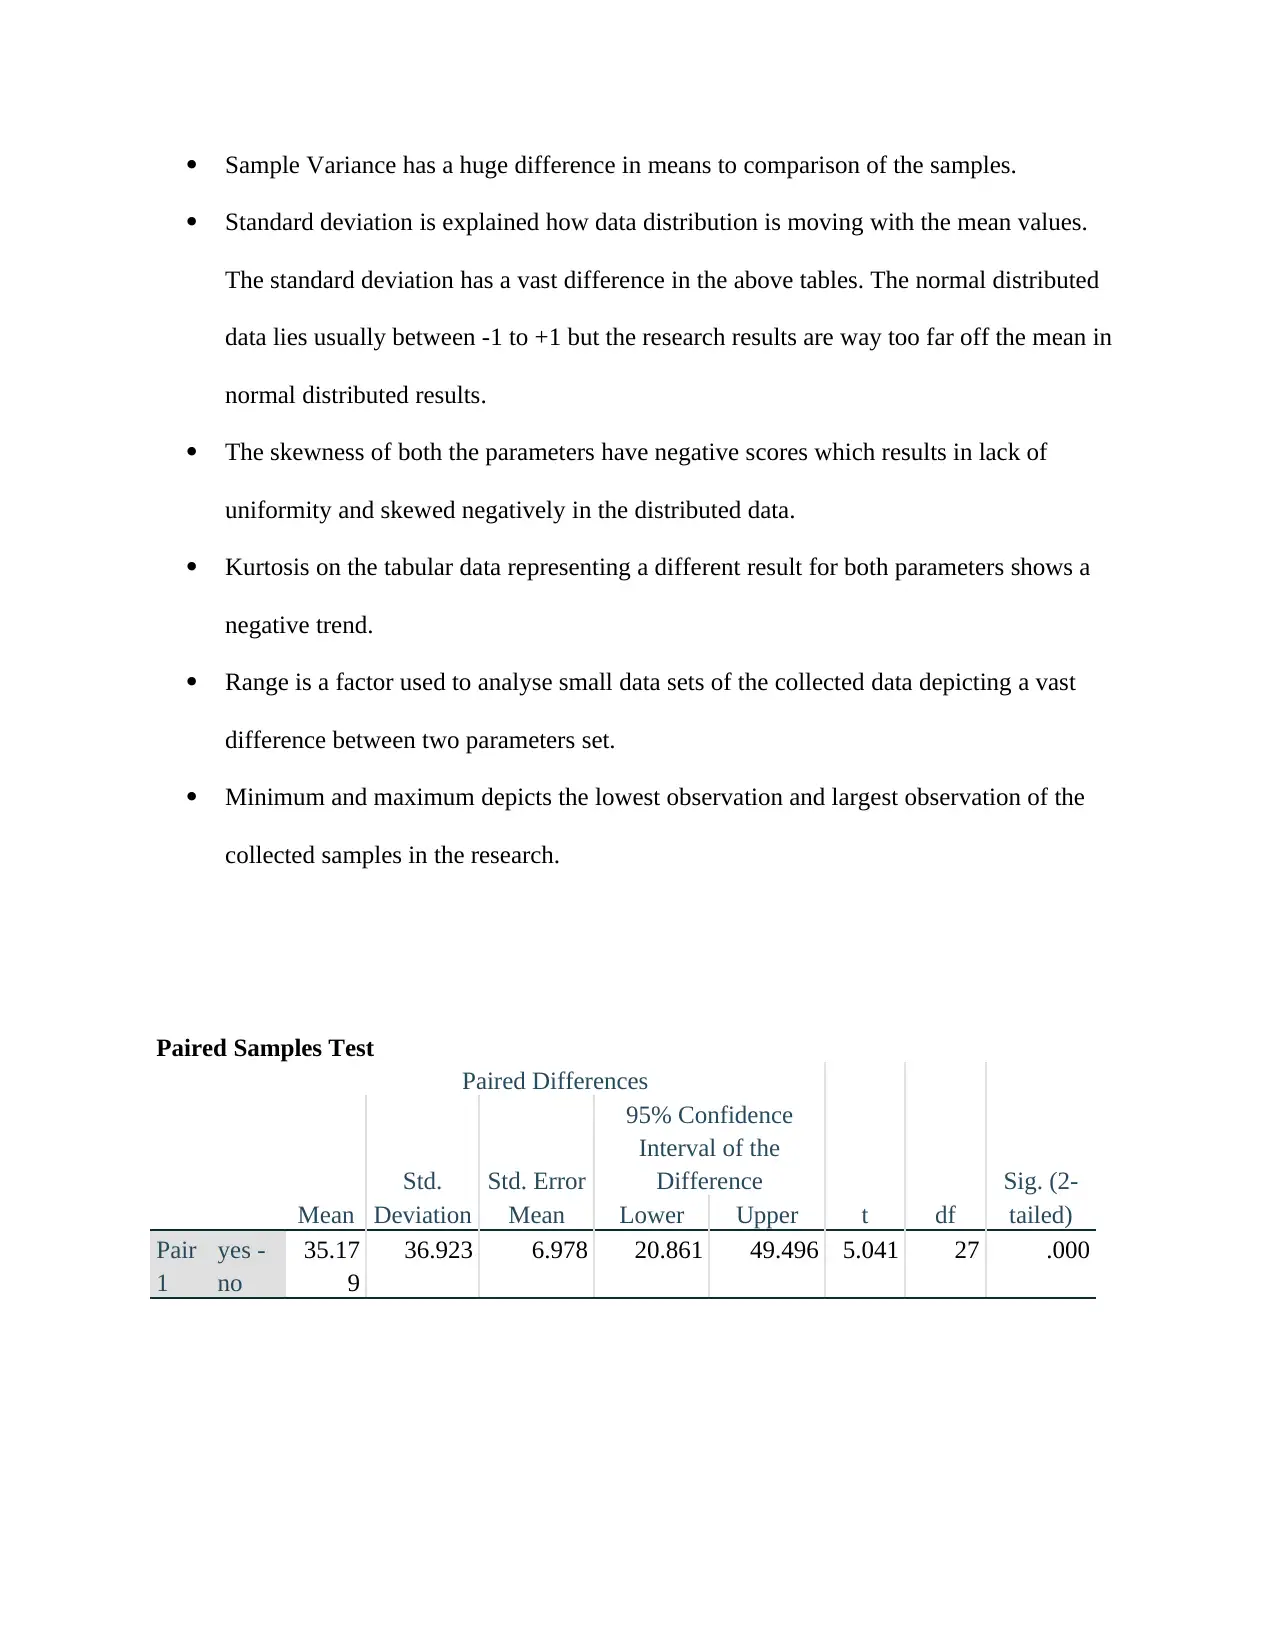
Sample Variance has a huge difference in means to comparison of the samples.
Standard deviation is explained how data distribution is moving with the mean values.
The standard deviation has a vast difference in the above tables. The normal distributed
data lies usually between -1 to +1 but the research results are way too far off the mean in
normal distributed results.
The skewness of both the parameters have negative scores which results in lack of
uniformity and skewed negatively in the distributed data.
Kurtosis on the tabular data representing a different result for both parameters shows a
negative trend.
Range is a factor used to analyse small data sets of the collected data depicting a vast
difference between two parameters set.
Minimum and maximum depicts the lowest observation and largest observation of the
collected samples in the research.
Paired Samples Test
Paired Differences
t df
Sig. (2-
tailed)Mean
Std.
Deviation
Std. Error
Mean
95% Confidence
Interval of the
Difference
Lower Upper
Pair
1
yes -
no
35.17
9
36.923 6.978 20.861 49.496 5.041 27 .000
Paraphrase This Document
Need a fresh take? Get an instant paraphrase of this document with our AI Paraphraser
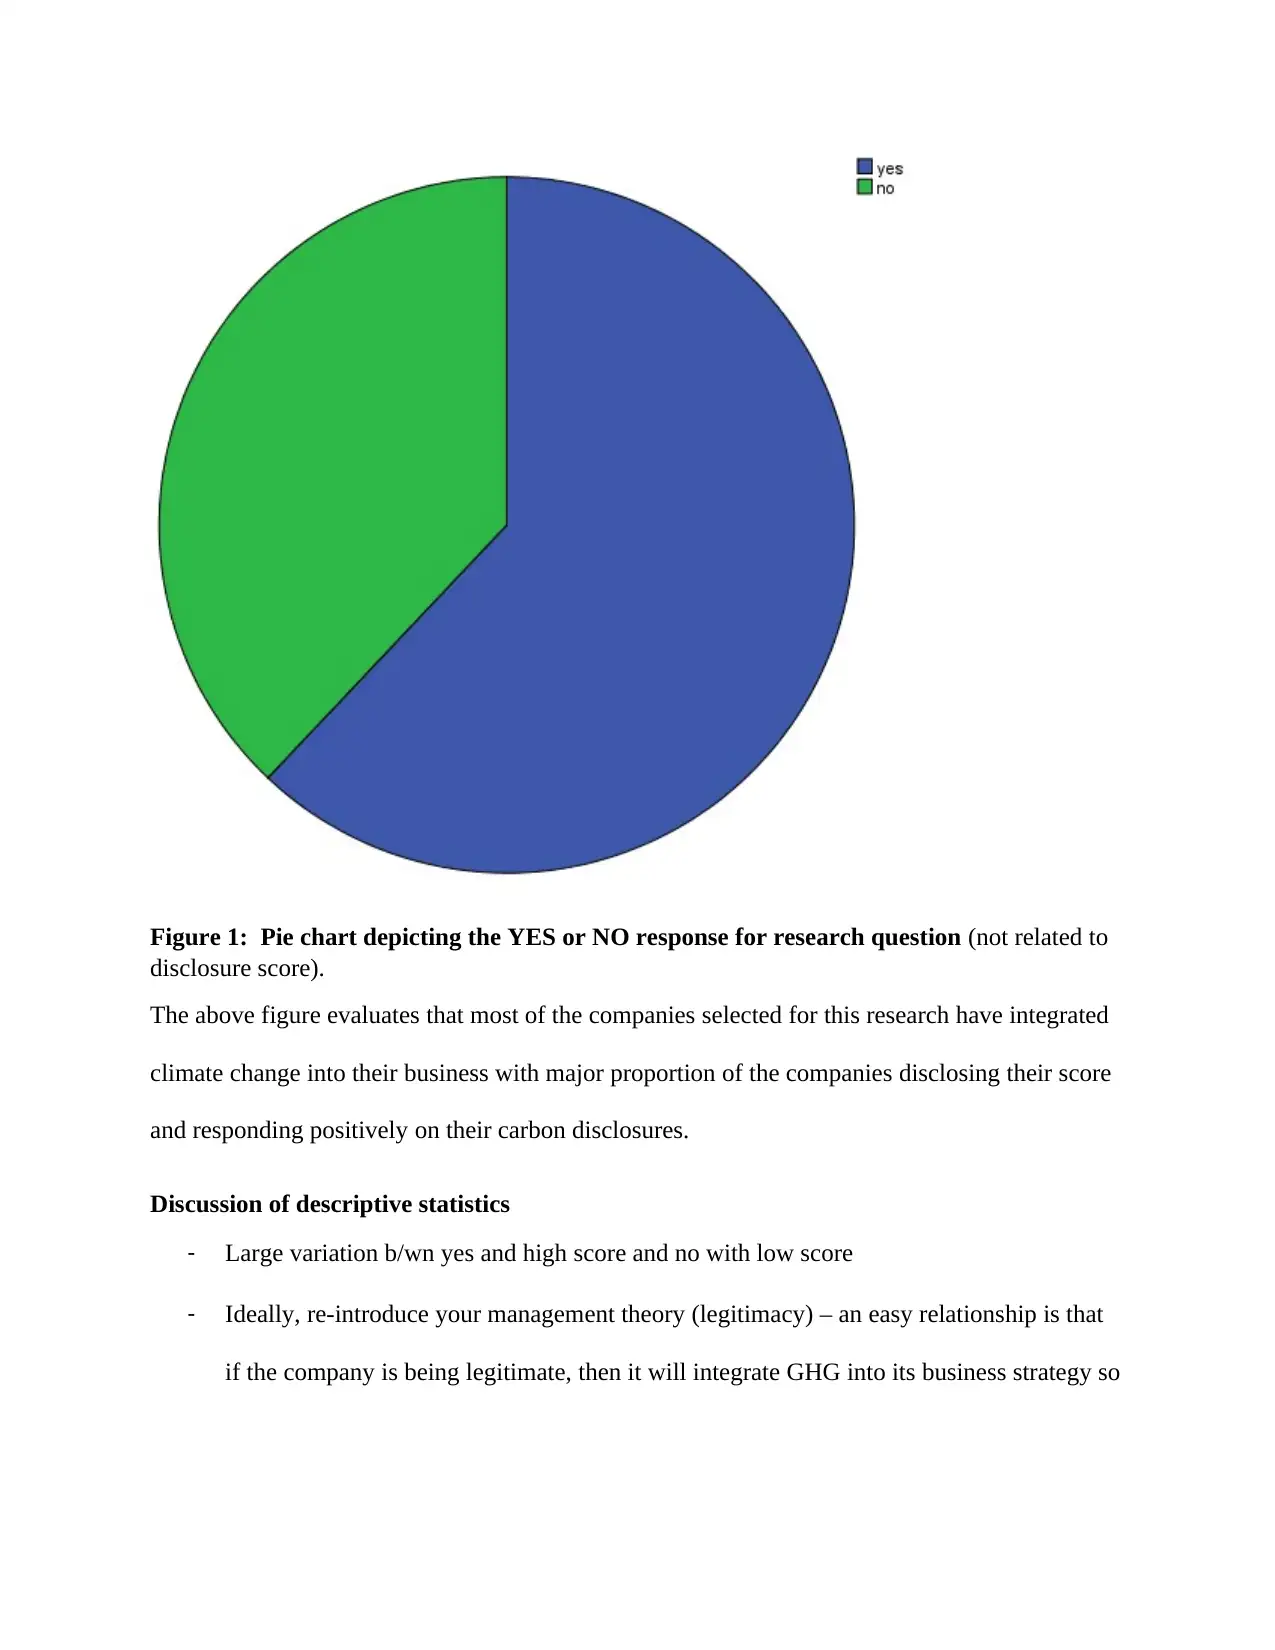
Figure 1: Pie chart depicting the YES or NO response for research question (not related to
disclosure score).
The above figure evaluates that most of the companies selected for this research have integrated
climate change into their business with major proportion of the companies disclosing their score
and responding positively on their carbon disclosures.
Discussion of descriptive statistics
- Large variation b/wn yes and high score and no with low score
- Ideally, re-introduce your management theory (legitimacy) – an easy relationship is that
if the company is being legitimate, then it will integrate GHG into its business strategy so
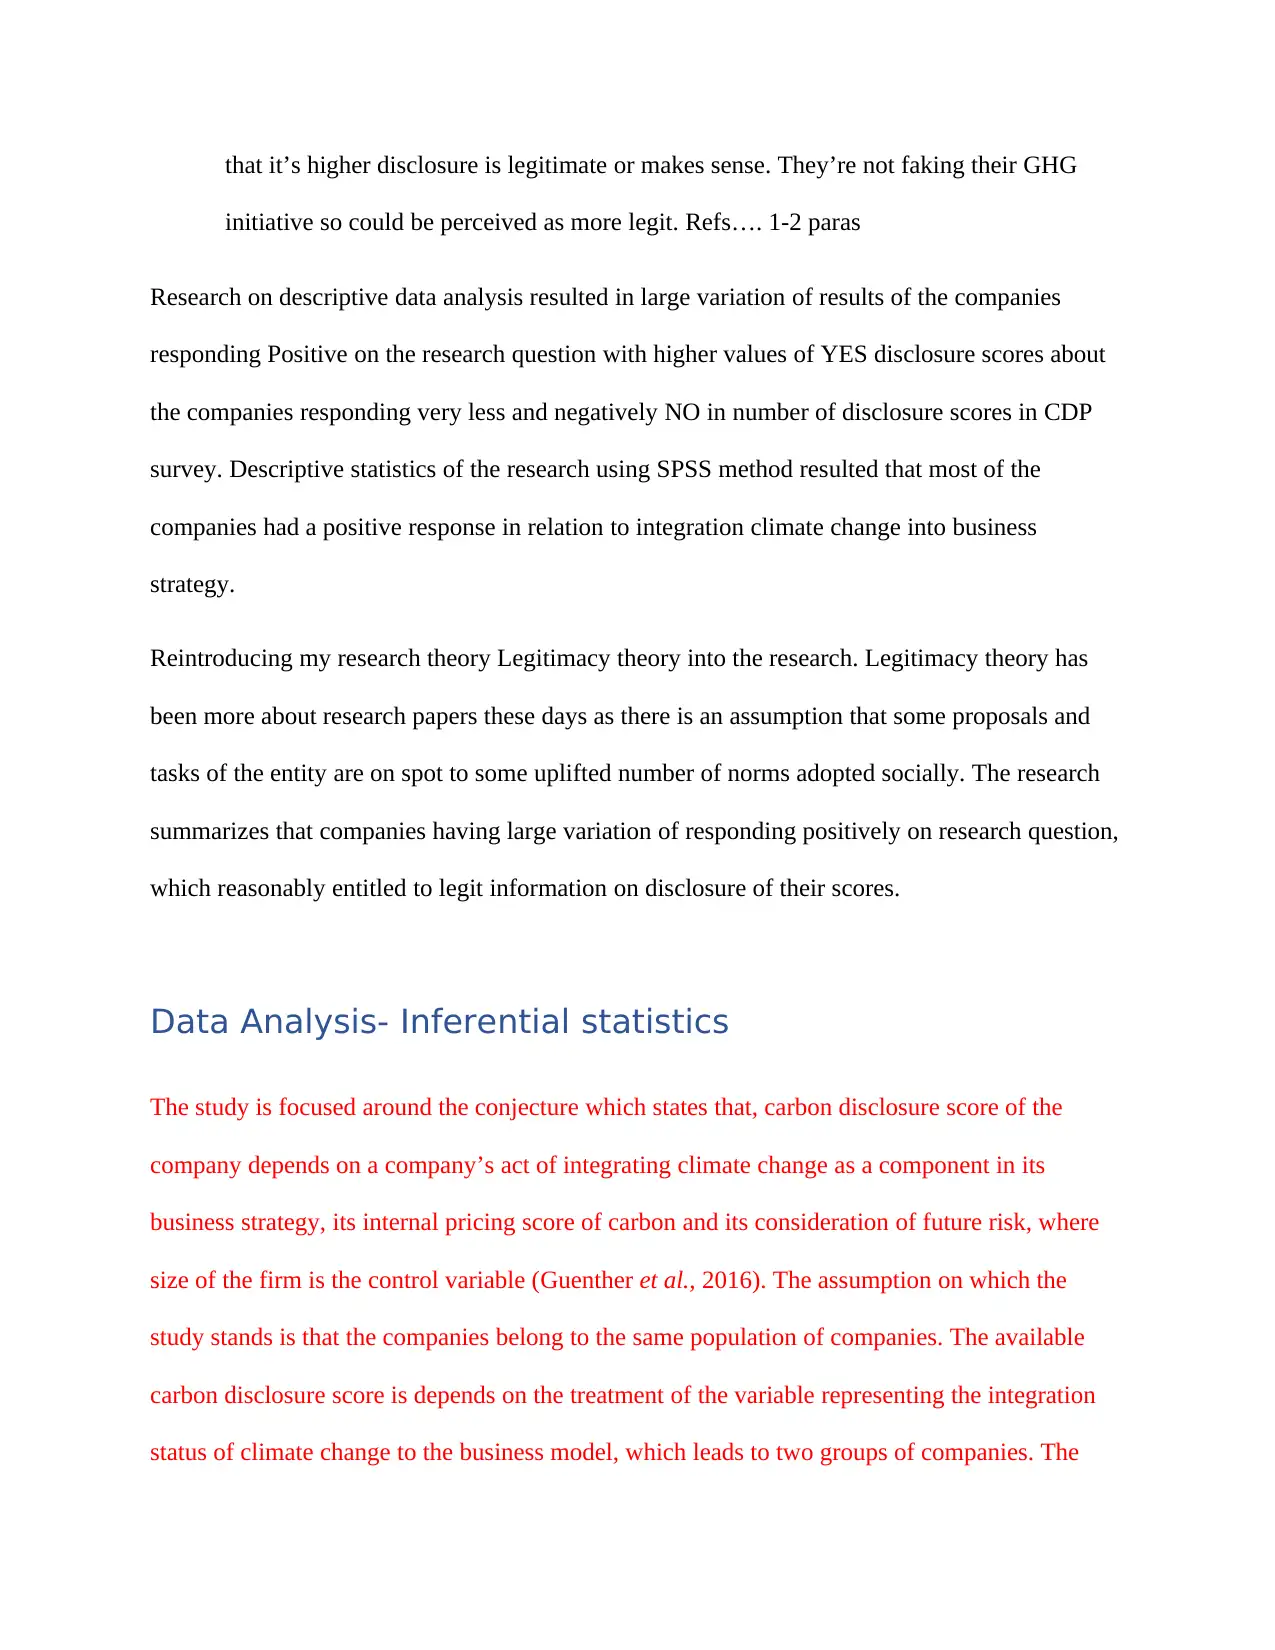
that it’s higher disclosure is legitimate or makes sense. They’re not faking their GHG
initiative so could be perceived as more legit. Refs…. 1-2 paras
Research on descriptive data analysis resulted in large variation of results of the companies
responding Positive on the research question with higher values of YES disclosure scores about
the companies responding very less and negatively NO in number of disclosure scores in CDP
survey. Descriptive statistics of the research using SPSS method resulted that most of the
companies had a positive response in relation to integration climate change into business
strategy.
Reintroducing my research theory Legitimacy theory into the research. Legitimacy theory has
been more about research papers these days as there is an assumption that some proposals and
tasks of the entity are on spot to some uplifted number of norms adopted socially. The research
summarizes that companies having large variation of responding positively on research question,
which reasonably entitled to legit information on disclosure of their scores.
Data Analysis- Inferential statistics
The study is focused around the conjecture which states that, carbon disclosure score of the
company depends on a company’s act of integrating climate change as a component in its
business strategy, its internal pricing score of carbon and its consideration of future risk, where
size of the firm is the control variable (Guenther et al., 2016). The assumption on which the
study stands is that the companies belong to the same population of companies. The available
carbon disclosure score is depends on the treatment of the variable representing the integration
status of climate change to the business model, which leads to two groups of companies. The
⊘ This is a preview!⊘
Do you want full access?
Subscribe today to unlock all pages.
Trusted by 1+ million students worldwide
1 out of 17

Your All-in-One AI-Powered Toolkit for Academic Success.
+13062052269
info@desklib.com
Available 24*7 on WhatsApp / Email
![[object Object]](/_next/static/media/star-bottom.7253800d.svg)
Unlock your academic potential
Copyright © 2020–2026 A2Z Services. All Rights Reserved. Developed and managed by ZUCOL.