Comprehensive Analysis: Cesim Global Challenge Strategy Report
VerifiedAdded on 2019/12/28
|19
|4466
|1748
Report
AI Summary
This report analyzes the Cesim Global Challenge simulation, focusing on the mobile phone market and the strategic decisions made by various companies within the game. The report begins with an introduction to the simulation, its objectives, and the key concepts it aims to teach, such as strategic thinking, market analysis, and global business operations. It then delves into the mobile phone market, examining market share, sales revenue, and profitability of the participating companies, including Maxx Mobile, OUI Com, Real Tech, and others. The analysis covers competitive advantages, outsourcing manufacturing decisions, and the impact of factors like production costs in different regions. The report also assesses the stakeholder perspectives and provides recommendations for performance improvement. Key findings highlight the importance of understanding market dynamics, managing costs, and making informed strategic decisions to achieve competitive advantage and maximize profits in a global business environment. The report uses illustrations and tables to present data and support its analysis, offering a comprehensive overview of the challenges and opportunities in the mobile phone industry within the context of the Cesim Global Challenge simulation.

STRATEGY
Paraphrase This Document
Need a fresh take? Get an instant paraphrase of this document with our AI Paraphraser
Table of Contents
PART 1 – Cesim Global Challenge.................................................................................................1
Introduction............................................................................................................................1
The Mobile Phone Market......................................................................................................1
The Mobile Phone Industry....................................................................................................4
Competitive Advantage..........................................................................................................5
Outsourcing Manufacturing....................................................................................................8
Performance Improvement Recommendations....................................................................10
PART 2 – Stakeholder Summary...................................................................................................11
Stakeholder Analysis............................................................................................................11
Critical Evaluation................................................................................................................13
CONCLUSION..............................................................................................................................15
REFERENCES..............................................................................................................................16
Illustration Index
Illustration 1: Market share in Asia.................................................................................................2
Illustration 2: Market Share in USA................................................................................................3
Illustration 3: Global sales revenue..................................................................................................4
Illustration 4: Profits earned on global platform..............................................................................5
Illustration 5: Global cost and expenses..........................................................................................7
Illustration 6: Profits earned in USA...............................................................................................8
Illustration 7: Profits earned in Asia................................................................................................9
Illustration 8: Stakeholder Analysis...............................................................................................13
Illustration 9: IKEA group's revenue.............................................................................................15
Index of Tables
Table 1: Own production cost..........................................................................................................9
Table 2: Installing number of plants in next round..........................................................................9
⊘ This is a preview!⊘
Do you want full access?
Subscribe today to unlock all pages.
Trusted by 1+ million students worldwide
PART 1 – Cesim Global Challenge
Introduction
Cesim global challenge is a simulation game which has been formed to improve business
skills of the students. It helps to develop critical thinking and assists the individual to understand
global business operations of a chosen firm of preferred field. The individual get to take business
decisions, understand the competitive environment and apply the strategies. Success of the
company is assessed based on operational and financial indicators (Ameer and Othman, 2012).
Student can go through a range of concepts of management, such as, economic, political,
financial, human resources, procurement, production, research and innovation. It also helps the
student to take appropriate measures to earn maximum profits. Overall it is a digital game played
by various graduates, under graduates and business students for in house corporate training.
The Mobile Phone Market
The chosen companies in order to play simulation game are, Geeks tech, OUI Com, Real
tech, AJ Tech, Maxx Mobile, Ochre. The mentioned companies are the mobile phone companies
on which simulation have been applied. It has helped to draw their data based on their
functioning in all the 10 rounds played. The companies have competed with each other leading to
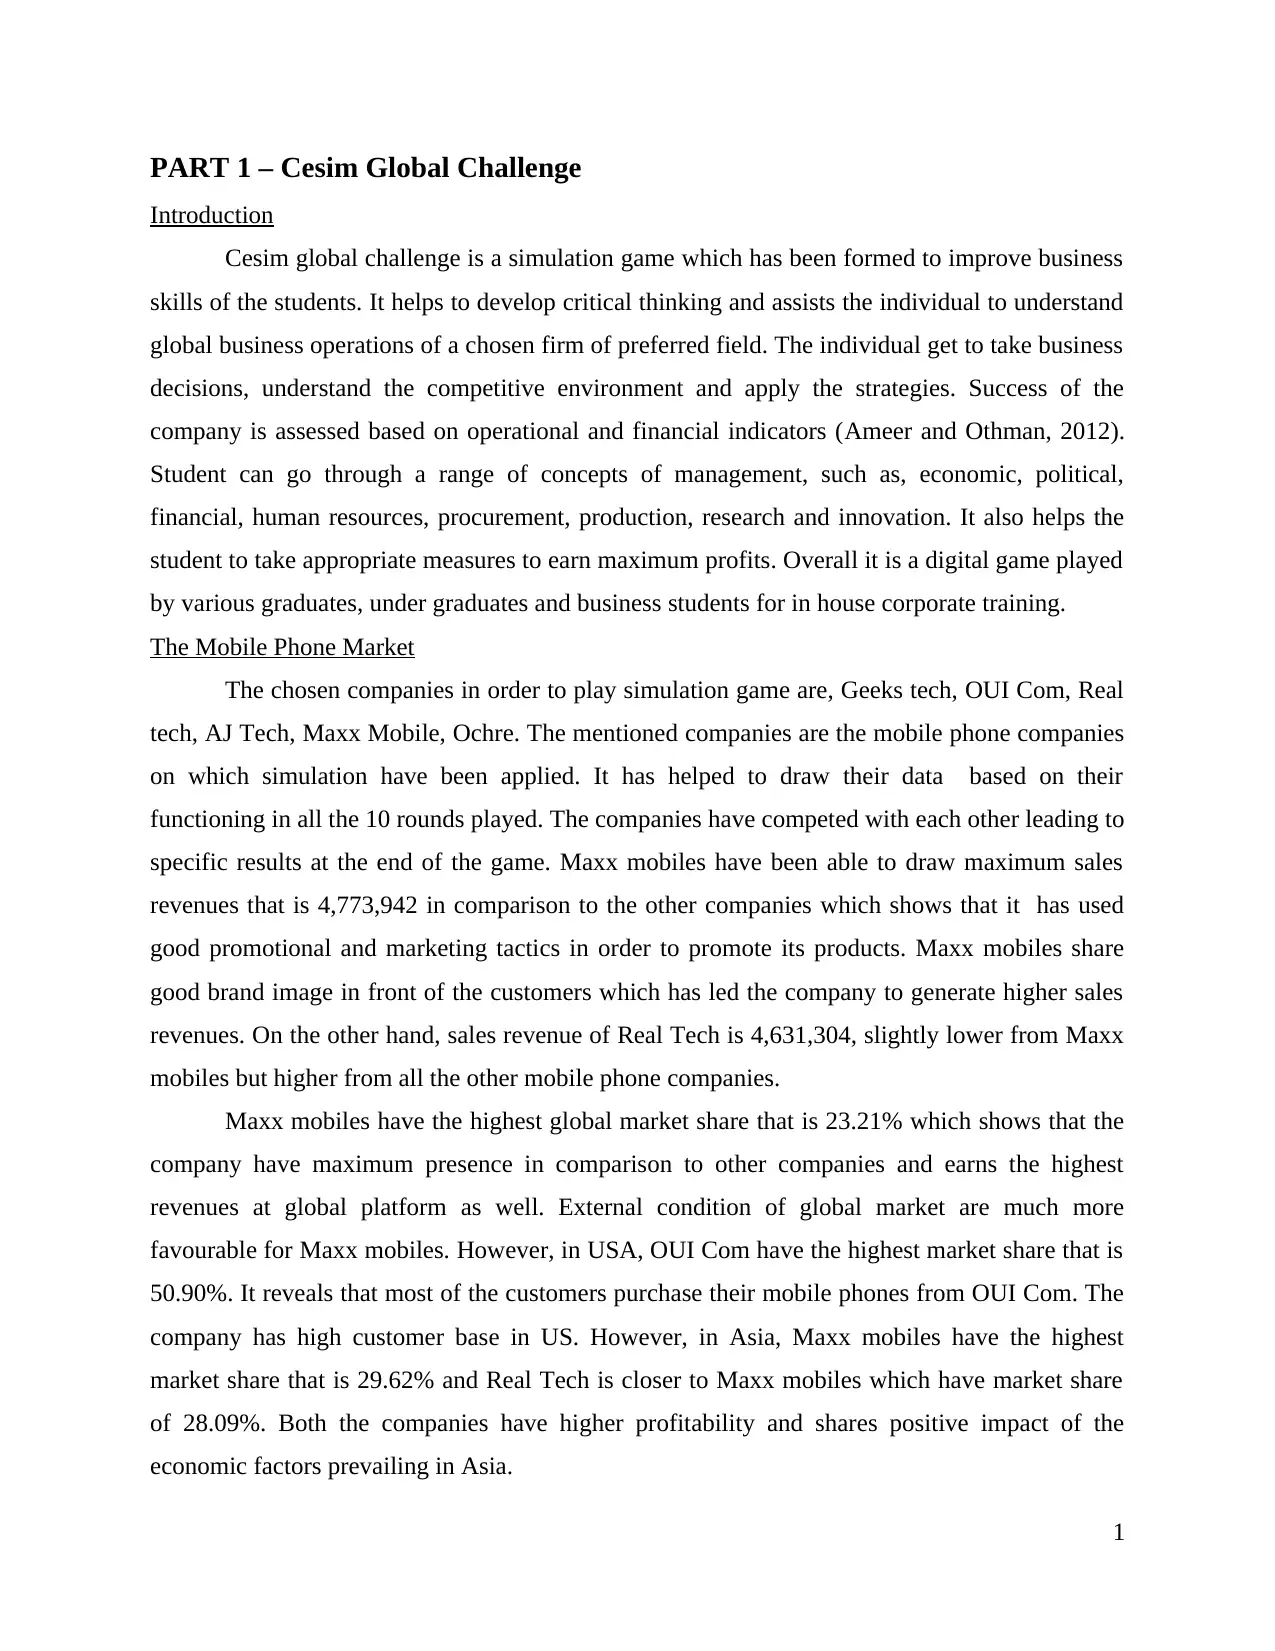
specific results at the end of the game. Maxx mobiles have been able to draw maximum sales
revenues that is 4,773,942 in comparison to the other companies which shows that it has used
good promotional and marketing tactics in order to promote its products. Maxx mobiles share
good brand image in front of the customers which has led the company to generate higher sales
revenues. On the other hand, sales revenue of Real Tech is 4,631,304, slightly lower from Maxx
mobiles but higher from all the other mobile phone companies.
Maxx mobiles have the highest global market share that is 23.21% which shows that the
company have maximum presence in comparison to other companies and earns the highest
revenues at global platform as well. External condition of global market are much more
favourable for Maxx mobiles. However, in USA, OUI Com have the highest market share that is
50.90%. It reveals that most of the customers purchase their mobile phones from OUI Com. The
company has high customer base in US. However, in Asia, Maxx mobiles have the highest
market share that is 29.62% and Real Tech is closer to Maxx mobiles which have market share
of 28.09%. Both the companies have higher profitability and shares positive impact of the
economic factors prevailing in Asia.
1
Introduction
Cesim global challenge is a simulation game which has been formed to improve business
skills of the students. It helps to develop critical thinking and assists the individual to understand
global business operations of a chosen firm of preferred field. The individual get to take business
decisions, understand the competitive environment and apply the strategies. Success of the
company is assessed based on operational and financial indicators (Ameer and Othman, 2012).
Student can go through a range of concepts of management, such as, economic, political,
financial, human resources, procurement, production, research and innovation. It also helps the
student to take appropriate measures to earn maximum profits. Overall it is a digital game played
by various graduates, under graduates and business students for in house corporate training.
The Mobile Phone Market
The chosen companies in order to play simulation game are, Geeks tech, OUI Com, Real
tech, AJ Tech, Maxx Mobile, Ochre. The mentioned companies are the mobile phone companies
on which simulation have been applied. It has helped to draw their data based on their
functioning in all the 10 rounds played. The companies have competed with each other leading to
specific results at the end of the game. Maxx mobiles have been able to draw maximum sales
revenues that is 4,773,942 in comparison to the other companies which shows that it has used
good promotional and marketing tactics in order to promote its products. Maxx mobiles share
good brand image in front of the customers which has led the company to generate higher sales
revenues. On the other hand, sales revenue of Real Tech is 4,631,304, slightly lower from Maxx
mobiles but higher from all the other mobile phone companies.
Maxx mobiles have the highest global market share that is 23.21% which shows that the
company have maximum presence in comparison to other companies and earns the highest
revenues at global platform as well. External condition of global market are much more
favourable for Maxx mobiles. However, in USA, OUI Com have the highest market share that is
50.90%. It reveals that most of the customers purchase their mobile phones from OUI Com. The
company has high customer base in US. However, in Asia, Maxx mobiles have the highest
market share that is 29.62% and Real Tech is closer to Maxx mobiles which have market share
of 28.09%. Both the companies have higher profitability and shares positive impact of the
economic factors prevailing in Asia.
1
Paraphrase This Document
Need a fresh take? Get an instant paraphrase of this document with our AI Paraphraser
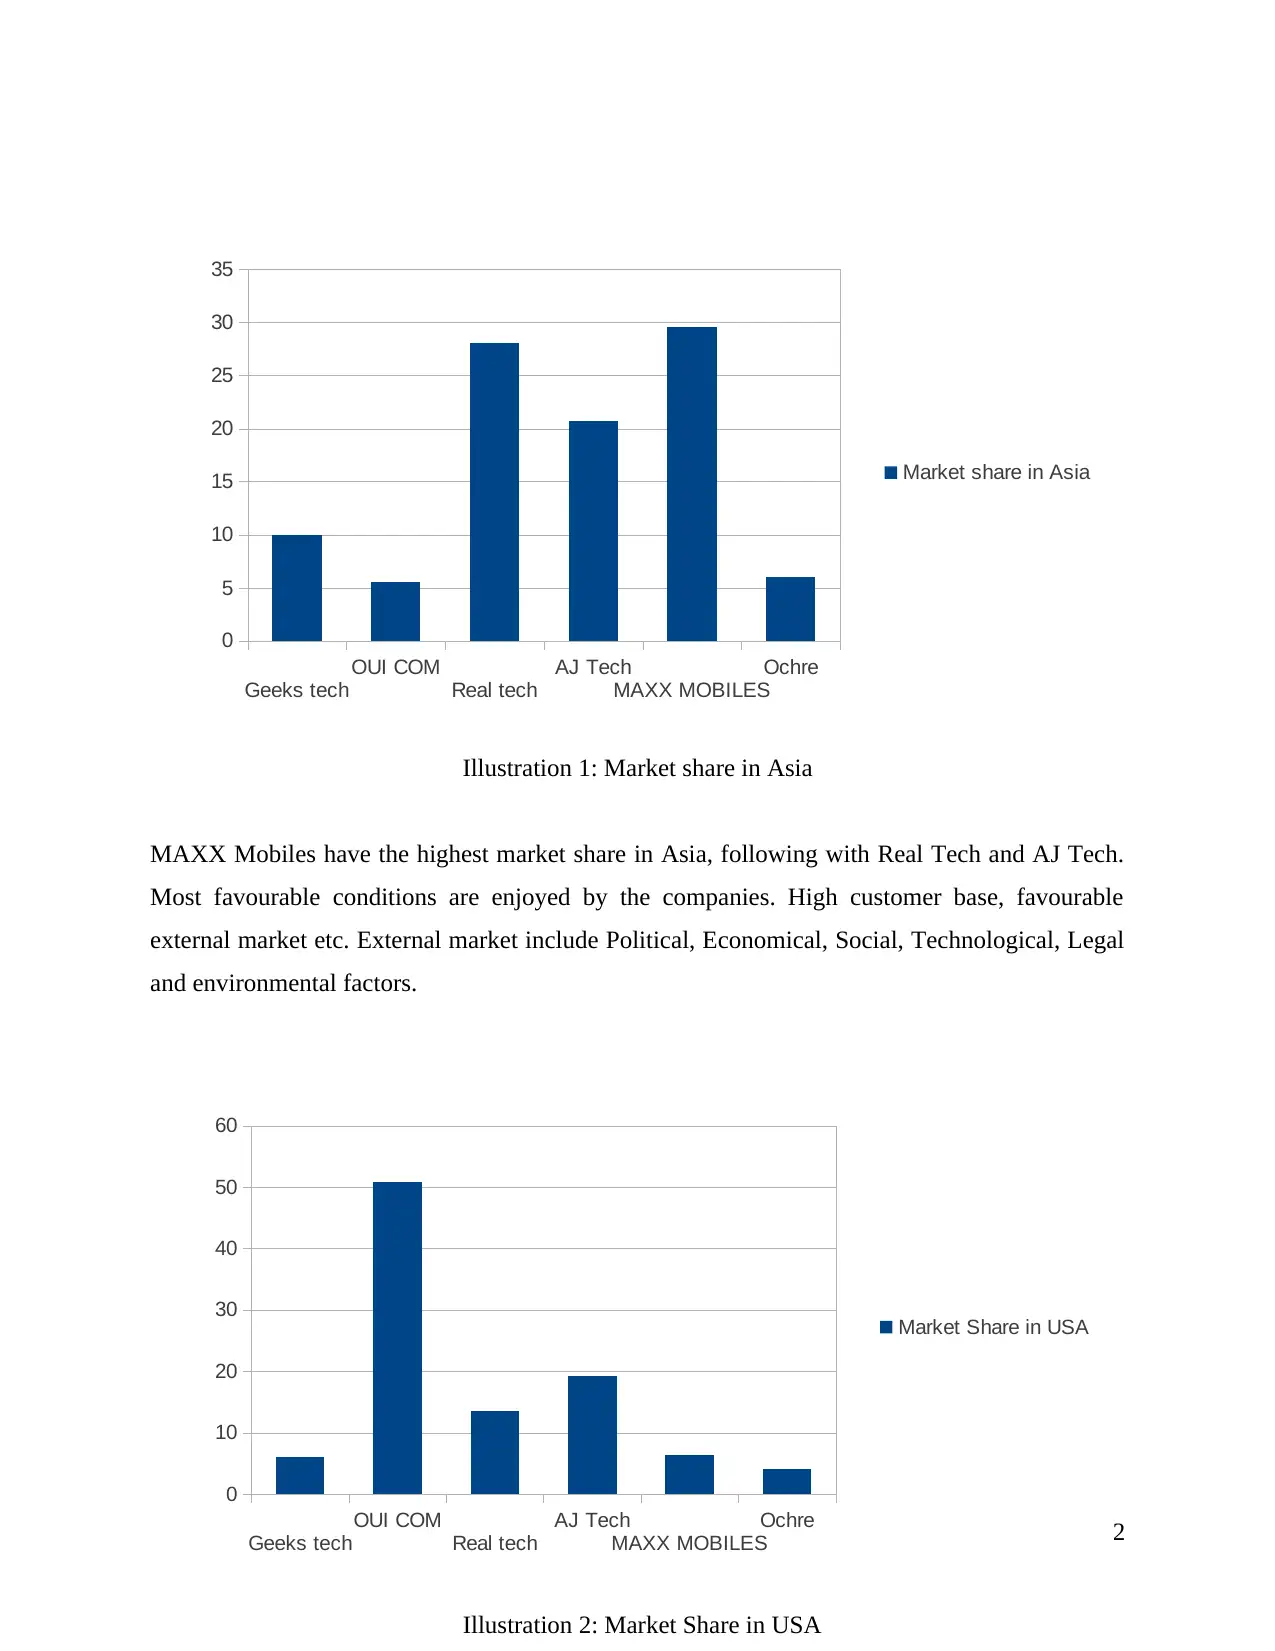
MAXX Mobiles have the highest market share in Asia, following with Real Tech and AJ Tech.
Most favourable conditions are enjoyed by the companies. High customer base, favourable
external market etc. External market include Political, Economical, Social, Technological, Legal
and environmental factors.
2
Geeks tech
OUI COM
Real tech
AJ Tech
MAXX MOBILES
Ochre
0
5
10
15
20
25
30
35
Market share in Asia
Illustration 1: Market share in Asia
Geeks tech
OUI COM
Real tech
AJ Tech
MAXX MOBILES
Ochre
0
10
20
30
40
50
60
Market Share in USA
Illustration 2: Market Share in USA
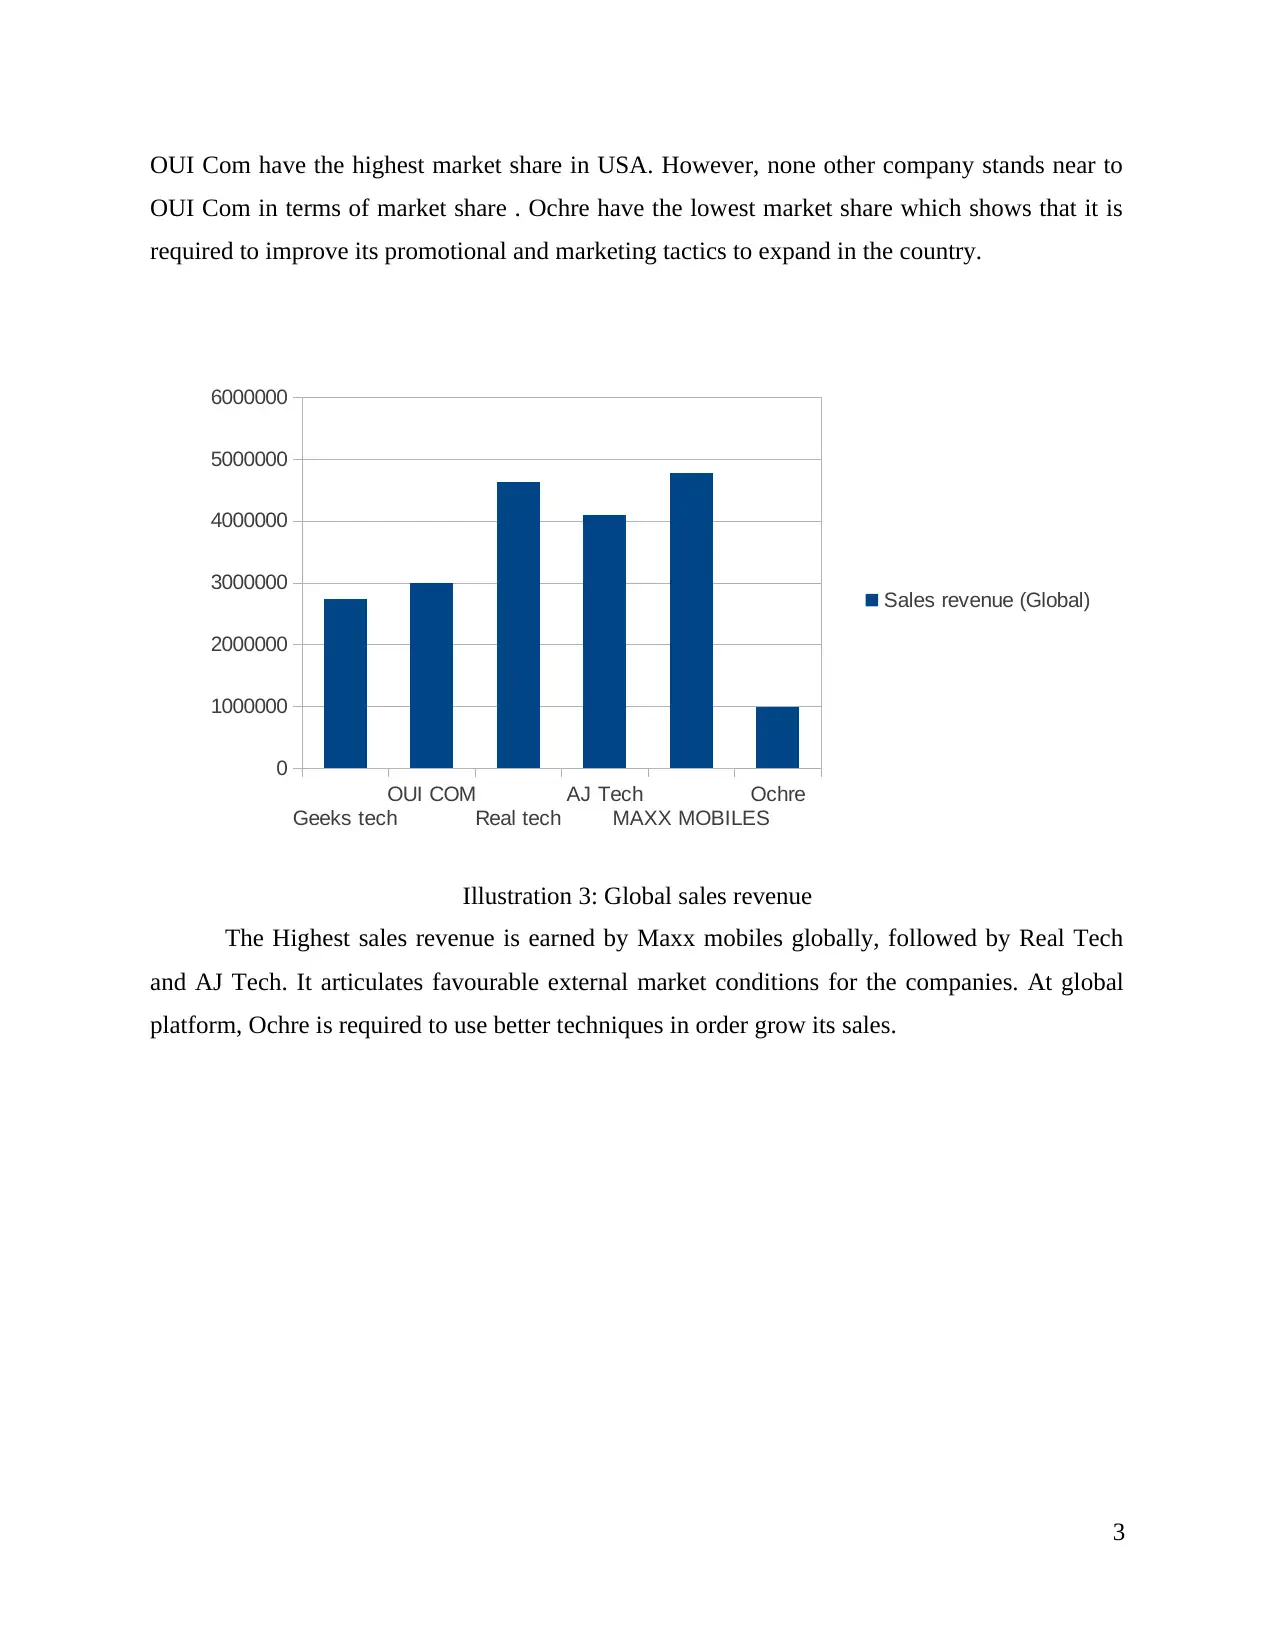
OUI Com have the highest market share in USA. However, none other company stands near to
OUI Com in terms of market share . Ochre have the lowest market share which shows that it is
required to improve its promotional and marketing tactics to expand in the country.
The Highest sales revenue is earned by Maxx mobiles globally, followed by Real Tech
and AJ Tech. It articulates favourable external market conditions for the companies. At global
platform, Ochre is required to use better techniques in order grow its sales.
3
Geeks tech
OUI COM
Real tech
AJ Tech
MAXX MOBILES
Ochre
0
1000000
2000000
3000000
4000000
5000000
6000000
Sales revenue (Global)
Illustration 3: Global sales revenue
⊘ This is a preview!⊘
Do you want full access?
Subscribe today to unlock all pages.
Trusted by 1+ million students worldwide
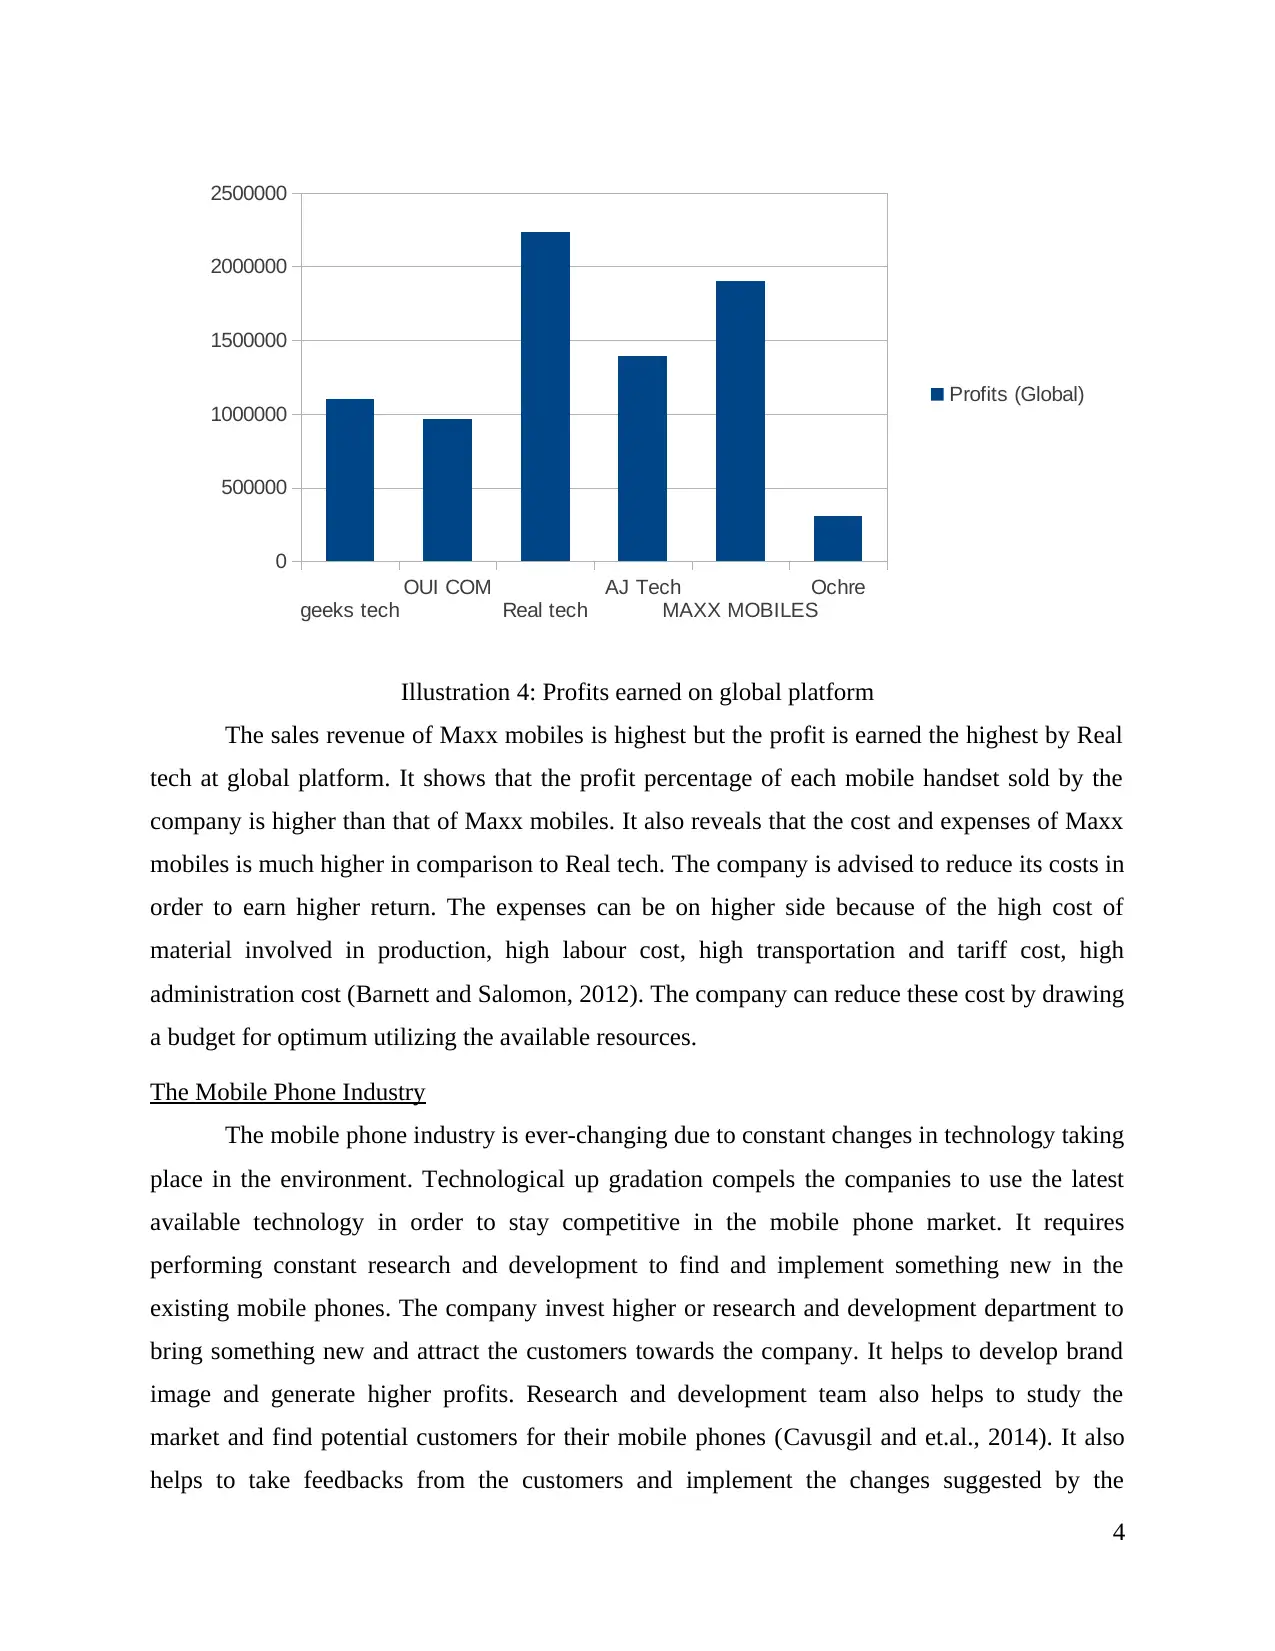
The sales revenue of Maxx mobiles is highest but the profit is earned the highest by Real
tech at global platform. It shows that the profit percentage of each mobile handset sold by the
company is higher than that of Maxx mobiles. It also reveals that the cost and expenses of Maxx
mobiles is much higher in comparison to Real tech. The company is advised to reduce its costs in
order to earn higher return. The expenses can be on higher side because of the high cost of
material involved in production, high labour cost, high transportation and tariff cost, high
administration cost (Barnett and Salomon, 2012). The company can reduce these cost by drawing
a budget for optimum utilizing the available resources.
The Mobile Phone Industry
The mobile phone industry is ever-changing due to constant changes in technology taking
place in the environment. Technological up gradation compels the companies to use the latest
available technology in order to stay competitive in the mobile phone market. It requires
performing constant research and development to find and implement something new in the
existing mobile phones. The company invest higher or research and development department to
bring something new and attract the customers towards the company. It helps to develop brand
image and generate higher profits. Research and development team also helps to study the
market and find potential customers for their mobile phones (Cavusgil and et.al., 2014). It also
helps to take feedbacks from the customers and implement the changes suggested by the
4
geeks tech
OUI COM
Real tech
AJ Tech
MAXX MOBILES
Ochre
0
500000
1000000
1500000
2000000
2500000
Profits (Global)
Illustration 4: Profits earned on global platform
Paraphrase This Document
Need a fresh take? Get an instant paraphrase of this document with our AI Paraphraser
customers. The game involves six different companies of mobile phones. Some companies are
performing better in US market, some in Europe and Asian market. Various factors can affect the
sustainability in different geographical regions such as, high manufacturing cost involved when
the product is manufactured in USA. On the other hand, the cost and expenses of production is
on lower side in Asia due to cheap availability of labour in the countries. It is also important to
understand the market and take necessary steps for selling. Real tech is able to generate high
profits in Asian market, whereas, Max mobiles have been able to perform well in Europe market.
It also depends on the working conditions of the companies in every country. Maxx mobile may
be able to fulfil the needs of Europe market due to its product function and Real tech may be
providing mobile which are user friendly to the people of Asia.
Competitive Advantage
A mobile phone have to go through various steps before reaching to the end customers.
The cost includes researching about the new available technology, getting the material arranged
to produce the phone, promote the new manufactured product, transport it to end consumer etc.
The profit of a company is calculated by adding an appropriate profit percentage to all the cost
and expenses incurred by the company to deliver the phone to the end consumer. In case of a
company earning higher sales revenues doesn't mean that it is also earning higher profit. The
reason is that the cost incurred by the company can be on higher side than the profit percentage.
According to the given case, the cost and expenses incurred by the companies are different.
5
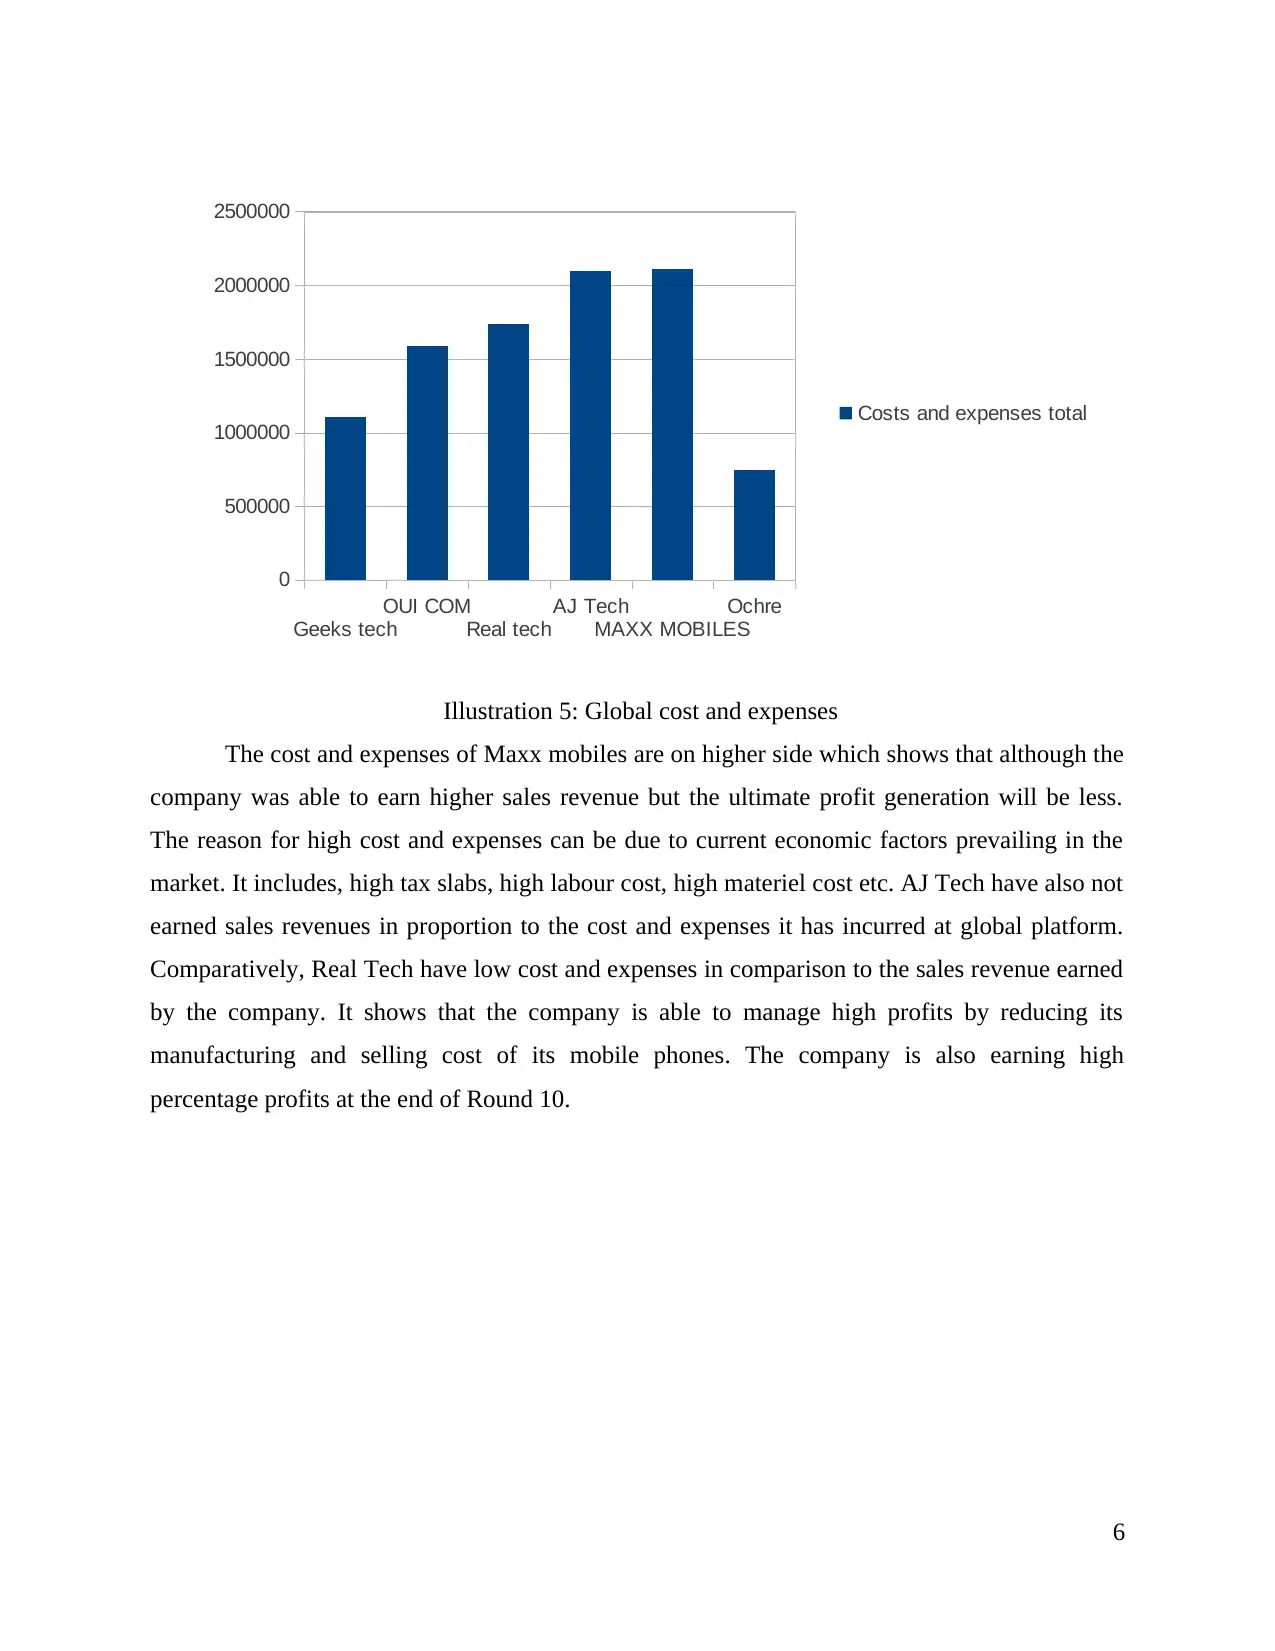
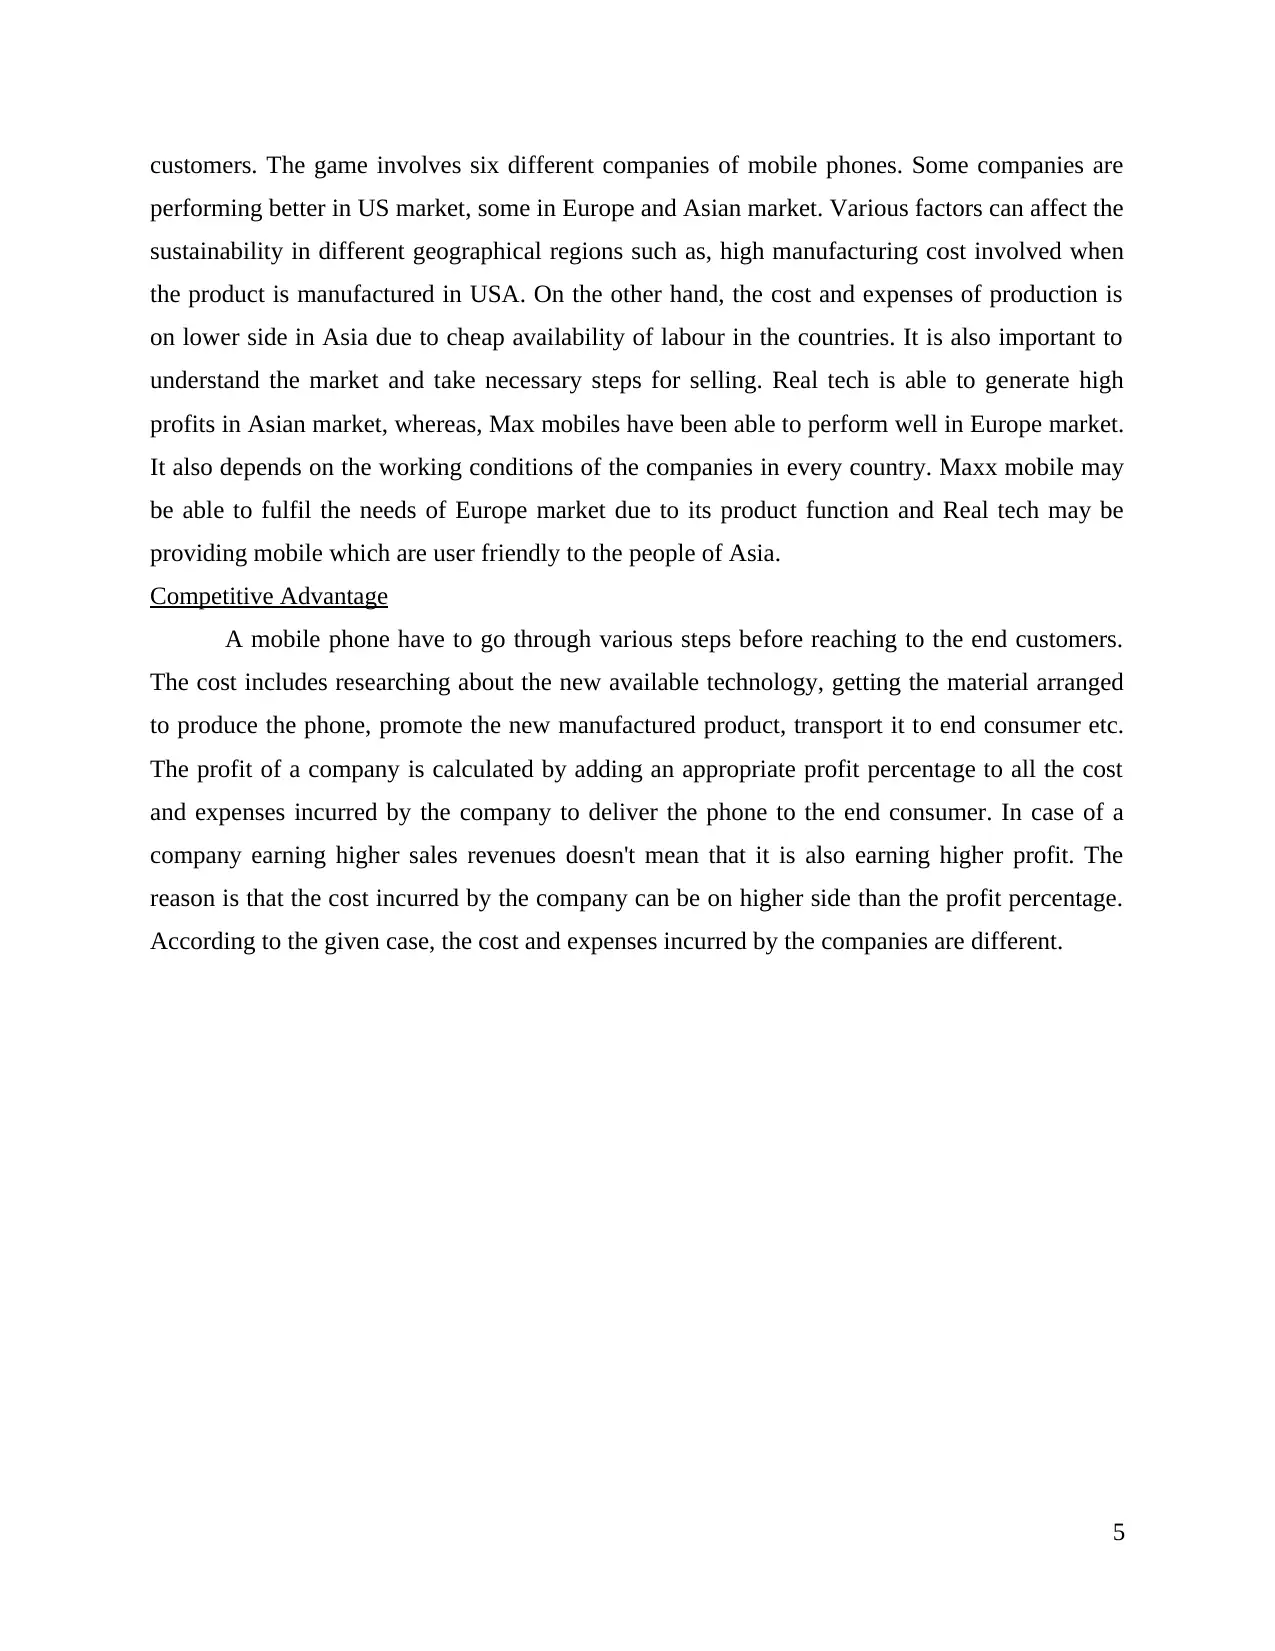
The cost and expenses of Maxx mobiles are on higher side which shows that although the
company was able to earn higher sales revenue but the ultimate profit generation will be less.
The reason for high cost and expenses can be due to current economic factors prevailing in the
market. It includes, high tax slabs, high labour cost, high materiel cost etc. AJ Tech have also not
earned sales revenues in proportion to the cost and expenses it has incurred at global platform.
Comparatively, Real Tech have low cost and expenses in comparison to the sales revenue earned
by the company. It shows that the company is able to manage high profits by reducing its
manufacturing and selling cost of its mobile phones. The company is also earning high
percentage profits at the end of Round 10.
6
Geeks tech
OUI COM
Real tech
AJ Tech
MAXX MOBILES
Ochre
0
500000
1000000
1500000
2000000
2500000
Costs and expenses total
Illustration 5: Global cost and expenses
⊘ This is a preview!⊘
Do you want full access?
Subscribe today to unlock all pages.
Trusted by 1+ million students worldwide
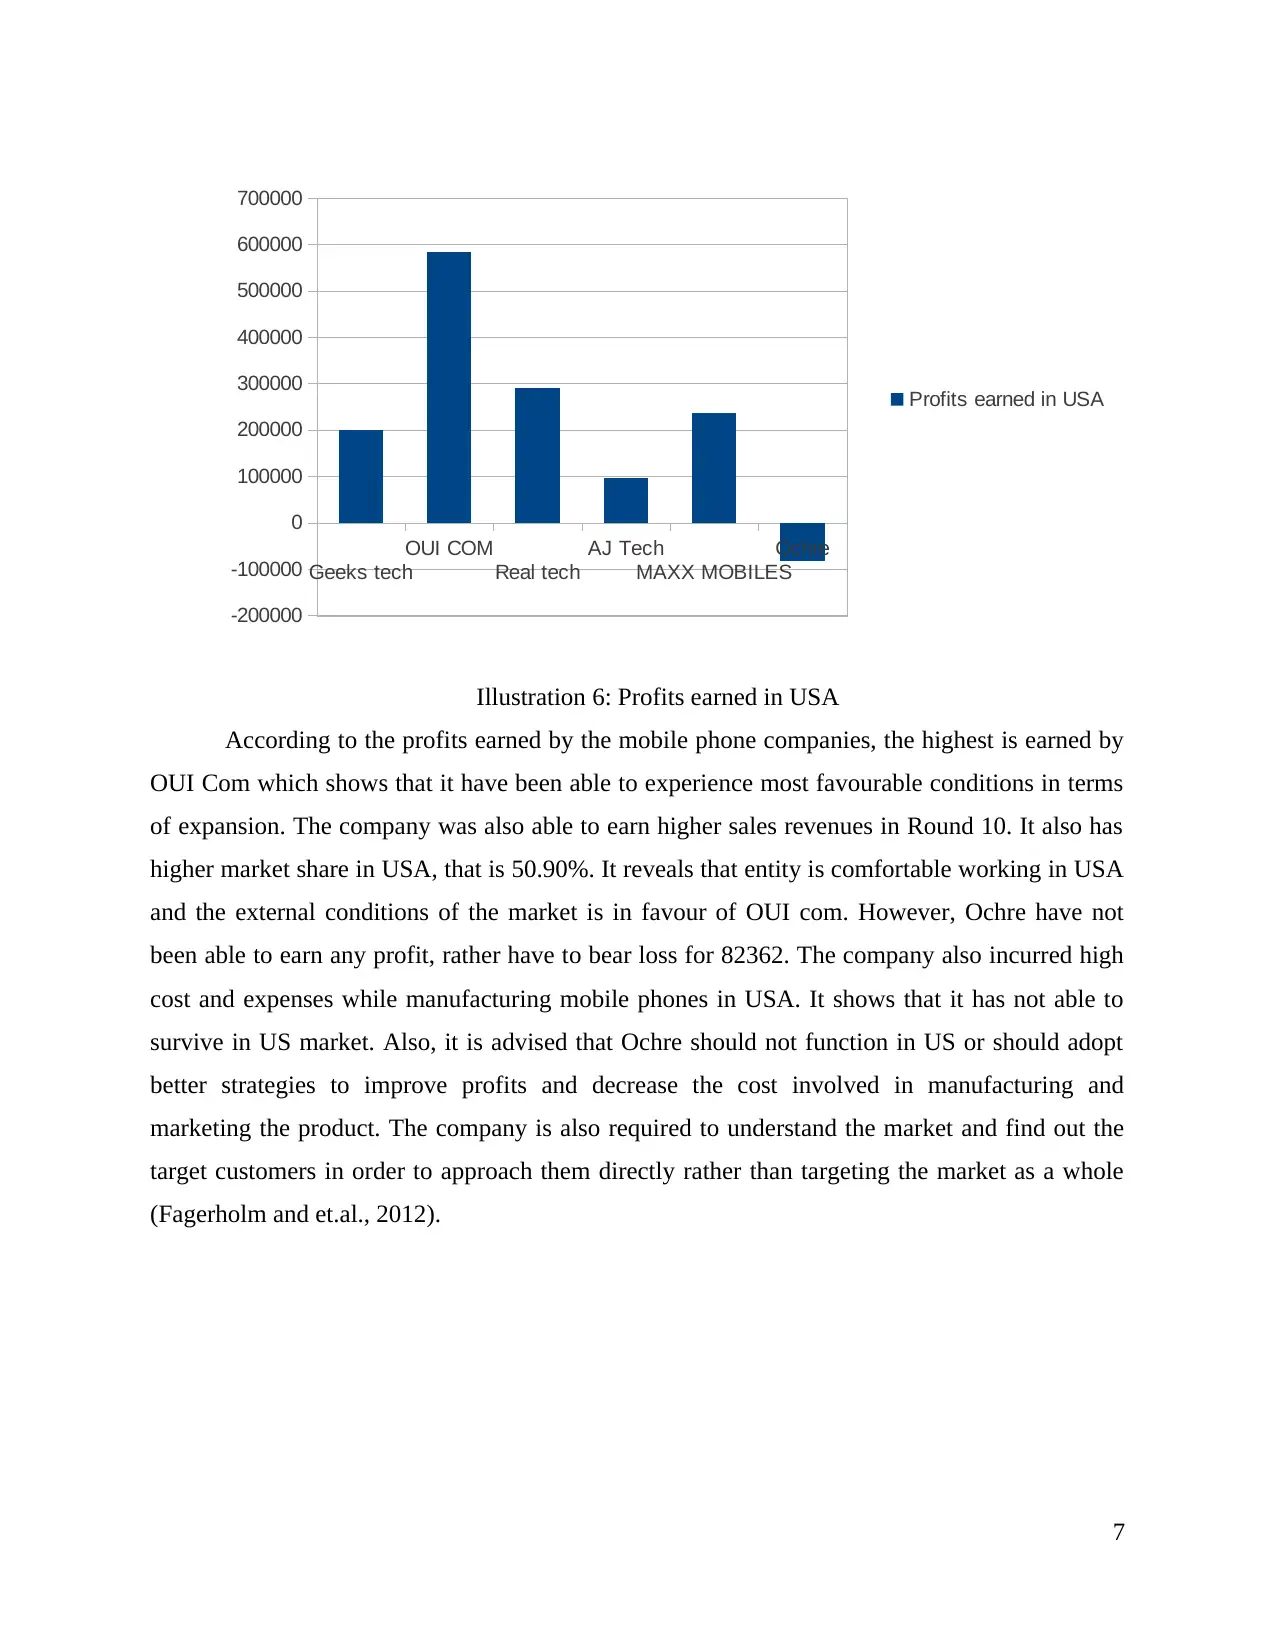
According to the profits earned by the mobile phone companies, the highest is earned by
OUI Com which shows that it have been able to experience most favourable conditions in terms
of expansion. The company was also able to earn higher sales revenues in Round 10. It also has
higher market share in USA, that is 50.90%. It reveals that entity is comfortable working in USA
and the external conditions of the market is in favour of OUI com. However, Ochre have not
been able to earn any profit, rather have to bear loss for 82362. The company also incurred high
cost and expenses while manufacturing mobile phones in USA. It shows that it has not able to
survive in US market. Also, it is advised that Ochre should not function in US or should adopt
better strategies to improve profits and decrease the cost involved in manufacturing and
marketing the product. The company is also required to understand the market and find out the
target customers in order to approach them directly rather than targeting the market as a whole
(Fagerholm and et.al., 2012).
7
Geeks tech
OUI COM
Real tech
AJ Tech
MAXX MOBILES
Ochre
-200000
-100000
0
100000
200000
300000
400000
500000
600000
700000
Profits earned in USA
Illustration 6: Profits earned in USA
Paraphrase This Document
Need a fresh take? Get an instant paraphrase of this document with our AI Paraphraser
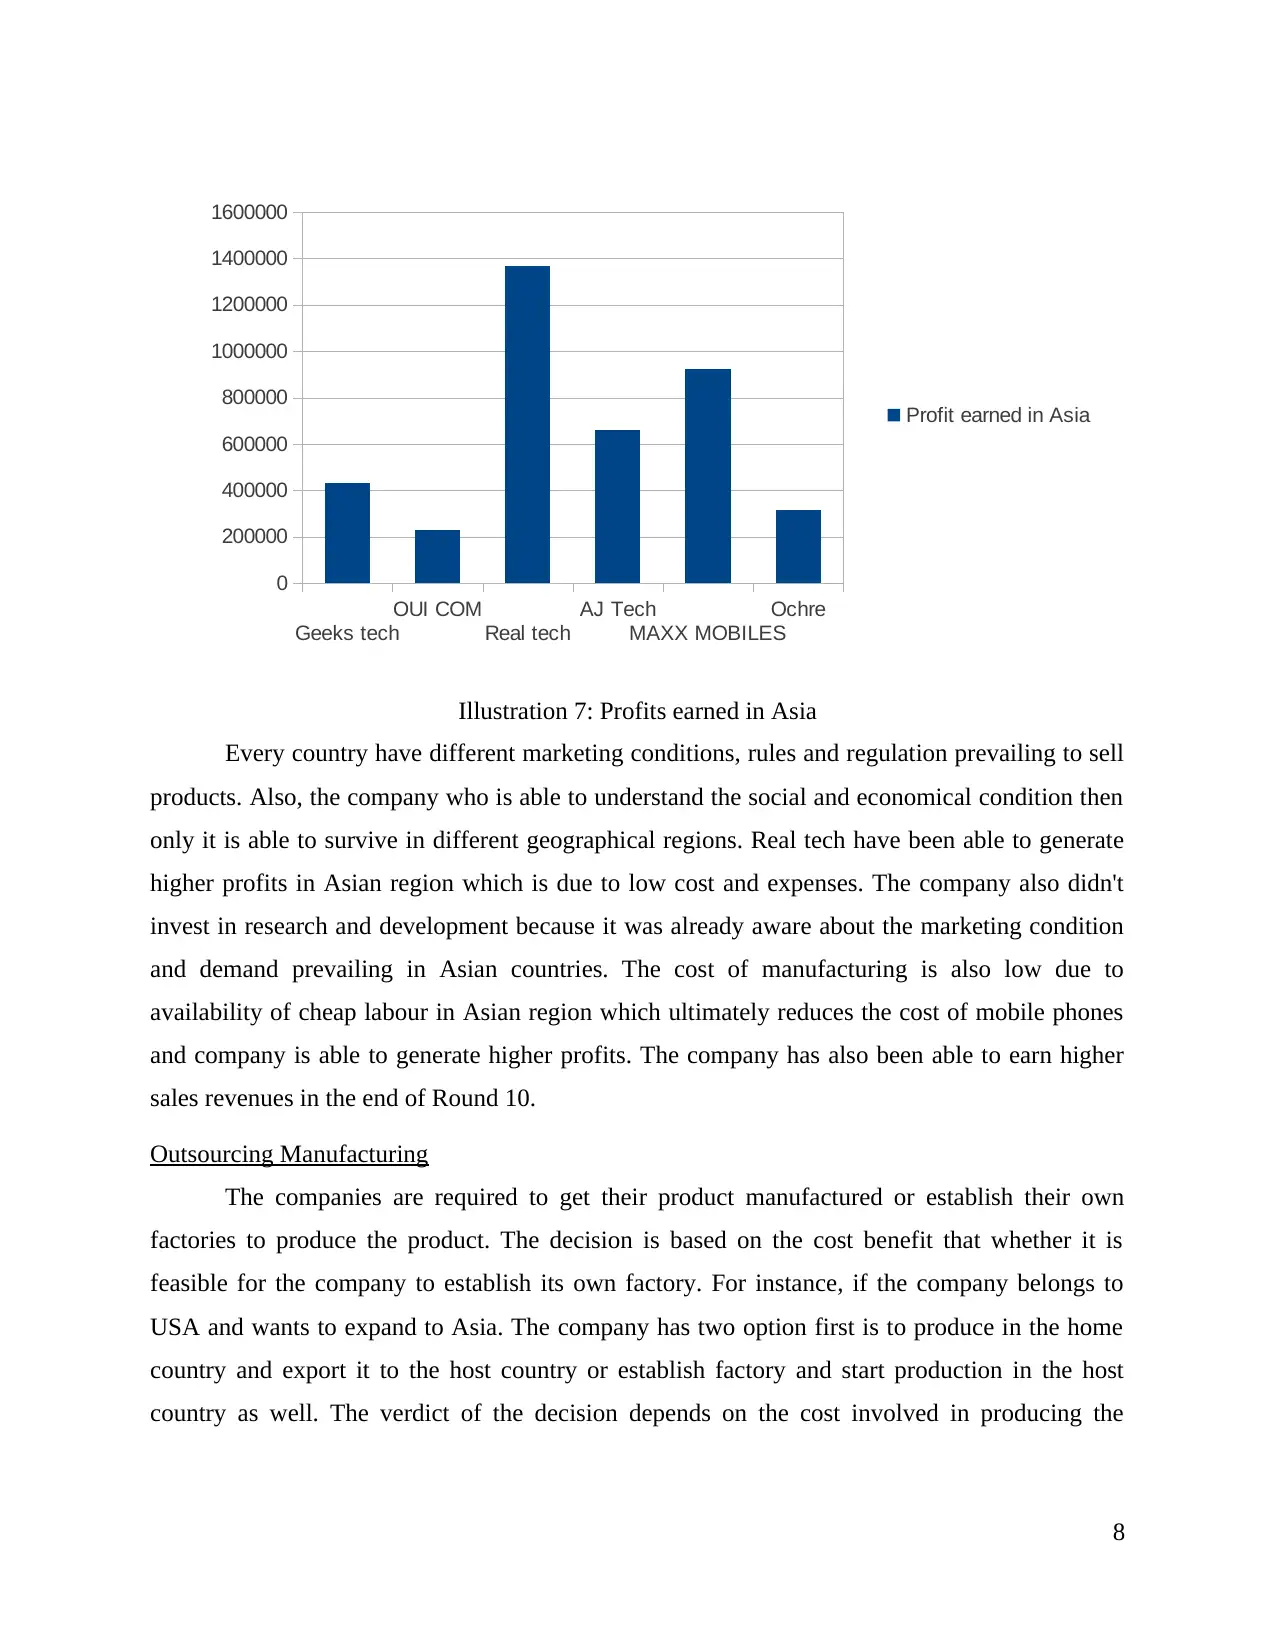
Every country have different marketing conditions, rules and regulation prevailing to sell
products. Also, the company who is able to understand the social and economical condition then
only it is able to survive in different geographical regions. Real tech have been able to generate
higher profits in Asian region which is due to low cost and expenses. The company also didn't
invest in research and development because it was already aware about the marketing condition
and demand prevailing in Asian countries. The cost of manufacturing is also low due to
availability of cheap labour in Asian region which ultimately reduces the cost of mobile phones
and company is able to generate higher profits. The company has also been able to earn higher
sales revenues in the end of Round 10.
Outsourcing Manufacturing
The companies are required to get their product manufactured or establish their own
factories to produce the product. The decision is based on the cost benefit that whether it is
feasible for the company to establish its own factory. For instance, if the company belongs to
USA and wants to expand to Asia. The company has two option first is to produce in the home
country and export it to the host country or establish factory and start production in the host
country as well. The verdict of the decision depends on the cost involved in producing the
8
Geeks tech
OUI COM
Real tech
AJ Tech
MAXX MOBILES
Ochre
0
200000
400000
600000
800000
1000000
1200000
1400000
1600000
Profit earned in Asia
Illustration 7: Profits earned in Asia
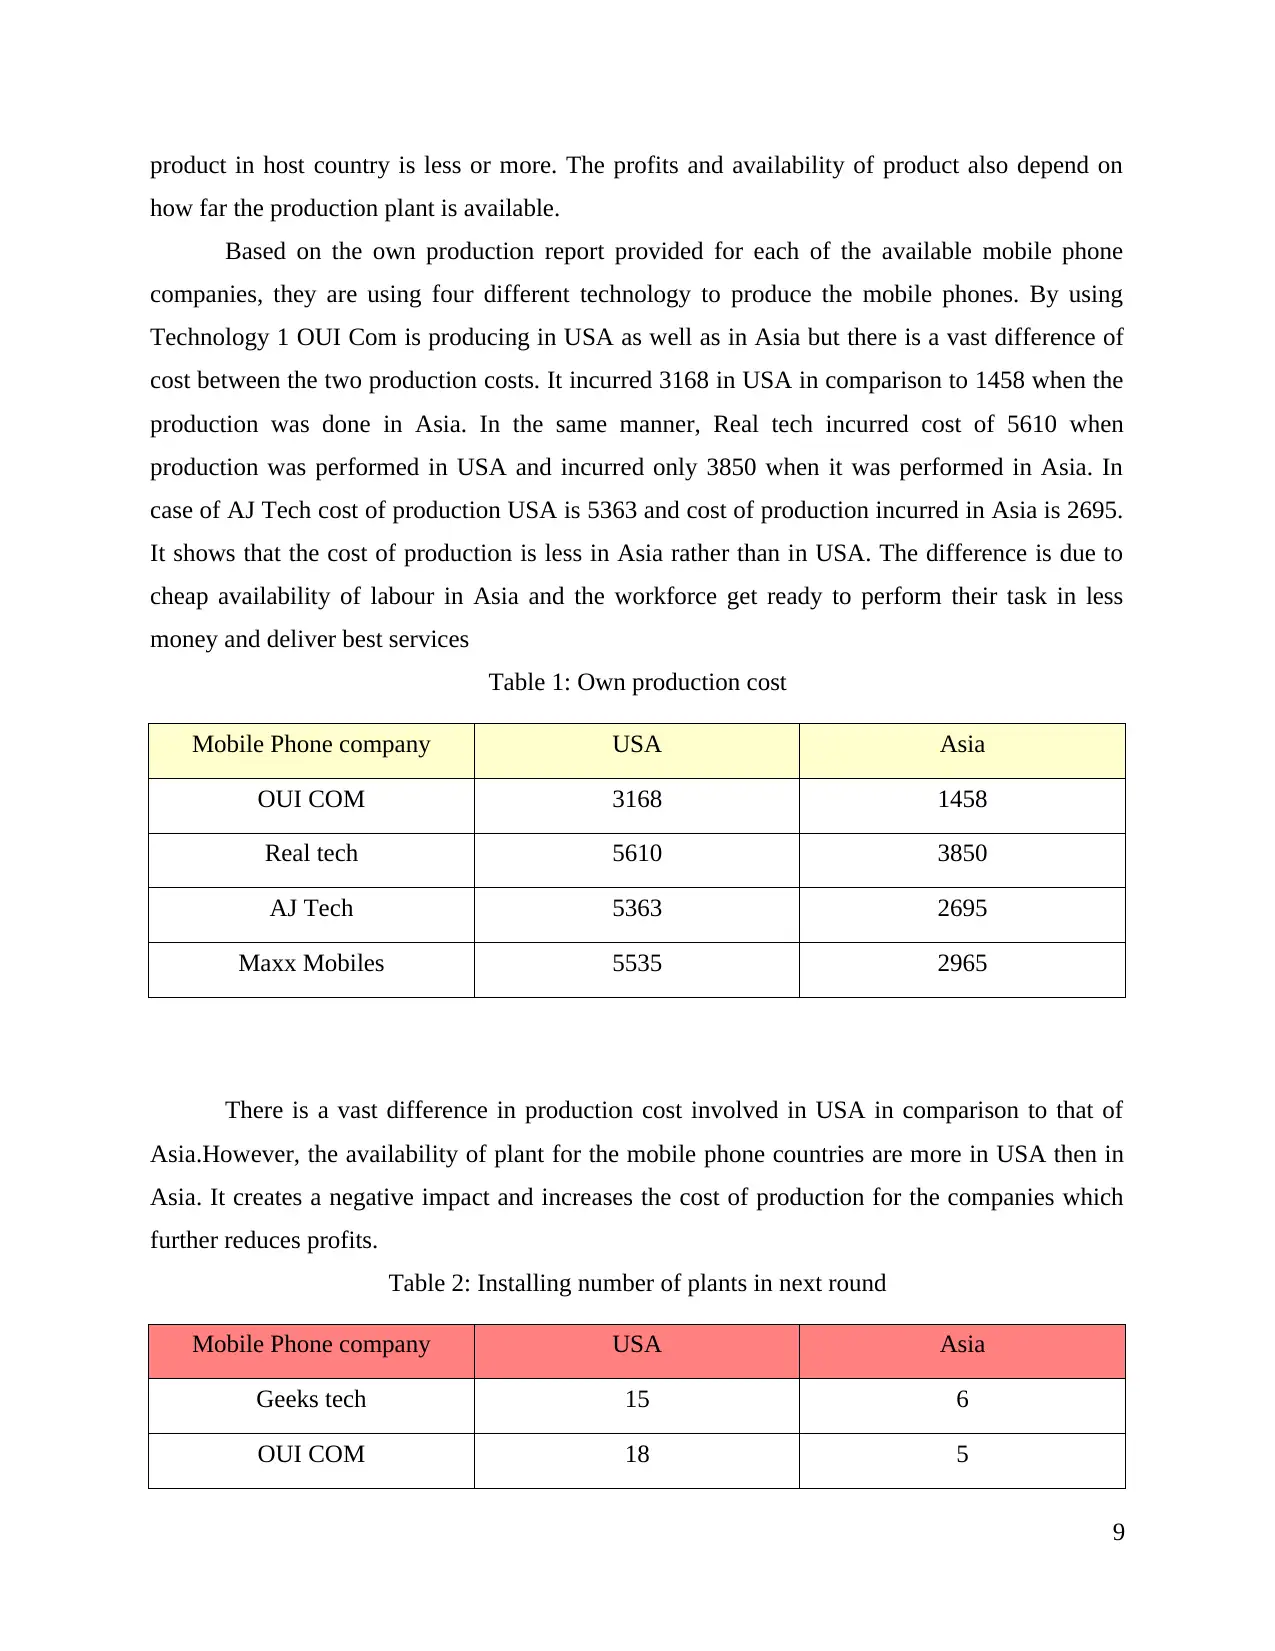
product in host country is less or more. The profits and availability of product also depend on
how far the production plant is available.
Based on the own production report provided for each of the available mobile phone
companies, they are using four different technology to produce the mobile phones. By using
Technology 1 OUI Com is producing in USA as well as in Asia but there is a vast difference of
cost between the two production costs. It incurred 3168 in USA in comparison to 1458 when the
production was done in Asia. In the same manner, Real tech incurred cost of 5610 when
production was performed in USA and incurred only 3850 when it was performed in Asia. In
case of AJ Tech cost of production USA is 5363 and cost of production incurred in Asia is 2695.
It shows that the cost of production is less in Asia rather than in USA. The difference is due to
cheap availability of labour in Asia and the workforce get ready to perform their task in less
money and deliver best services
Table 1: Own production cost
Mobile Phone company USA Asia
OUI COM 3168 1458
Real tech 5610 3850
AJ Tech 5363 2695
Maxx Mobiles 5535 2965
There is a vast difference in production cost involved in USA in comparison to that of
Asia.However, the availability of plant for the mobile phone countries are more in USA then in
Asia. It creates a negative impact and increases the cost of production for the companies which
further reduces profits.
Table 2: Installing number of plants in next round
Mobile Phone company USA Asia
Geeks tech 15 6
OUI COM 18 5
9
⊘ This is a preview!⊘
Do you want full access?
Subscribe today to unlock all pages.
Trusted by 1+ million students worldwide
1 out of 19
Related Documents


Your All-in-One AI-Powered Toolkit for Academic Success.
+13062052269
info@desklib.com
Available 24*7 on WhatsApp / Email
![[object Object]](/_next/static/media/star-bottom.7253800d.svg)
Unlock your academic potential
Copyright © 2020–2026 A2Z Services. All Rights Reserved. Developed and managed by ZUCOL.