Business Strategy Reflective Report: Analysis of Dynamic Company
VerifiedAdded on 2023/01/12
|16
|4126
|41
Report
AI Summary
This report provides a comprehensive analysis of Dynamic's business strategy within the athletics footwear market. It begins with an executive summary and table of contents, followed by an examination of Dynamic's mission, vision, and values. The report then delves into the company's corporate objectives and evaluates its year-by-year performance, highlighting key decisions and their impacts on market share, profitability, and product lines. A detailed analysis of the business environment, including macro, meso, and micro aspects, is presented using PESTEL and Porter's Five Forces models. Furthermore, the report includes a SWOT analysis, functional strategies (marketing, operations, supply chain, CSR, and finance), and an overall performance review against investor expectations. Finally, the report concludes with recommendations for future strategy, offering insights into how Dynamic can improve its performance and navigate the competitive landscape.
Business Strategy: reflective report
SID: Type SID here
Word count:
(Excluding text in abstracts; data; tables; figures;
diagrams; in-text citations; footnotes/endnotes
used for reference purposes and kept within
reasonable limits; references; appendices. Per
ARU Academic Regulations 12, 2019, §6.83).
Type word count here
Academic honesty: [By submitting this project, I declare that] I understand
that the piece of work submitted will be considered as the
final and complete version of my project of which I am
otherwise the sole author. I understand both the meaning
and consequences of plagiarism and that my work has
been appropriately attributed unless otherwise stated. I
have not knowingly allowed another to copy my work.
1 of 16
Paraphrase This Document
Need a fresh take? Get an instant paraphrase of this document with our AI Paraphraser
Executive summary
This report sumamrisis the industry overview of athletics foot ware market in which
DYNAMIC operates. In this report, vision, mission and performance objectives of this
company are analysed along with its year by year performance evlaution. Furthetmore, in
this report, internal and rcternal envrionemnt of this company is analyused along with
operations and functions.
2 of 16
Table of contents
Executive summary............................................................................................................................. 2
Table of contents................................................................................................................................. 3
List of figures....................................................................................................................................... 5
List of tables........................................................................................................................................ 6
(1) Mission, vision and values............................................................................................................ 7
1.1 Mission........................................................................................................................................ 7
1.2. Vision.......................................................................................................................................... 7
1.3. Values......................................................................................................................................... 7
(2) Corporate objectives...................................................................................................................... 8
(3) Year-by-year evaluation................................................................................................................. 9
3.1. Year 11....................................................................................................................................... 9
3.2. Year 12....................................................................................................................................... 9
3.3. Year 13..................................................................................................................................... 10
3.4. Year 14..................................................................................................................................... 10
3.5. Year 15..................................................................................................................................... 10
3.6. Year 16..................................................................................................................................... 10
(4) Business environment analysis..................................................................................................11
4.1. Macro environment................................................................................................................... 11
4.2. Meso environment.................................................................................................................... 11
4.3. Micro environment.................................................................................................................... 12
(5) SWOT / Telescopic Observations...............................................................................................13
(6) Functional strategies................................................................................................................... 14
6.1 Marketing................................................................................................................................... 14
6.2 Operations................................................................................................................................. 14
3 of 16
⊘ This is a preview!⊘
Do you want full access?
Subscribe today to unlock all pages.
Trusted by 1+ million students worldwide
6.3 Supply chain and logistics......................................................................................................... 14
6.4 Corporate social responsibility...................................................................................................15
6.5 Finance...................................................................................................................................... 15
(7) Overall performance review against investor expectations.....................................................16
(8) Recommendations for future strategy.......................................................................................17
References......................................................................................................................................... 18
4 of 16
Paraphrase This Document
Need a fresh take? Get an instant paraphrase of this document with our AI Paraphraser

List of figures
No table of figures entries found.
5 of 16
No table of figures entries found.
5 of 16
List of tables
No table of figures entries found.
6 of 16
No table of figures entries found.
6 of 16
⊘ This is a preview!⊘
Do you want full access?
Subscribe today to unlock all pages.
Trusted by 1+ million students worldwide
(1) Mission, vision and values
1.1 Mission
The mission statement of dynamic states “to fulfil desires, demands and expectations
of our consumers while creating a satisfied personnel so that reults can be sustainable.”
1.2. Vision
Viison statement of this company states “to be a benchmark in athletics foot ware
market and be a brand which admired by its consumers”
1.3. Values
Values of this company are mutual respect, integrity, entrepreneurship and
innovation.
(2) Corporate objectives
To apply global low cost leadership strategy and pursue a competitive advantage to
acquire a market share of 50% in United kingdom by Year 15.
To employ global best cost strategy to enhance profitability by 25% by year 13.
To employ focus strategy to gain market segment of female demographic by year 11.
(3) Year-by-year evaluation
3.1. Year 11
In year 11, a decision was made to do produce any E.A. product of Dynamic. This
decision was taken due to already stocked products which could be used in this year as well.
This decision was taken by analysing the branded operations statement according to which
no E.A. products were produced in 2010 but still such products were sold in this year and it
also resulted in gaining the market share of 8.3%. This decision had its own benefits., due to
this decision company was successful to earn operating profit of 21.68 in 2011 with solely
the sale of E.A. product from internet sales.
Another decision taken in this year was to reduce the productivity of N.A. product.
This decision was taken due to its high labour costs which was 9.90. This decision was
taken by analysing the branded production report of Dynamic from which it was observed
that N.A. product has the labour cost for per pair production is 9.90 and in order to balance
the production costs, this decision was take. This decision lead Dymaic towards low product
cost from rest of the years.
7 of 16
Paraphrase This Document
Need a fresh take? Get an instant paraphrase of this document with our AI Paraphraser
3.2. Year 12
In year 12, a decision was taken for N.A. product line according to which wholesale
sales were given priority rather than internet sales. This decision was taken to increase the
revenues in this year. This decision was taken by analysing the income statement of
Dynamic according to which higher sales are acquired from wholsale sales than internet
sales. This decision resultant into 470384 thousand dollars revenue from wholsale sales
which was higher than the internet sales that year as 159351 thousand dollars.
Another decision was taken in this year which was a carry forward decision from year
2011. Like 2011, no E.A. products were produced. This decision was taken considering the
stocked products of E.A. which can be sold in this year and the issue of over stocking can be
eliminated. This decision was made by considering the year by year financial performance
and decision sheet of dynamic. Even after n production, this decision resulted into
operatinmg profit of 11.92 gained soley from the sale of E.A. products.
3.3. Year 13
A major decision was took in this year which was to increase the production of L.A.
products. This decision was taken due to the lost labour cost for production of this product in
2013. This decision was taken after analysing the labour cost sheet from which an
information was procured that in year 2013 labours are available at 3.49 which is the
minimum cost for production of one pair product. This decision lead dynamic towards highest
productivity of this product in all the years. This was productivity level was 6319 pairs of
product in a single year, this production was more than year 10, 11 and 12 combined.
3.4. Year 14
In year 14, a decision was taken to change the production approach. In this decision
all the products including N.A., E-A, A-P and L.A. were procude highly using high labout cost
so that quality of the products can be enhanced. According to this decision, high labour costs
were incurred which were 7.25, 4.67, 5.27 and 3.99 for all four products respectively. The
reason behind utilising high labour costs was to enhance the quality of the produced
products. This decision was made by analysing the credit and image rating score card of this
company. Both the above mentioned scores of this company were low in previous years. In
order to resolve this situational issue,it was decided to enhance revenue and quality of the
products. This decision lead towards the favourable situation in which Dynamic gained the
8 of 16
credit rating of “A” along with wich image rating of this company also enhanced which was
from 83 in year 13 to 95 in year 14.
Another decision which was taken in year 14 was to spend highly for marketing
activities. This decision was taken to imprve the brand image of this company so that not
only from production activities, but this company could earn capital for their stakes as well.
This decision wsa taken by analysing the income statement og Dynamic according to which
earnings per share of this company were low and this was because of the low brand image
of the company in market. After this decision, high expenses on marketing activities were
faced by this company but it also resulted in hicked earnings per share of this company. EPS
in year 13 was 5.79 dollars but due to enhanced brand image of this company EPS
recooded as 8.79 dollars in year 14.
3.5. Year 15
In year 15, production decisions were taken in order to balance the product portfolio
of Dynamic. In the first decision, company decided to finally produce ample pairs of E-A
product as this product was not produced from last 4 years. This decision was taken by
analysing the product cost sheet of the company. This decision back fired to the company
and from the 6371 pairs produced of E-A product only 382 were sold in year 15.
In order to balance the product portfolio, it was decided to make efforts to incarese
the sales revenue of this company by lowering down the prices of the products sold. This
decision was taken from analysing the cash flow statement of this company. This decision
resultant in the facour of company as in year 15, dynamic recoded sales revenue of
1,507,476 thousand dollars.
3.6. Year 16
In this year, dynamic decided to earn high revenue by lowering down its products
price and acquire high debt from external parties. This decision was taken by analysing the
relevancy of past decisions. This decisions back fired to the company and due to heavy
debts, this company gained the credit rating of “C” in year 16.
9 of 16
⊘ This is a preview!⊘
Do you want full access?
Subscribe today to unlock all pages.
Trusted by 1+ million students worldwide
(4) Business environment analysis
4.1. Macro-environment
It is crucial for the organisation to analyse its macro environment, which contains factors
that are not directly related to the company and yet have a strong and prominent impact on
the business practices. Here, to analyse the same, PESTEL Model is being used as in
comparison to other frameworks, it covers overall elements of the business environment in a
better manner. Therefore, this model is implemented below:
Political Factors:
The political condition of the UK is quite unstable, giving in to the fact that the nation is
currently suffering from the events of Brexit. This makes a threat for the company’s overseas
operations outside the UK.
Economical Factors:
Almost all the prominent markets in the world are experiencing global recession, which
could be a threat towards the demand of the offerings of the company. However, the game
reflects a demand forecast of almost 7-9% globally, which could bring stability to the firm
despite inappropriate market conditions.
Social Factors:
The trend within the whole world in relation to the footwear sector is to acquire effective
and high quality offerings which are innovative and requires low cost. This is quite an
advantage for the company as the firm’s performance targets align with the current trend and
requirement of the customers.
Technological Factors:
There are various technological outputs that are current prevailing within the industry,
such as Automation and Artificial Intelligence, These technologies could provide enhanced
benefits for Dynamic to enhance the quality, productivity and quantity of the footwears.
Environmental Factors:
The global level concern related to environmental protection is forcing organisations to
switch to sustainable production, packaging and delivery to contribute towards
environmental protection. However, this could be threat for Dynamic as the company’s BSG
report reflects that it does not use recycled packaging, which could be a major cause of
concern for the firm
Legal Factors:
The export and Import legislation are changing across Europe and UK, which might
present certain ineffectiveness for the firm to operate, export and import within these
locations.
10 of 16
Paraphrase This Document
Need a fresh take? Get an instant paraphrase of this document with our AI Paraphraser
4.2. Meso environment
The Meso environment of Dynamic is quite appropriate for the company is quite
appropriate towards supporting its current operations in these fields. Hence, to appropriately
evaluate the same, Porter’s Five Forces is implemented below:
Supplier Bargaining Power:
The supply market within the regions North America, Europe-Africa and Asia Pacific is
highly vast due to abundant suppliers. However, due to heavy changes in regulations within
Europe-Africa regions, the firm is likely to face high bargaining power from suppliers.
Customer Bargaining Power:
There is vast range of customers of the company in different regions and thus, with
enhancement of competition in online market, the firm is forced to keep it prices lower than
S/Q rating in these regions as per its BSG report. Therefore, the bargaining power of
customers is high.
Threat of Substitutes:
There are a range of companies which have innovative footwear ranges that are
inclining customers towards them as the awareness is enhancing. Therefore, this threat is
slowly enhancing for the firm.
Threat of New Entrants:
According to the industrial report from BSG, it could be said to meet the current level of
demand, it would take high investment to enter in the sector which is not possible for most
companies. Furthermore, Dynamic is at a very effective position which makes gives it a
competitive edge and hence, this threat is quite low.
Competitive Rivalry:
The competitive rivalry within the industry is high with firms like Hero and Fable
performing better than Dynamic. Hence, it is required for the firm to differentiate in its
offerings and improvise its pricing strategy to decrease this threat.
4.3. Micro environment
In order to determine the firm’s interior environment, McKinsey’s 7S model is being
used which is discussed as under:
Strategy:
According to the BSG report, the firm is adopting a global low cost strategy, through
which it would create wider market share within limited amount of time and in a prominent
manner.
Structure
11 of 16
The structure of the company as could be interpreted by BSG report is functional. It is a
prominent and contributing structure which allows the company to manage its different
functions such as marketing, production, distribution, administration and so forth.
Systems:
The system of the company is divided on the basis of the product they manufacture,
such as for private label, branded or in pairs. Moreover, marketing department is also
divided on the basis of different tools and techniques. The company uses a range of
methods like Six Sigma and TQM to manage sustainable and effective production.
Shared Values::
The core values of the company include consistency, enhanced quality and provision of
the products at best cost.
Style:
As per the BSG report, Dynamic company pays attention towards supervision which
expresses control. However, there is a range of rewards that are provided by the firm to its
employees such as fringe benefits, extra work compensation and so forth. This reflects that
the leadership style of the company is a blend of both Authoritative and Democratic.
Staff:
There are various employees working in the company which are from different
departments such as marketing, production, distribution and logistics and so forth. The
general capabilities which they possess include high intellect and problem solving skill, along
with innovative capabilities.
Skills:
There are various skills that the employees of Dynamic possess. For instance, as
mentioned above they are quite creative, as well as possess effective people skills and self
management which allows them to manage growth within their performance standards.
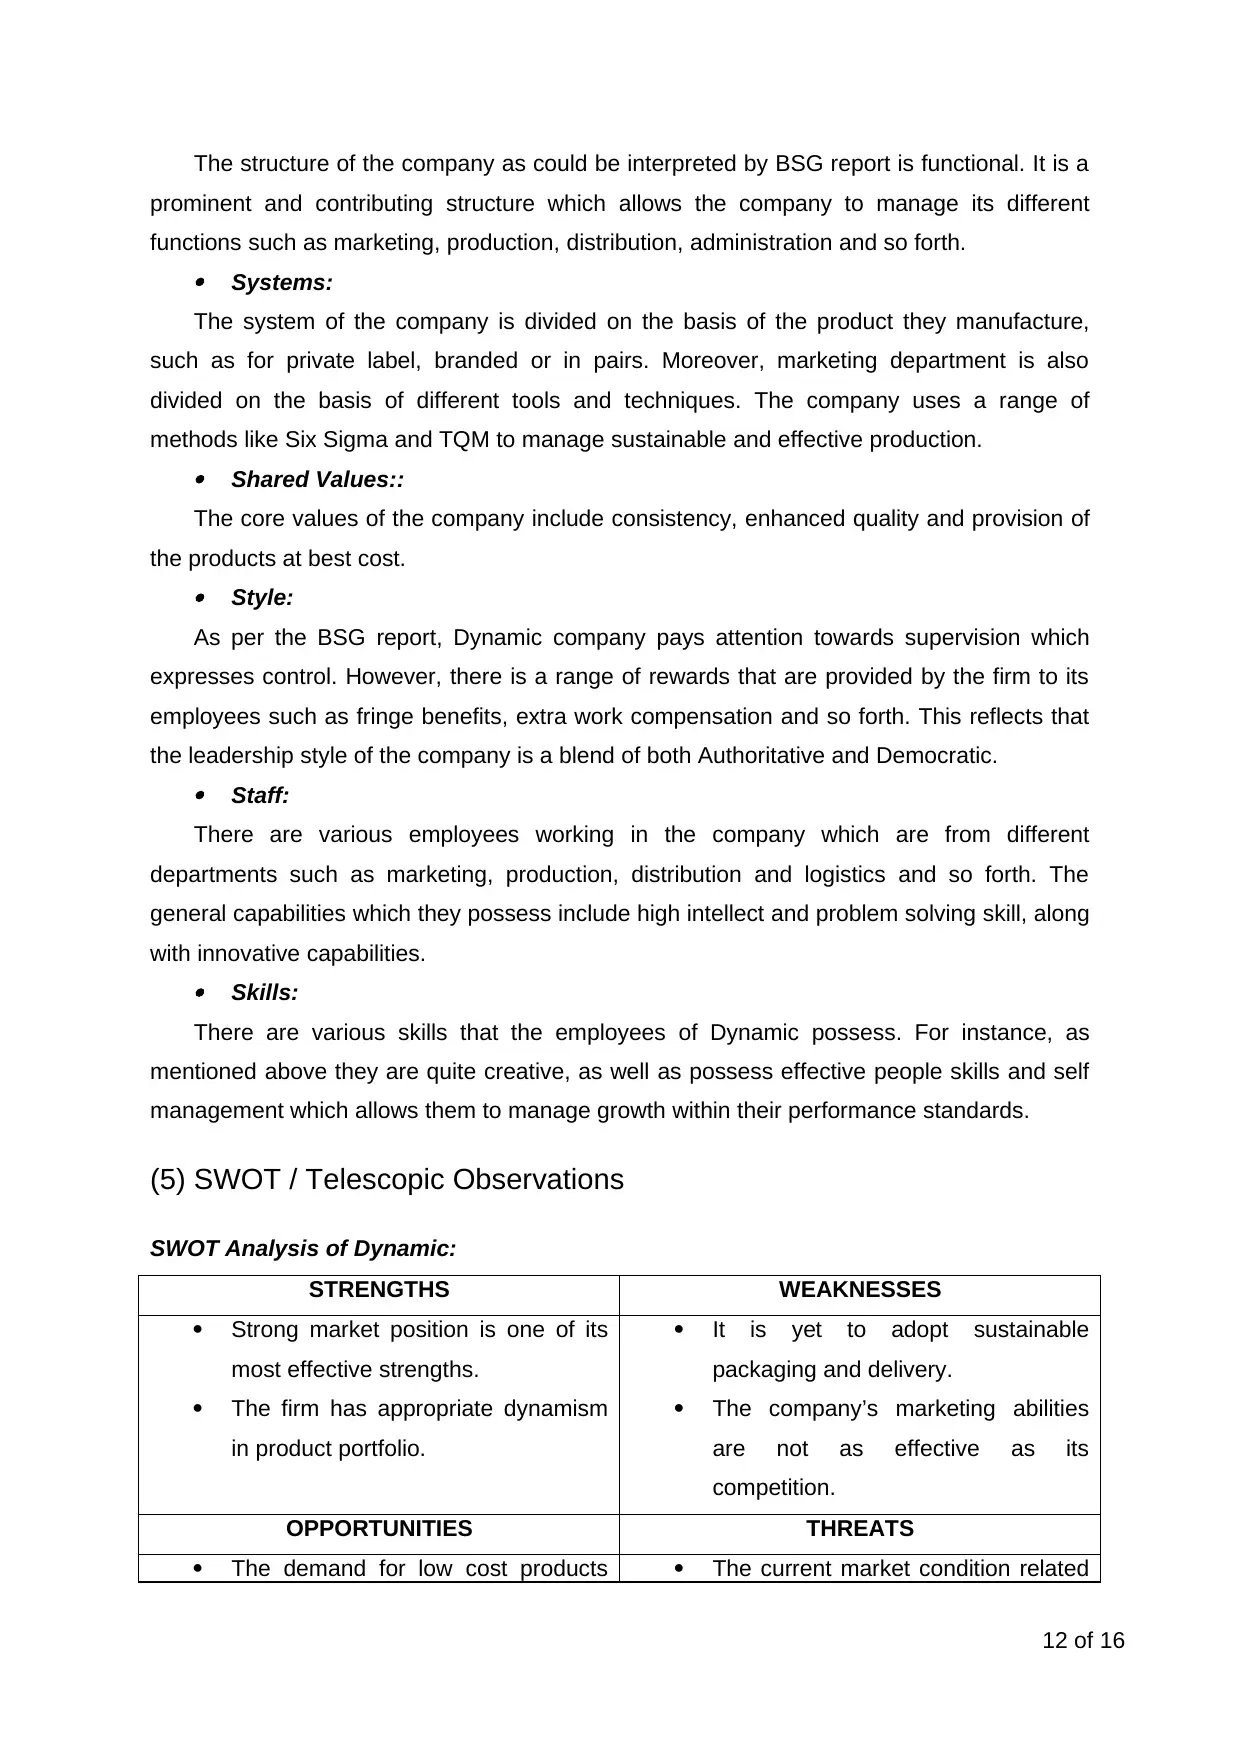
(5) SWOT / Telescopic Observations
SWOT Analysis of Dynamic:
STRENGTHS WEAKNESSES
Strong market position is one of its
most effective strengths.
The firm has appropriate dynamism
in product portfolio.
It is yet to adopt sustainable
packaging and delivery.
The company’s marketing abilities
are not as effective as its
competition.
OPPORTUNITIES THREATS
The demand for low cost products The current market condition related
12 of 16
prominent and contributing structure which allows the company to manage its different
functions such as marketing, production, distribution, administration and so forth.
Systems:
The system of the company is divided on the basis of the product they manufacture,
such as for private label, branded or in pairs. Moreover, marketing department is also
divided on the basis of different tools and techniques. The company uses a range of
methods like Six Sigma and TQM to manage sustainable and effective production.
Shared Values::
The core values of the company include consistency, enhanced quality and provision of
the products at best cost.
Style:
As per the BSG report, Dynamic company pays attention towards supervision which
expresses control. However, there is a range of rewards that are provided by the firm to its
employees such as fringe benefits, extra work compensation and so forth. This reflects that
the leadership style of the company is a blend of both Authoritative and Democratic.
Staff:
There are various employees working in the company which are from different
departments such as marketing, production, distribution and logistics and so forth. The
general capabilities which they possess include high intellect and problem solving skill, along
with innovative capabilities.
Skills:
There are various skills that the employees of Dynamic possess. For instance, as
mentioned above they are quite creative, as well as possess effective people skills and self
management which allows them to manage growth within their performance standards.
(5) SWOT / Telescopic Observations
SWOT Analysis of Dynamic:
STRENGTHS WEAKNESSES
Strong market position is one of its
most effective strengths.
The firm has appropriate dynamism
in product portfolio.
It is yet to adopt sustainable
packaging and delivery.
The company’s marketing abilities
are not as effective as its
competition.
OPPORTUNITIES THREATS
The demand for low cost products The current market condition related
12 of 16
⊘ This is a preview!⊘
Do you want full access?
Subscribe today to unlock all pages.
Trusted by 1+ million students worldwide
1 out of 16
Related Documents


Your All-in-One AI-Powered Toolkit for Academic Success.
+13062052269
info@desklib.com
Available 24*7 on WhatsApp / Email
![[object Object]](/_next/static/media/star-bottom.7253800d.svg)
Unlock your academic potential
Copyright © 2020–2026 A2Z Services. All Rights Reserved. Developed and managed by ZUCOL.