BSS004-1: BIS Data Analysis Report on Barriers to Business Support
VerifiedAdded on 2023/01/11
|12
|2764
|25
Report
AI Summary
This report presents an analysis of a BIS dataset, aiming to identify patterns and barriers related to the uptake and use of business support services. The analysis focuses on comparing the South East and North West regions of the UK, examining variables related to the use of external professional services. The report utilizes data cleaning techniques, including filtering and sorting in Microsoft Excel, to prepare the data for analysis. Pivot tables are used extensively to analyze variables such as urban/rural demographics, the use of external support (Q3_1, Q3_3, Q3_5, Q3_7), and reasons for not using support (Q3_33D, Q4_3A_2, Q4_3A_3, Q4_3A_8). Key findings include the identification of lower business support uptake in both regions, with the South East having a higher number of businesses overall. Barriers identified include concerns about the value for money of services, sufficient internal expertise, difficulty in finding appropriate assistance, and lack of trust in external providers. The report concludes with recommendations for areas requiring further support and highlights regional differences in the barriers faced by businesses.
Using data to build business
practice
practice
Paraphrase This Document
Need a fresh take? Get an instant paraphrase of this document with our AI Paraphraser
Contents
INTRODUCTION...........................................................................................................................1
Analysing the data provided in order to gain an understanding of the pattern of barriers to take
up and use of business support....................................................................................................1
Highlighting interesting findings.................................................................................................8
Recommendations about areas which require further support....................................................9
CONCLUSION..............................................................................................................................10
INTRODUCTION
Using data to build business practice is the process which is referred as data analysis. This
process is used by business organisations, investigators and individuals to analyse the data so
that it can be helpful in decision making. There are various methods and approaches which can
be used to analyse the data; these methods varies according to the nature of data and the aim
behind analysing the data. The main aim of this present report is to identify the data requirements
and then communicate the data findings to the audience.
For the completion of above aim, a data set is provided which belongs to BIS; this is
important to consider that BIS is a department of business innovation and skills which helps
business organisation to survive and grow in competitive market by using innovation. In this
report, the data set is first analysed to conduct a comparison between South East and North West
region by identifying the barriers which limits business owners to take up business support from
external professional services. This analysis is then interpreted to identify interesting findings
and recommendations for the areas that require further support.
Comparison between South East and North West region
Analysing the data provided in order to gain an understanding of the pattern of barriers to take up
and use of business support
Data analysis is a complex procedure which is divided into three steps which are pre
processing the data, analysing the data and lastly visualising the data. For present report, it is
important to compare the data between two regions for which it is essential to first generate the
familiarity with the data.
The data set which has been provided is BIS data that has been collected from a total of
1203 respondents; these respondents are business owners who own a small data. These owners
are asked 6 set of questions, while each set includes numerous sub questions. The last question
that has been asked from these business owners is about the region in which their business is
operating. In order to compare the two provided regions, it is significant to first clean the data to
the extent of these regions only. The data cleaning functions in Microsoft Excel are Filtering,
Sorting etc. Among these functions, the function of Filter is used the Region (3 and 6) filter is
applied to the entire data. The Region 3 is denoted as South East and region 6 is denoted as East
West. This cleaned data is then transferred to a new excel sheet, where decisions about selecting
1
⊘ This is a preview!⊘
Do you want full access?
Subscribe today to unlock all pages.
Trusted by 1+ million students worldwide
the appropriate variables or questions are taken. The comparison between the two regions is
required to be conducted on the basis of barriers which are the reasons behind people do not took
business support. So, considering this, the variables that are selected are all directly related to the
barriers. The variable names that are selected are Q3_1, Q3_3, Q3_5, Q3_7, Q3_33D, Q4_3A_2,
Q4_3A_3, Q4_3A_8, URBANRURAL_2 and REGION.
As the data has been cleaned, it is essential to reduce the data, the variable which are
selected above are now used to reduce the entire data. Excel function which is used to reduce the
data is Pivot table. As, the data has been pre processed, it will now be analysed and visualised.
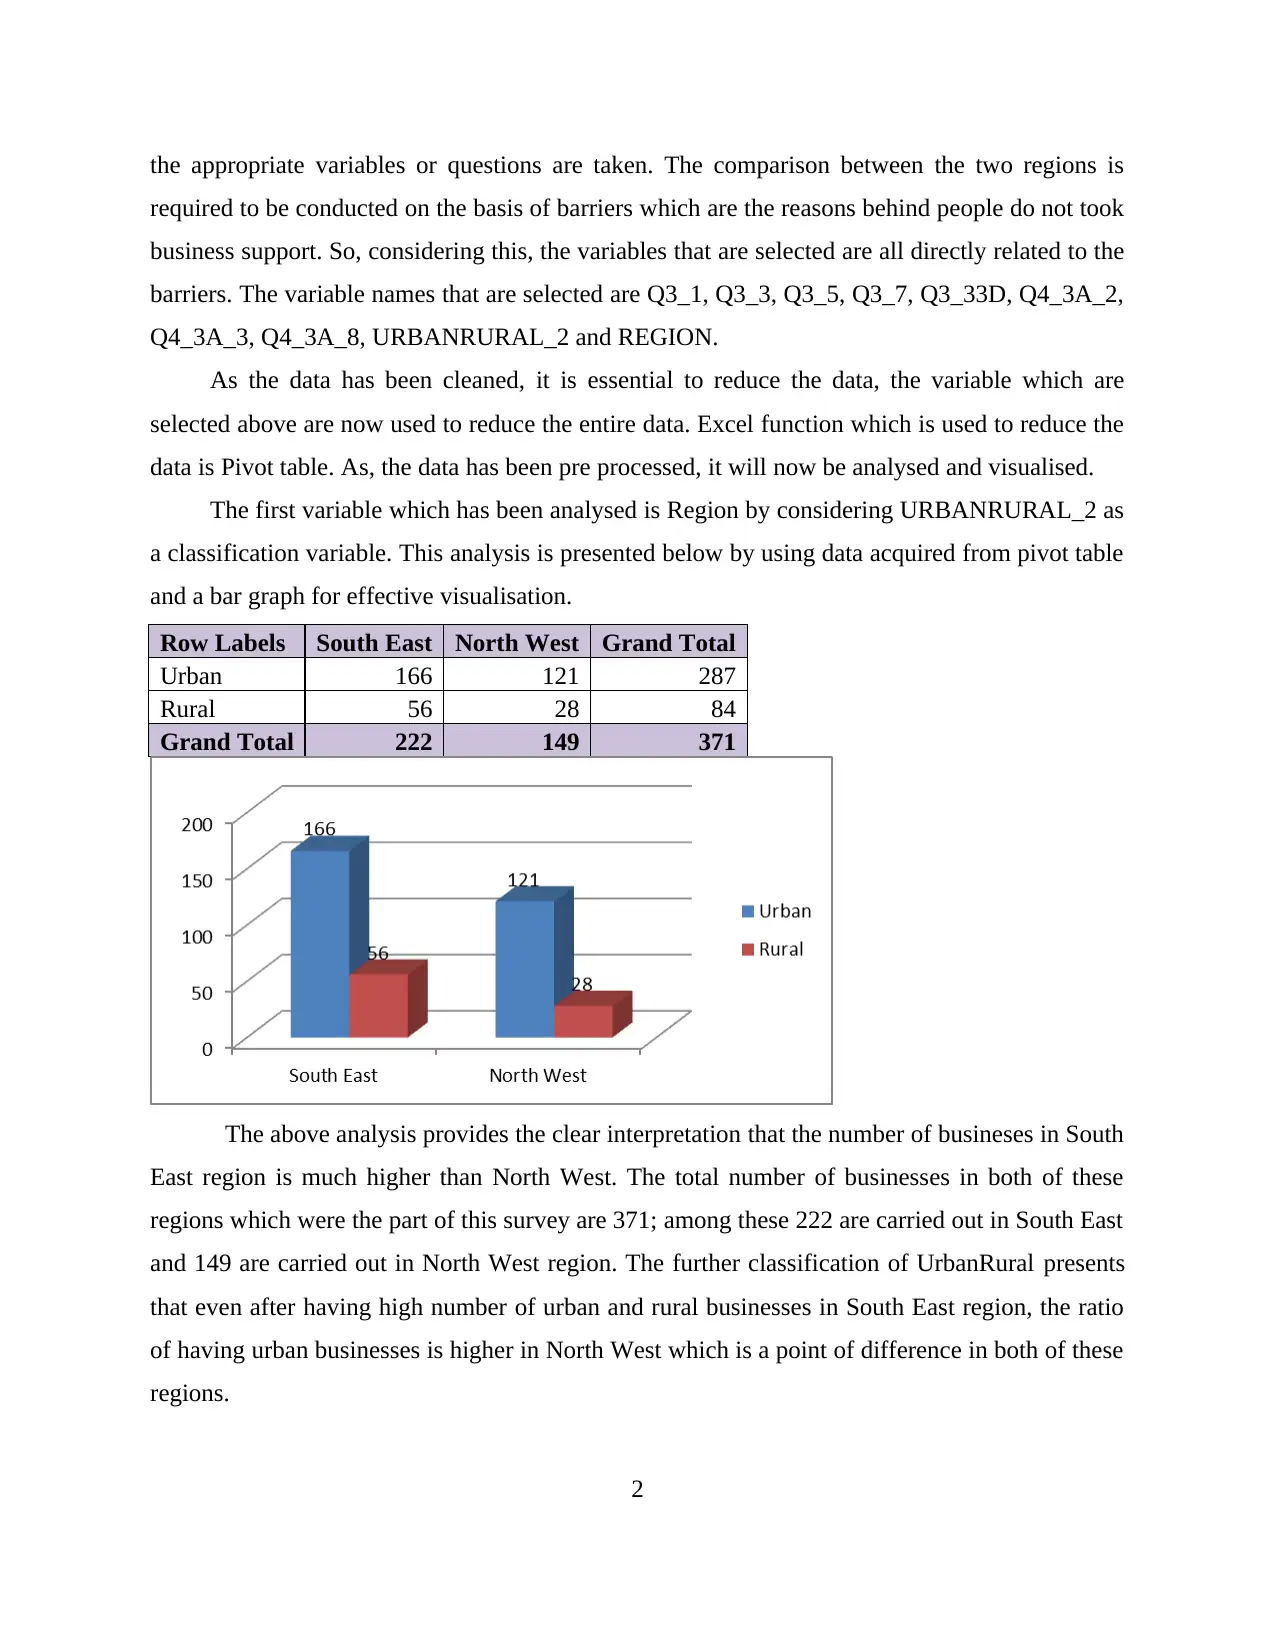
The first variable which has been analysed is Region by considering URBANRURAL_2 as
a classification variable. This analysis is presented below by using data acquired from pivot table
and a bar graph for effective visualisation.
Row Labels South East North West Grand Total
Urban 166 121 287
Rural 56 28 84
Grand Total 222 149 371
The above analysis provides the clear interpretation that the number of busineses in South
East region is much higher than North West. The total number of businesses in both of these
regions which were the part of this survey are 371; among these 222 are carried out in South East
and 149 are carried out in North West region. The further classification of UrbanRural presents
that even after having high number of urban and rural businesses in South East region, the ratio
of having urban businesses is higher in North West which is a point of difference in both of these
regions.
2
required to be conducted on the basis of barriers which are the reasons behind people do not took
business support. So, considering this, the variables that are selected are all directly related to the
barriers. The variable names that are selected are Q3_1, Q3_3, Q3_5, Q3_7, Q3_33D, Q4_3A_2,
Q4_3A_3, Q4_3A_8, URBANRURAL_2 and REGION.
As the data has been cleaned, it is essential to reduce the data, the variable which are
selected above are now used to reduce the entire data. Excel function which is used to reduce the
data is Pivot table. As, the data has been pre processed, it will now be analysed and visualised.
The first variable which has been analysed is Region by considering URBANRURAL_2 as
a classification variable. This analysis is presented below by using data acquired from pivot table
and a bar graph for effective visualisation.
Row Labels South East North West Grand Total
Urban 166 121 287
Rural 56 28 84
Grand Total 222 149 371
The above analysis provides the clear interpretation that the number of busineses in South
East region is much higher than North West. The total number of businesses in both of these
regions which were the part of this survey are 371; among these 222 are carried out in South East
and 149 are carried out in North West region. The further classification of UrbanRural presents
that even after having high number of urban and rural businesses in South East region, the ratio
of having urban businesses is higher in North West which is a point of difference in both of these
regions.
2
Paraphrase This Document
Need a fresh take? Get an instant paraphrase of this document with our AI Paraphraser
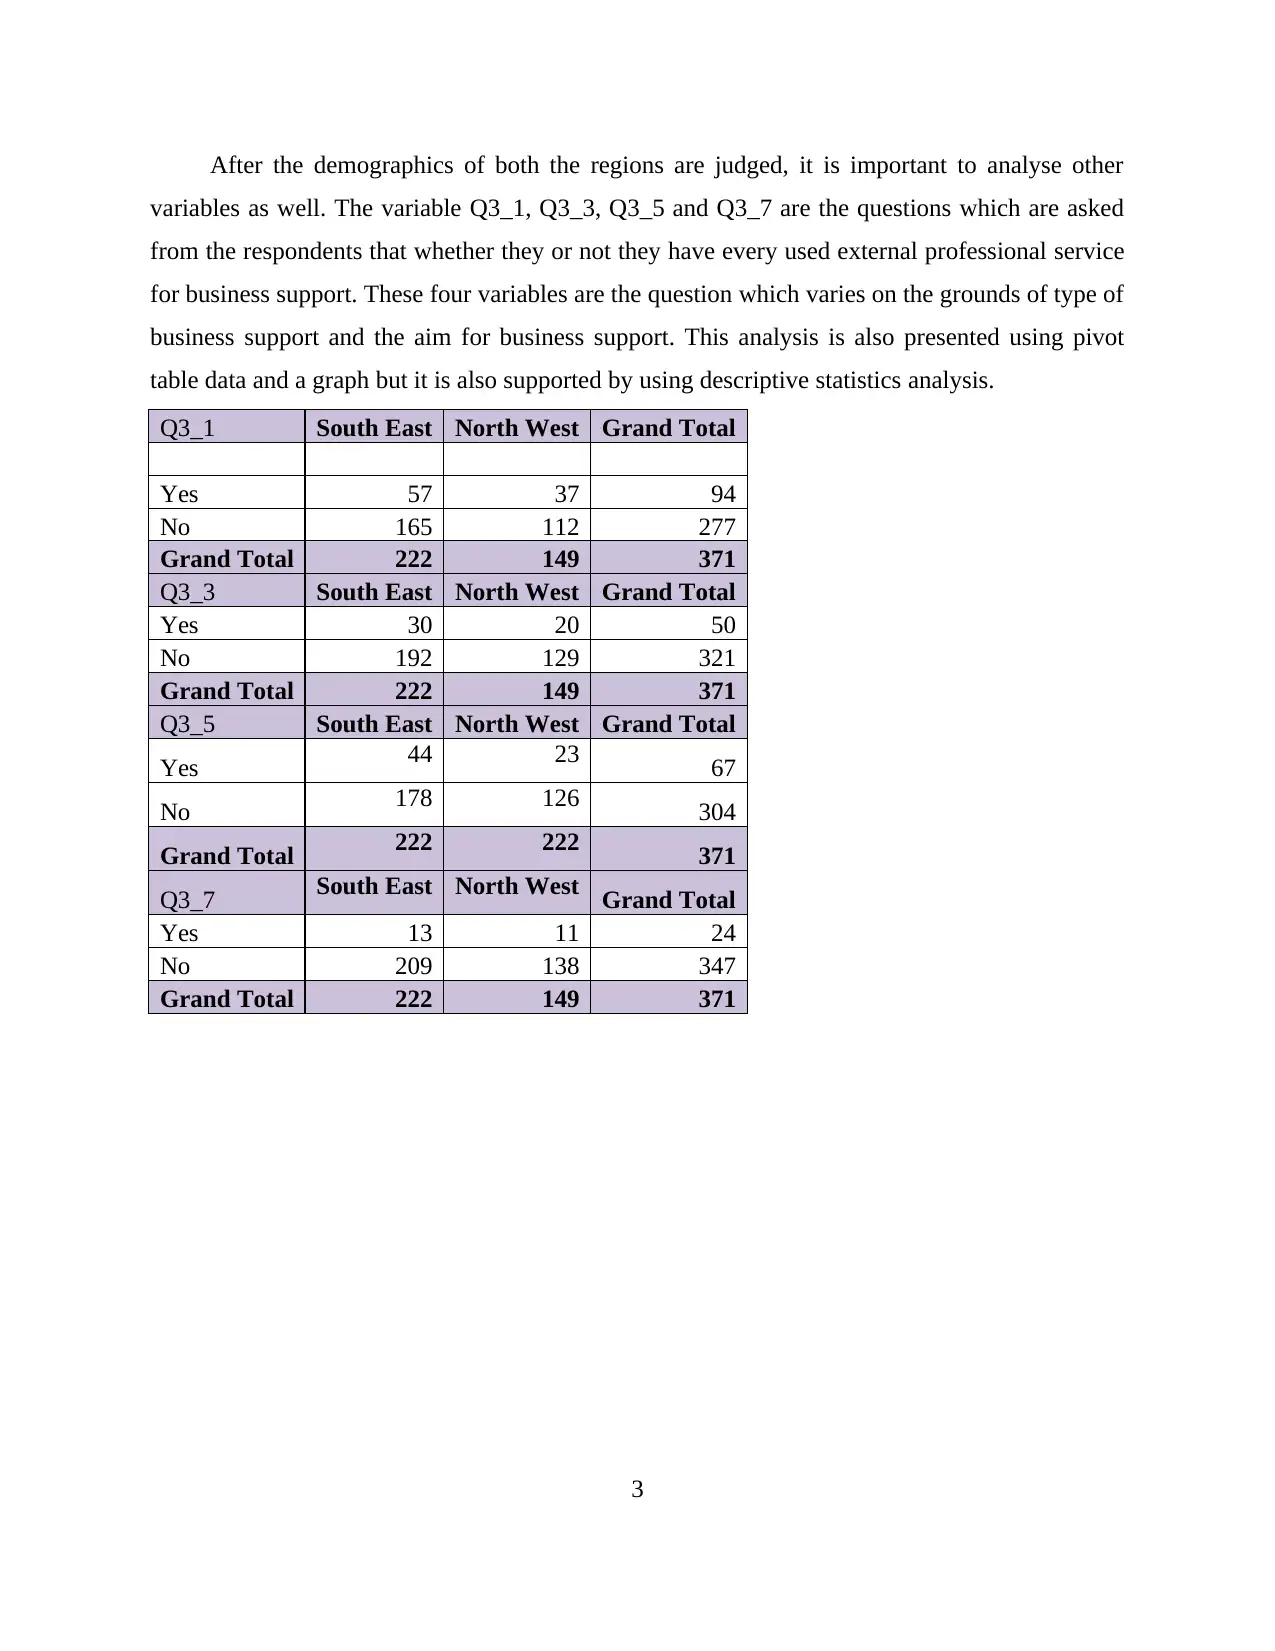
After the demographics of both the regions are judged, it is important to analyse other
variables as well. The variable Q3_1, Q3_3, Q3_5 and Q3_7 are the questions which are asked
from the respondents that whether they or not they have every used external professional service
for business support. These four variables are the question which varies on the grounds of type of
business support and the aim for business support. This analysis is also presented using pivot
table data and a graph but it is also supported by using descriptive statistics analysis.
Q3_1 South East North West Grand Total
Yes 57 37 94
No 165 112 277
Grand Total 222 149 371
Q3_3 South East North West Grand Total
Yes 30 20 50
No 192 129 321
Grand Total 222 149 371
Q3_5 South East North West Grand Total
Yes 44 23 67
No 178 126 304
Grand Total 222 222 371
Q3_7 South East North West Grand Total
Yes 13 11 24
No 209 138 347
Grand Total 222 149 371
3
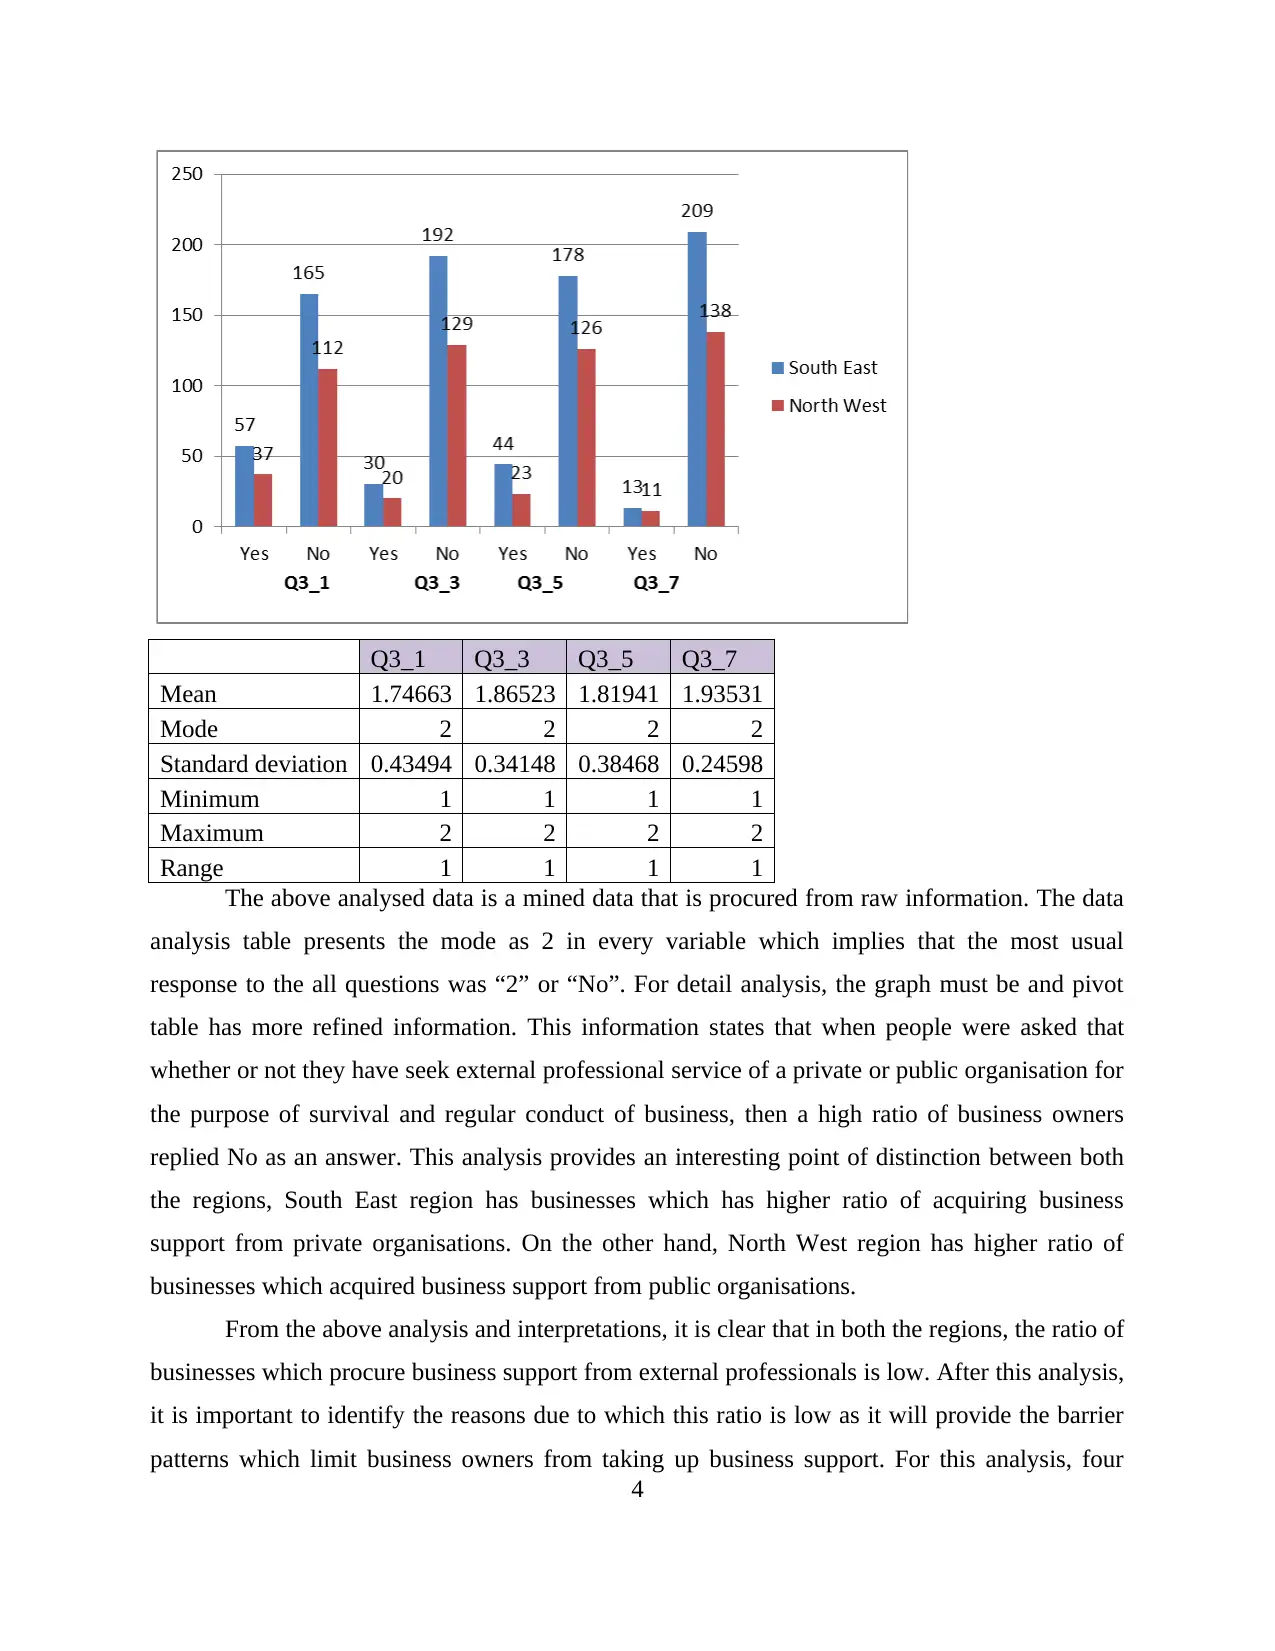
Q3_1 Q3_3 Q3_5 Q3_7
Mean 1.74663 1.86523 1.81941 1.93531
Mode 2 2 2 2
Standard deviation 0.43494 0.34148 0.38468 0.24598
Minimum 1 1 1 1
Maximum 2 2 2 2
Range 1 1 1 1
The above analysed data is a mined data that is procured from raw information. The data
analysis table presents the mode as 2 in every variable which implies that the most usual
response to the all questions was “2” or “No”. For detail analysis, the graph must be and pivot
table has more refined information. This information states that when people were asked that
whether or not they have seek external professional service of a private or public organisation for
the purpose of survival and regular conduct of business, then a high ratio of business owners
replied No as an answer. This analysis provides an interesting point of distinction between both
the regions, South East region has businesses which has higher ratio of acquiring business
support from private organisations. On the other hand, North West region has higher ratio of
businesses which acquired business support from public organisations.
From the above analysis and interpretations, it is clear that in both the regions, the ratio of
businesses which procure business support from external professionals is low. After this analysis,
it is important to identify the reasons due to which this ratio is low as it will provide the barrier
patterns which limit business owners from taking up business support. For this analysis, four
4
⊘ This is a preview!⊘
Do you want full access?
Subscribe today to unlock all pages.
Trusted by 1+ million students worldwide
variables are considered as viable which are Q3_33D, Q4_3A_2, Q4_3A_3, Q4_3A_8. All these
variables are now analysed separately below:
The variable Q3_33D is only for business owners who already have taken up the business
support. These respondents were asked that whether the service they received was good value of
money or not and their responses are presented using a table below:
Row Labels South East North West
Grand
Total
Urban 13 11 24
Yes 7 8 15
No 4 2 6
Don't know 2 1 3
(blank)
Rural 4 1 5
Yes 3 1 4
Don't know 1 1
(blank)
Grand Total 17 12 29
The above analysis presents that more than half business owners think that the business
support service which they receive was the good value for money but the a significant ratio of
business owners think that the service they received was not the good value for money. So, this
provides us the first barrier due to which businesses do not take up business support. Business
owners have experienced previous services which were not good for money due to which they do
not prefer to use those services further. This interpretation also provides a point of difference that
North West region has higher ratio of businesses which think that the services they received were
the good value for money and this distinction is may be because of the high number of urban
businesses in this area.
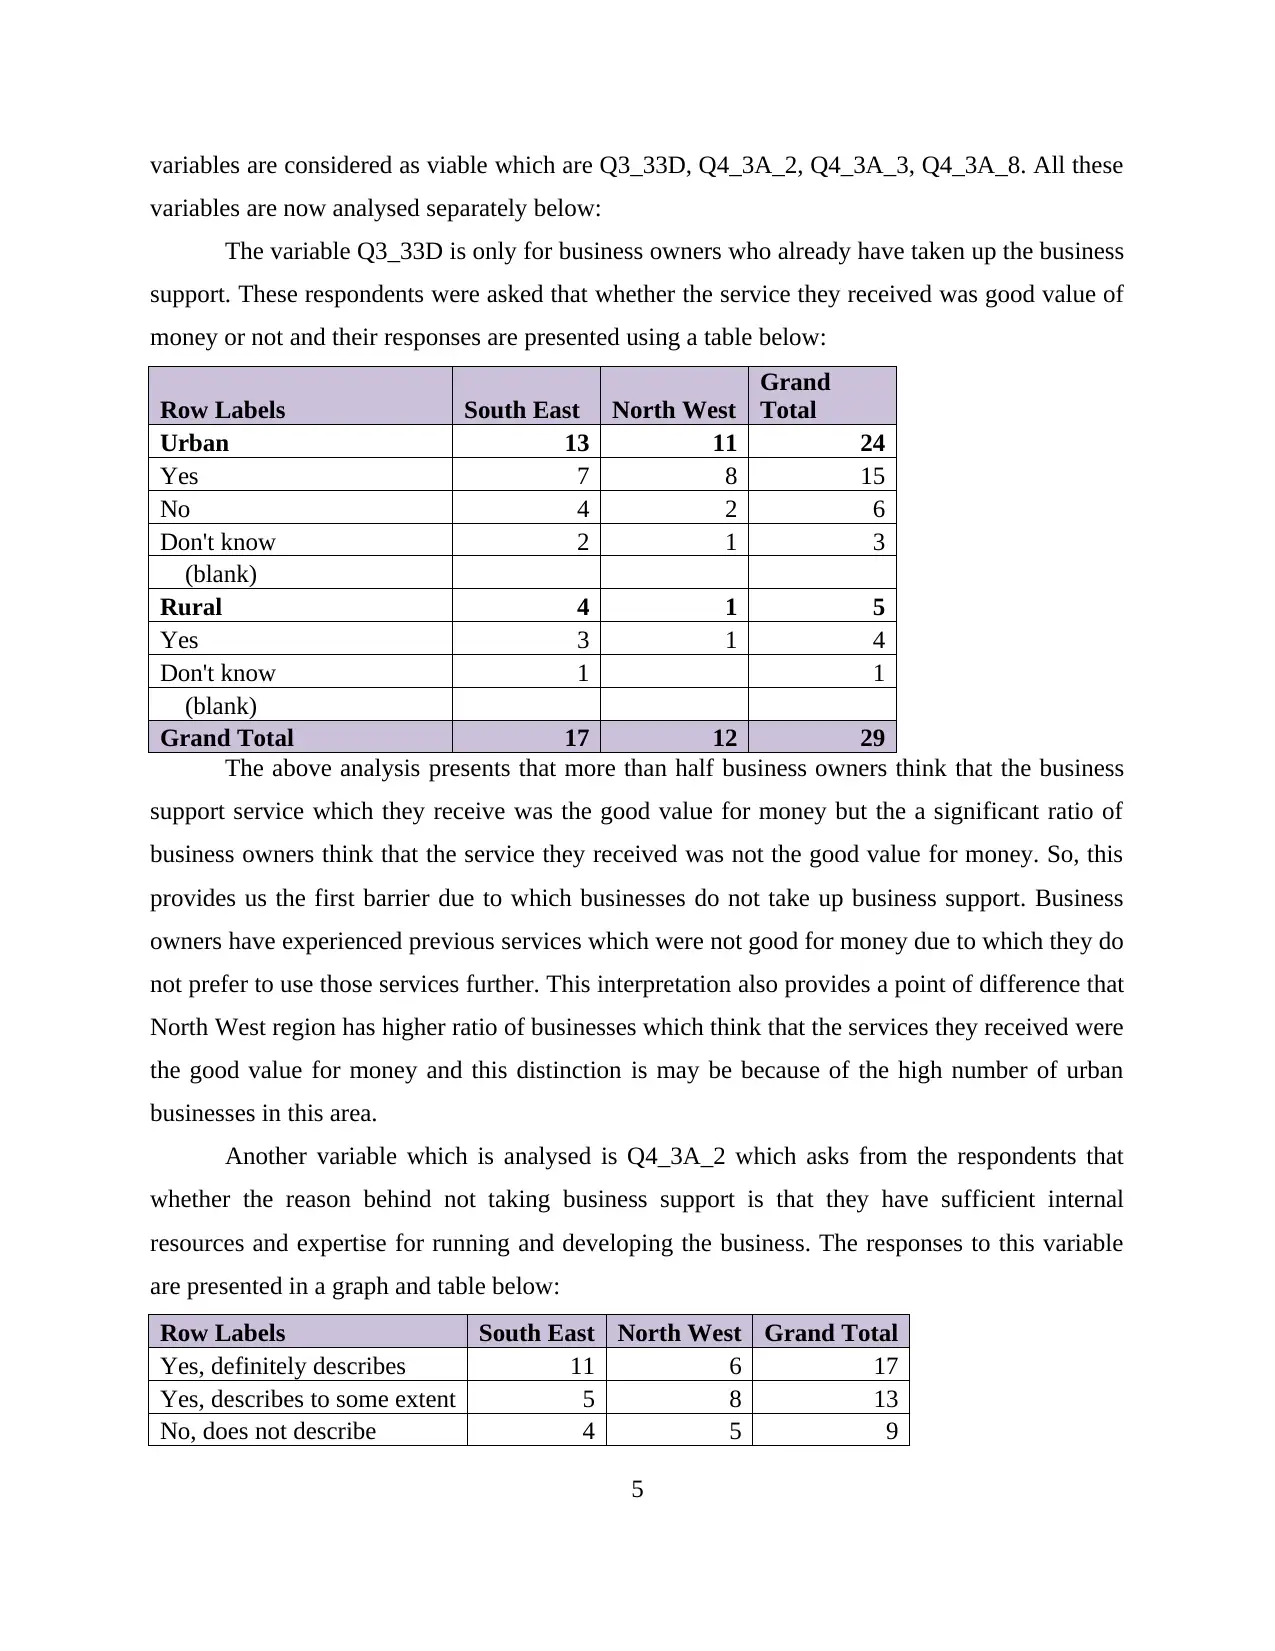
Another variable which is analysed is Q4_3A_2 which asks from the respondents that
whether the reason behind not taking business support is that they have sufficient internal
resources and expertise for running and developing the business. The responses to this variable
are presented in a graph and table below:
Row Labels South East North West Grand Total
Yes, definitely describes 11 6 17
Yes, describes to some extent 5 8 13
No, does not describe 4 5 9
5
variables are now analysed separately below:
The variable Q3_33D is only for business owners who already have taken up the business
support. These respondents were asked that whether the service they received was good value of
money or not and their responses are presented using a table below:
Row Labels South East North West
Grand
Total
Urban 13 11 24
Yes 7 8 15
No 4 2 6
Don't know 2 1 3
(blank)
Rural 4 1 5
Yes 3 1 4
Don't know 1 1
(blank)
Grand Total 17 12 29
The above analysis presents that more than half business owners think that the business
support service which they receive was the good value for money but the a significant ratio of
business owners think that the service they received was not the good value for money. So, this
provides us the first barrier due to which businesses do not take up business support. Business
owners have experienced previous services which were not good for money due to which they do
not prefer to use those services further. This interpretation also provides a point of difference that
North West region has higher ratio of businesses which think that the services they received were
the good value for money and this distinction is may be because of the high number of urban
businesses in this area.
Another variable which is analysed is Q4_3A_2 which asks from the respondents that
whether the reason behind not taking business support is that they have sufficient internal
resources and expertise for running and developing the business. The responses to this variable
are presented in a graph and table below:
Row Labels South East North West Grand Total
Yes, definitely describes 11 6 17
Yes, describes to some extent 5 8 13
No, does not describe 4 5 9
5
Paraphrase This Document
Need a fresh take? Get an instant paraphrase of this document with our AI Paraphraser
Don't know
Grand Total 20 19 39
From the above analysis, it has been observed that highest number of business owners
has responded “1” or “2” which implies business owners think that their personnel is well skilled
to handle business affairs and there is no need to seek external advice. Another point of
difference between both the regions is also identified that states this barrier has a more infleunce
on businesses of South East region than North West region.
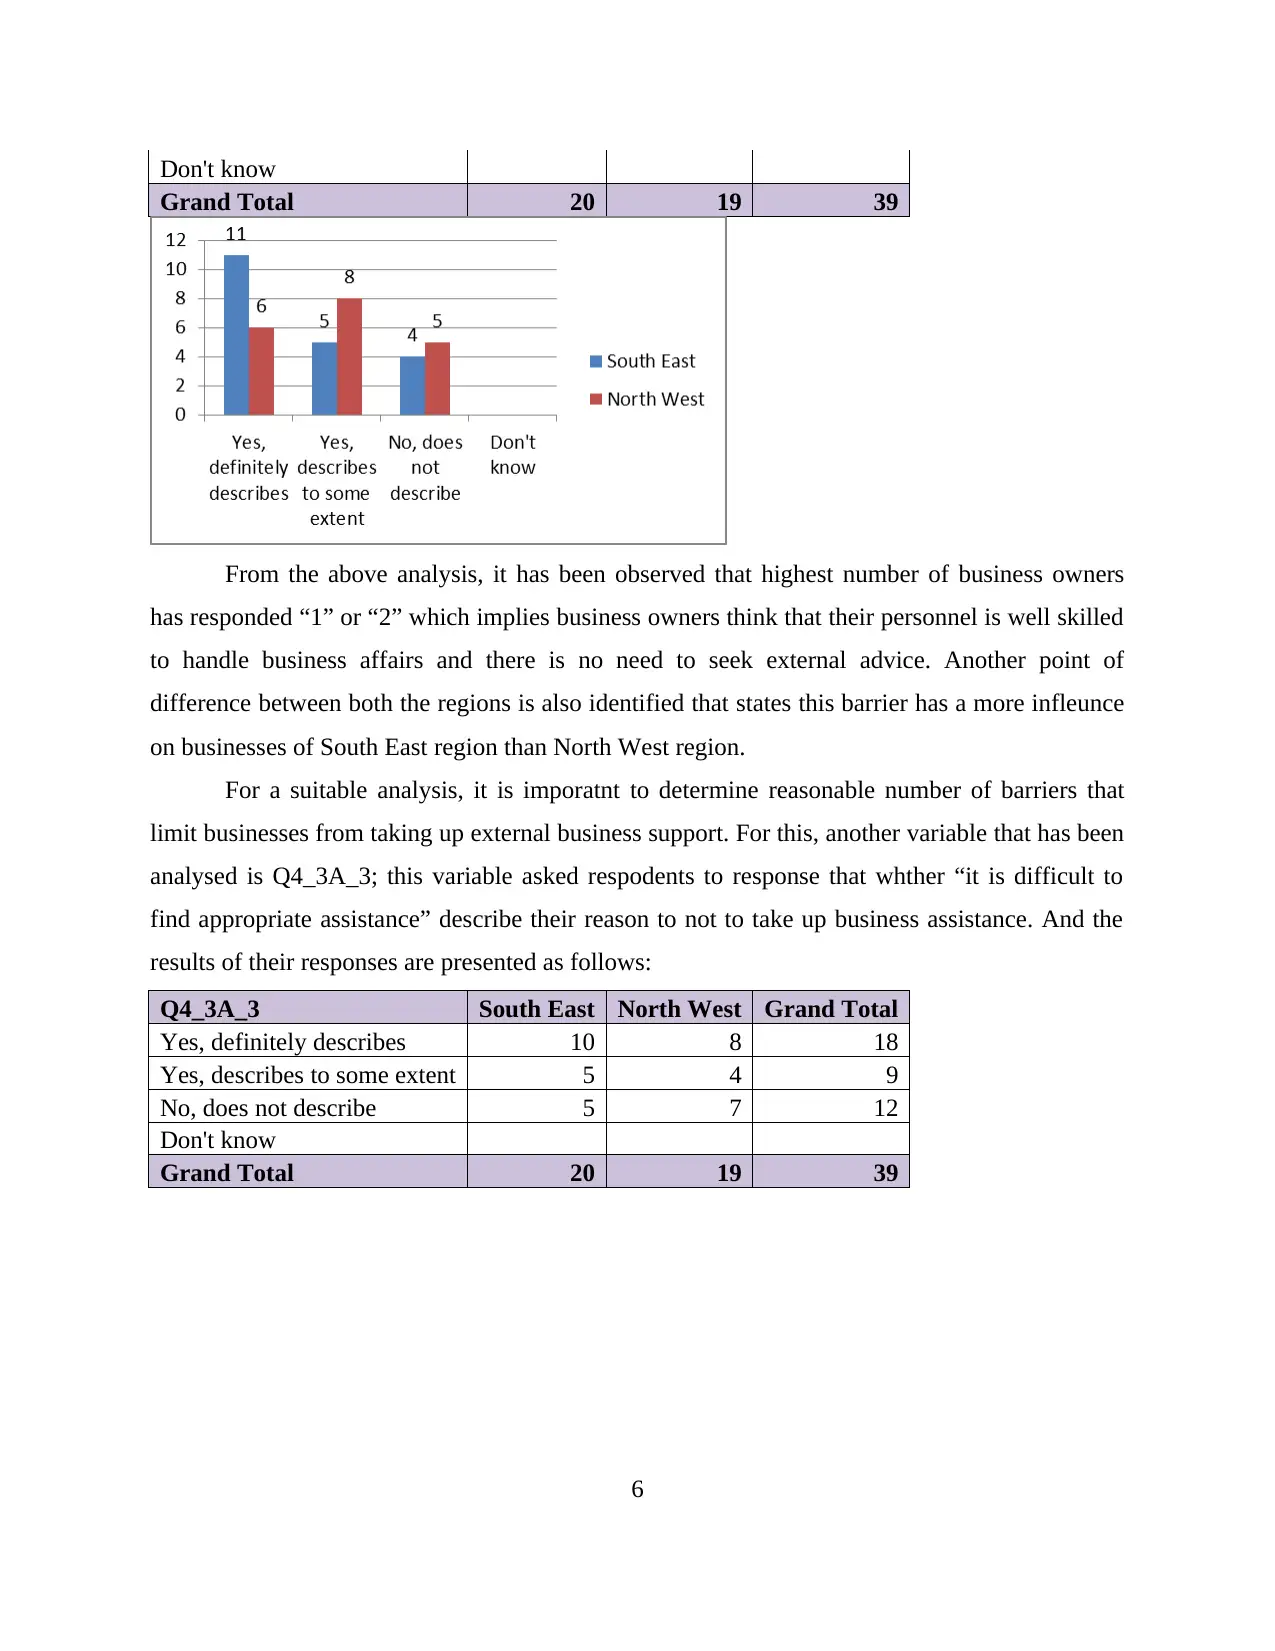
For a suitable analysis, it is imporatnt to determine reasonable number of barriers that
limit businesses from taking up external business support. For this, another variable that has been
analysed is Q4_3A_3; this variable asked respodents to response that whther “it is difficult to
find appropriate assistance” describe their reason to not to take up business assistance. And the
results of their responses are presented as follows:
Q4_3A_3 South East North West Grand Total
Yes, definitely describes 10 8 18
Yes, describes to some extent 5 4 9
No, does not describe 5 7 12
Don't know
Grand Total 20 19 39
6
Grand Total 20 19 39
From the above analysis, it has been observed that highest number of business owners
has responded “1” or “2” which implies business owners think that their personnel is well skilled
to handle business affairs and there is no need to seek external advice. Another point of
difference between both the regions is also identified that states this barrier has a more infleunce
on businesses of South East region than North West region.
For a suitable analysis, it is imporatnt to determine reasonable number of barriers that
limit businesses from taking up external business support. For this, another variable that has been
analysed is Q4_3A_3; this variable asked respodents to response that whther “it is difficult to
find appropriate assistance” describe their reason to not to take up business assistance. And the
results of their responses are presented as follows:
Q4_3A_3 South East North West Grand Total
Yes, definitely describes 10 8 18
Yes, describes to some extent 5 4 9
No, does not describe 5 7 12
Don't know
Grand Total 20 19 39
6
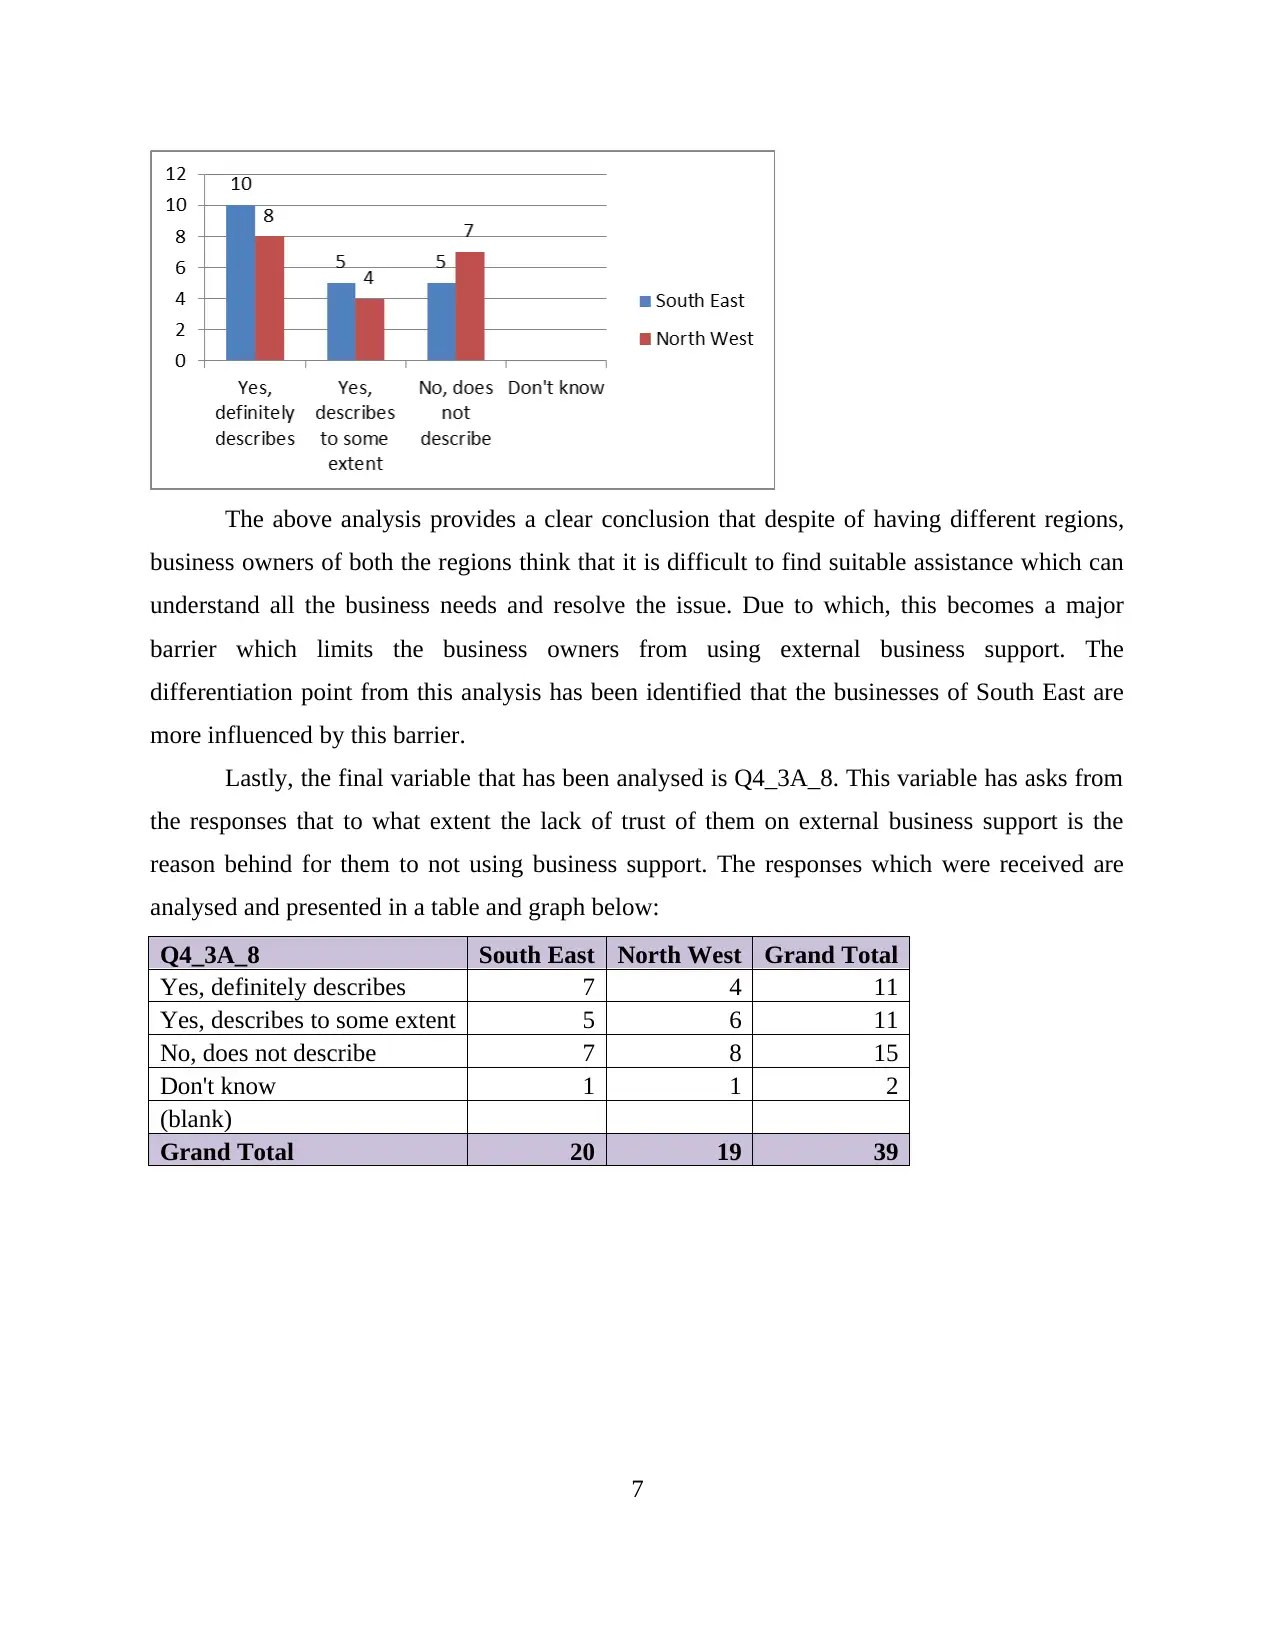
The above analysis provides a clear conclusion that despite of having different regions,
business owners of both the regions think that it is difficult to find suitable assistance which can
understand all the business needs and resolve the issue. Due to which, this becomes a major
barrier which limits the business owners from using external business support. The
differentiation point from this analysis has been identified that the businesses of South East are
more influenced by this barrier.
Lastly, the final variable that has been analysed is Q4_3A_8. This variable has asks from
the responses that to what extent the lack of trust of them on external business support is the
reason behind for them to not using business support. The responses which were received are
analysed and presented in a table and graph below:
Q4_3A_8 South East North West Grand Total
Yes, definitely describes 7 4 11
Yes, describes to some extent 5 6 11
No, does not describe 7 8 15
Don't know 1 1 2
(blank)
Grand Total 20 19 39
7
⊘ This is a preview!⊘
Do you want full access?
Subscribe today to unlock all pages.
Trusted by 1+ million students worldwide
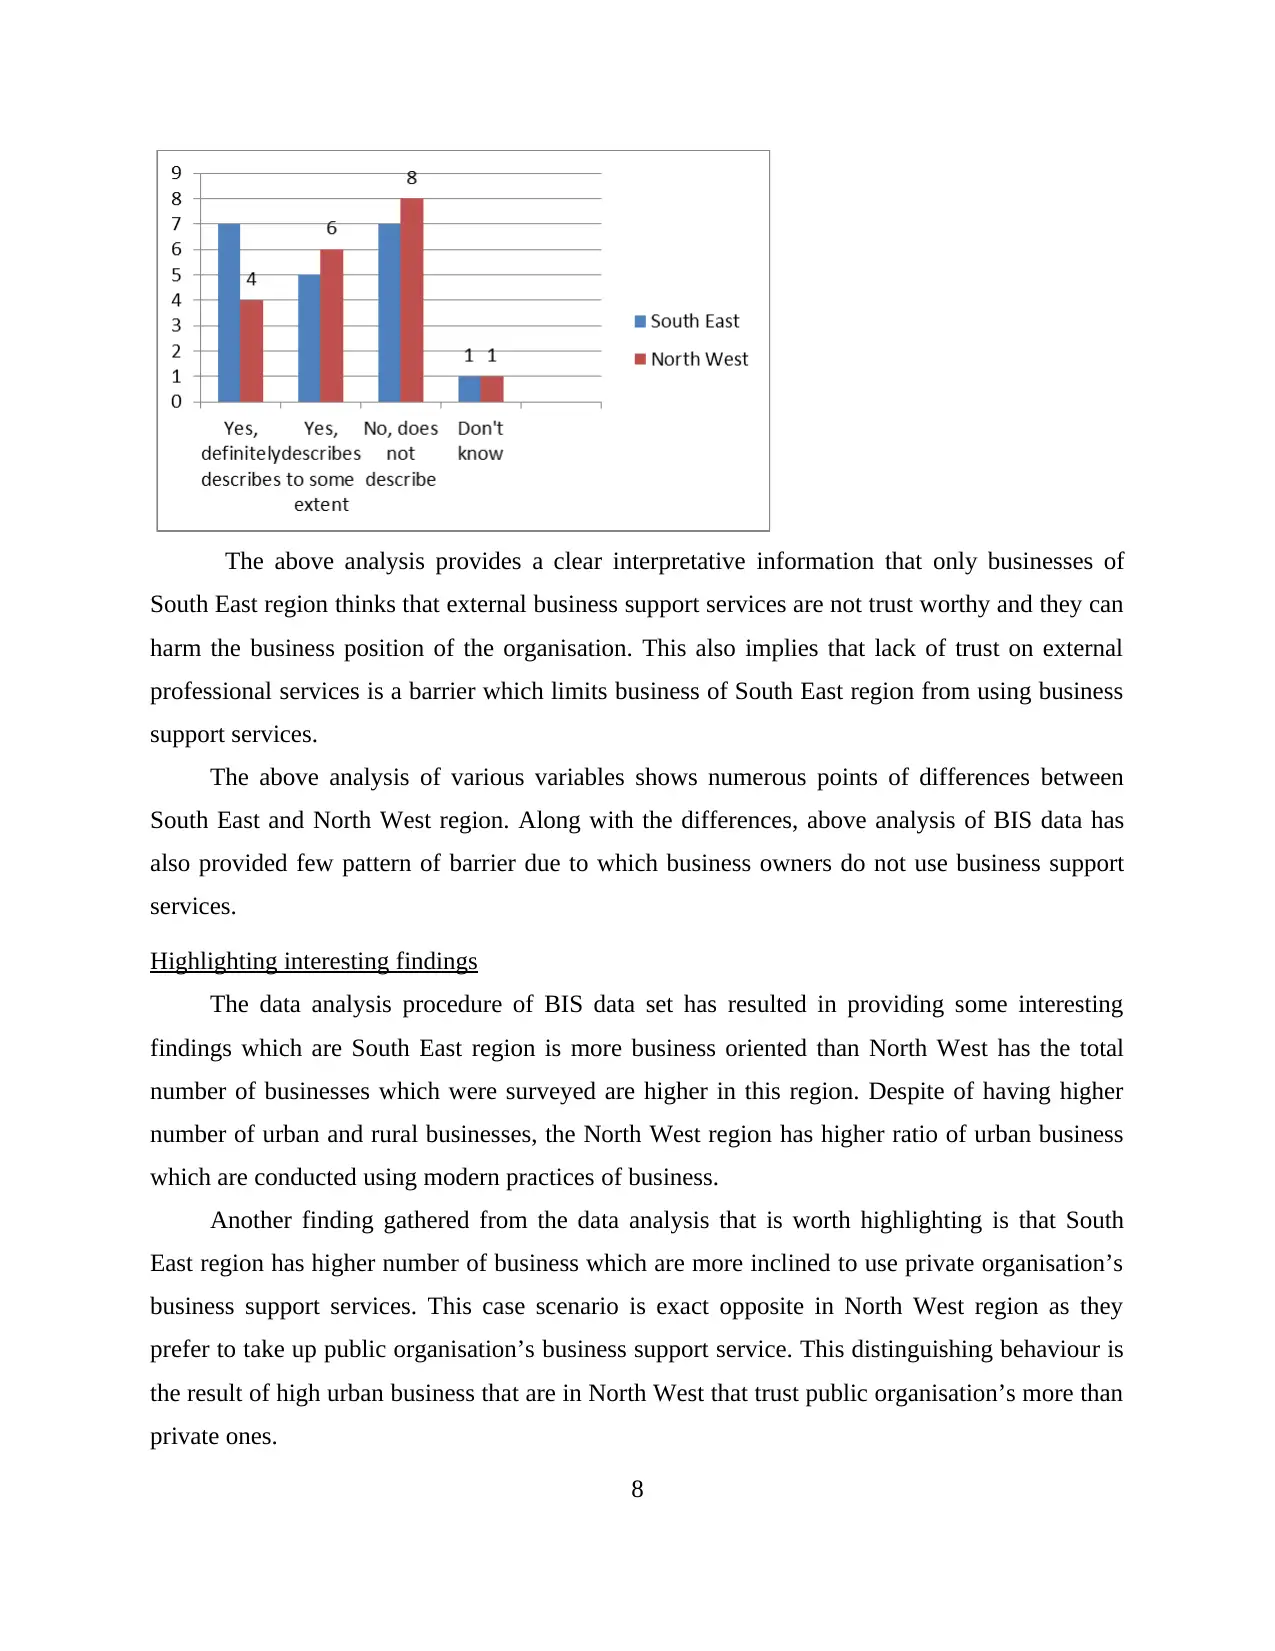
The above analysis provides a clear interpretative information that only businesses of
South East region thinks that external business support services are not trust worthy and they can
harm the business position of the organisation. This also implies that lack of trust on external
professional services is a barrier which limits business of South East region from using business
support services.
The above analysis of various variables shows numerous points of differences between
South East and North West region. Along with the differences, above analysis of BIS data has
also provided few pattern of barrier due to which business owners do not use business support
services.
Highlighting interesting findings
The data analysis procedure of BIS data set has resulted in providing some interesting
findings which are South East region is more business oriented than North West has the total
number of businesses which were surveyed are higher in this region. Despite of having higher
number of urban and rural businesses, the North West region has higher ratio of urban business
which are conducted using modern practices of business.
Another finding gathered from the data analysis that is worth highlighting is that South
East region has higher number of business which are more inclined to use private organisation’s
business support services. This case scenario is exact opposite in North West region as they
prefer to take up public organisation’s business support service. This distinguishing behaviour is
the result of high urban business that are in North West that trust public organisation’s more than
private ones.
8
Paraphrase This Document
Need a fresh take? Get an instant paraphrase of this document with our AI Paraphraser
Services which are procured from external business support professionals are a good value
of money is a worth considering finding. But it is more important to highlight that approximately
38% of South East businesses and approximately 25% of North West businesses due to consider
external professional service a good value for their money, this finding is also a base for
interesting recommendations.
Another finding of the BIS data is that South East region has more number of rural
businesses and this triggers the utilisation of traditional practices in this region. The influence of
the barrier that “Our organisation has valid skilled personnel to tackle all business affairs” is
most on South East region. As most businesses in South East are rural due to which they think
any external business support cannot help them with their business needs.
The most influential barrier pattern which has been found that restricts business owners
from taking up business support is the thought process of business owners that it is hard to find a
suitable assistance which can help and provide appropriate business support. It has been also
identified that only South East region’s businesses are impacted from the barrier of lack of trust
on external support professionals.
Recommendations about areas which require further support
There are few recommendations and suggestions which are worthy to be considered in order
to help businesses to grow and survive in a competitive market, these recommendations are:
BIS must promote their services of providing business support by using word of mouth.
This department must use their positive reviews to attract new businesses towards their
service, as for now; the thought process of business owner is the biggest barrier which
can be changed by providing them a positive example of business which has been really
benefited from business support services.
The region of South East must be focused more as this region has more number of rural
businesses which have low trust on external professionals.
It is recommended to spread awareness regarding business support services and how they
can benefit business. Along with this, business owners must be invite to seminars and
workshops where they can identify which business support assistance service is suitable
for their business.
9
CONCLUSION
From the above report, it has been concluded that business analysis is step by step procedure
which helps in using the data to build business practice. It has been also concluded that BIS is a
governmental department which is engaged in helping businesses to bring skills and innovation
in their business. It has been also concluded that the mind set of business owners that business
support services are hard to find, no good value for money, are less trustworthy are the barriers
which restrict them for taking up such service.
10
⊘ This is a preview!⊘
Do you want full access?
Subscribe today to unlock all pages.
Trusted by 1+ million students worldwide
1 out of 12
Related Documents


Your All-in-One AI-Powered Toolkit for Academic Success.
+13062052269
info@desklib.com
Available 24*7 on WhatsApp / Email
![[object Object]](/_next/static/media/star-bottom.7253800d.svg)
Unlock your academic potential
Copyright © 2020–2026 A2Z Services. All Rights Reserved. Developed and managed by ZUCOL.