Premier Investments: Comprehensive Report on Business Sustainability

Verified

Added on  2020/03/23

|17
|2734
|62
Report
AI Summary
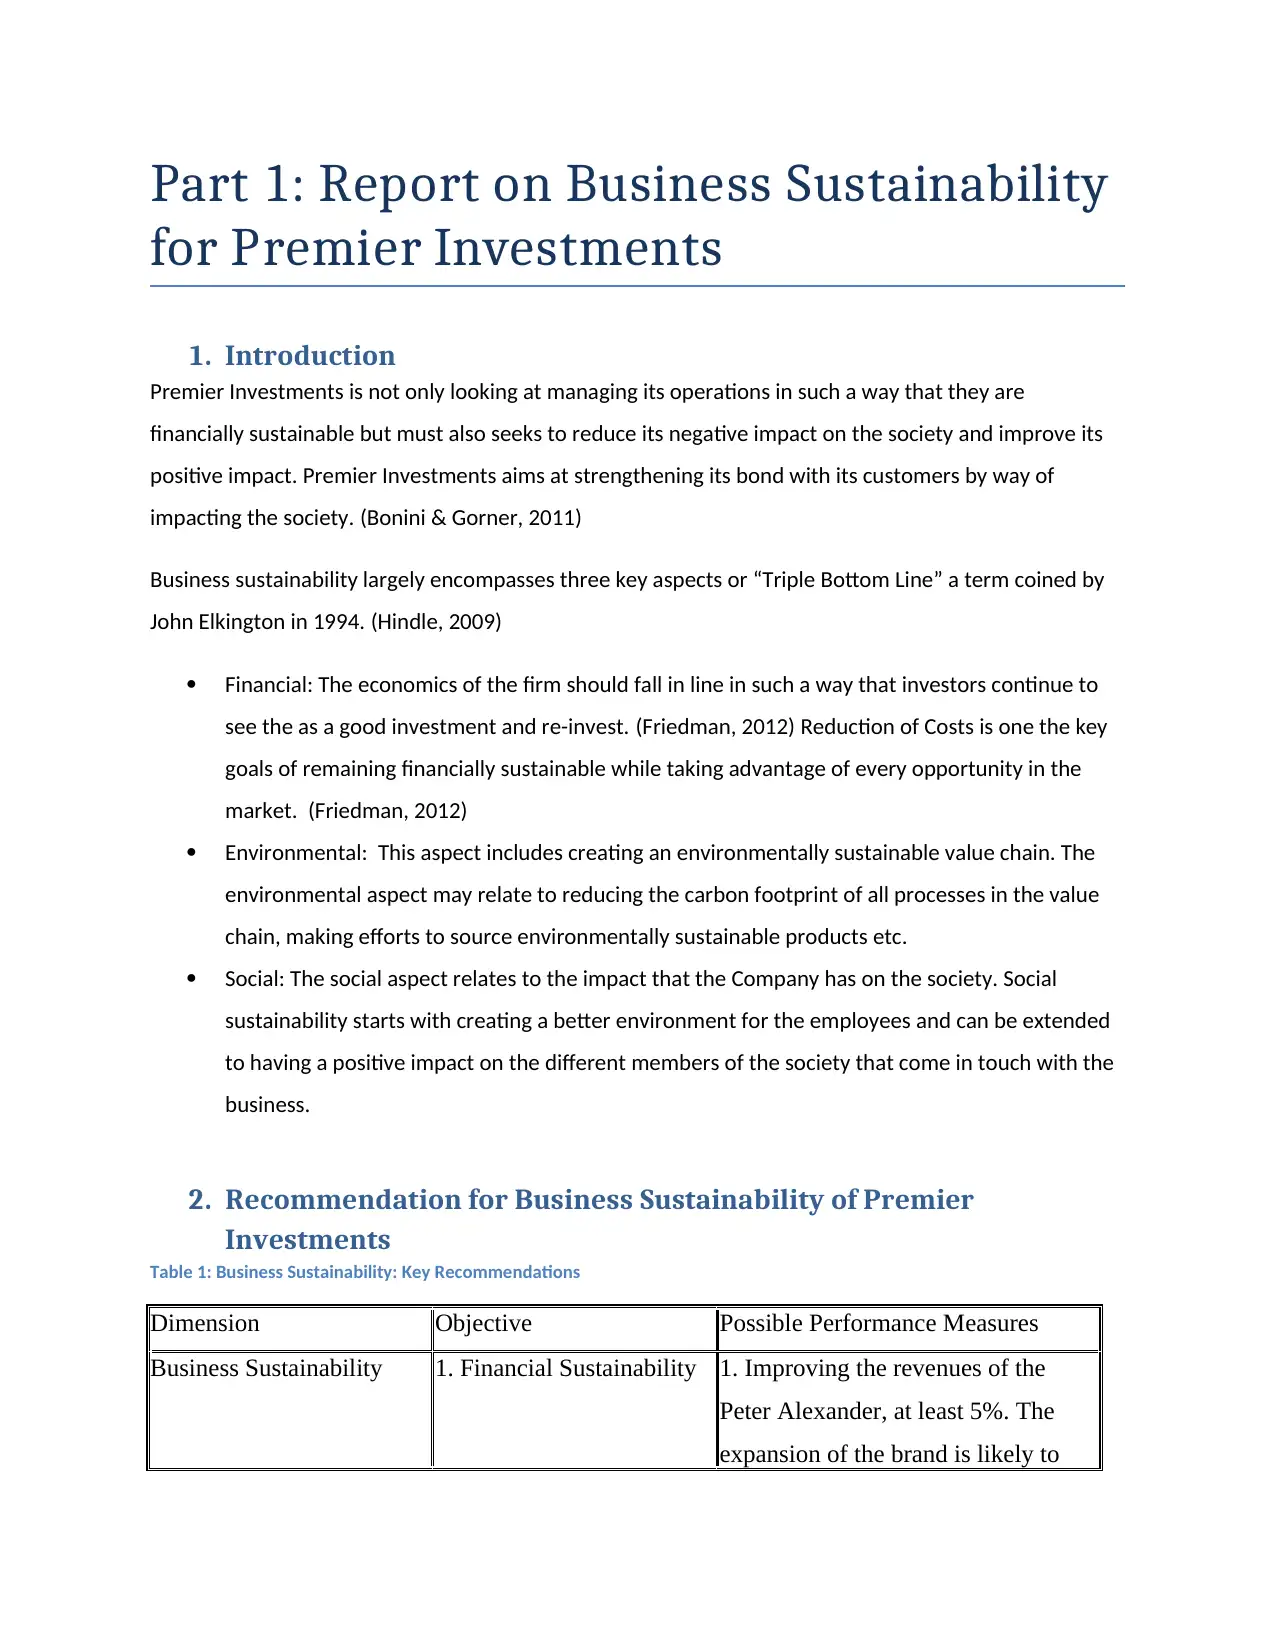
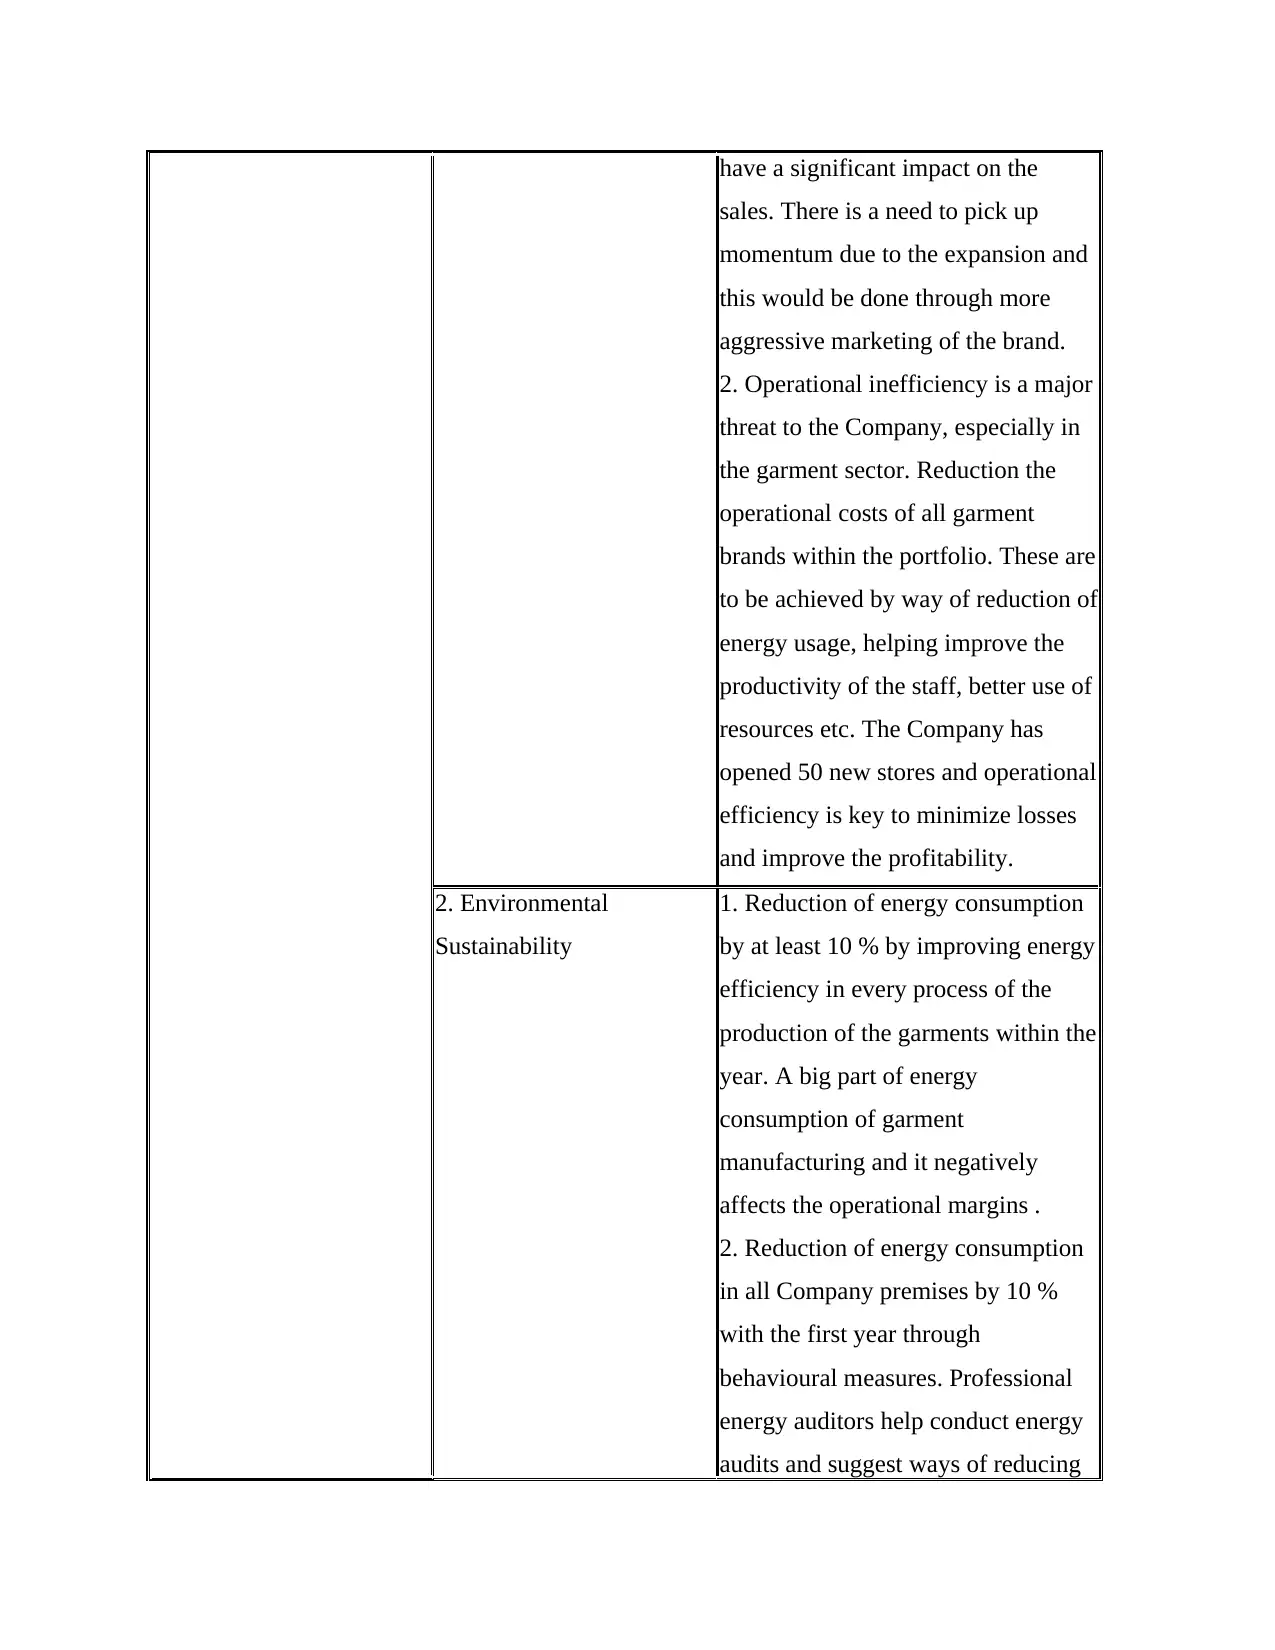
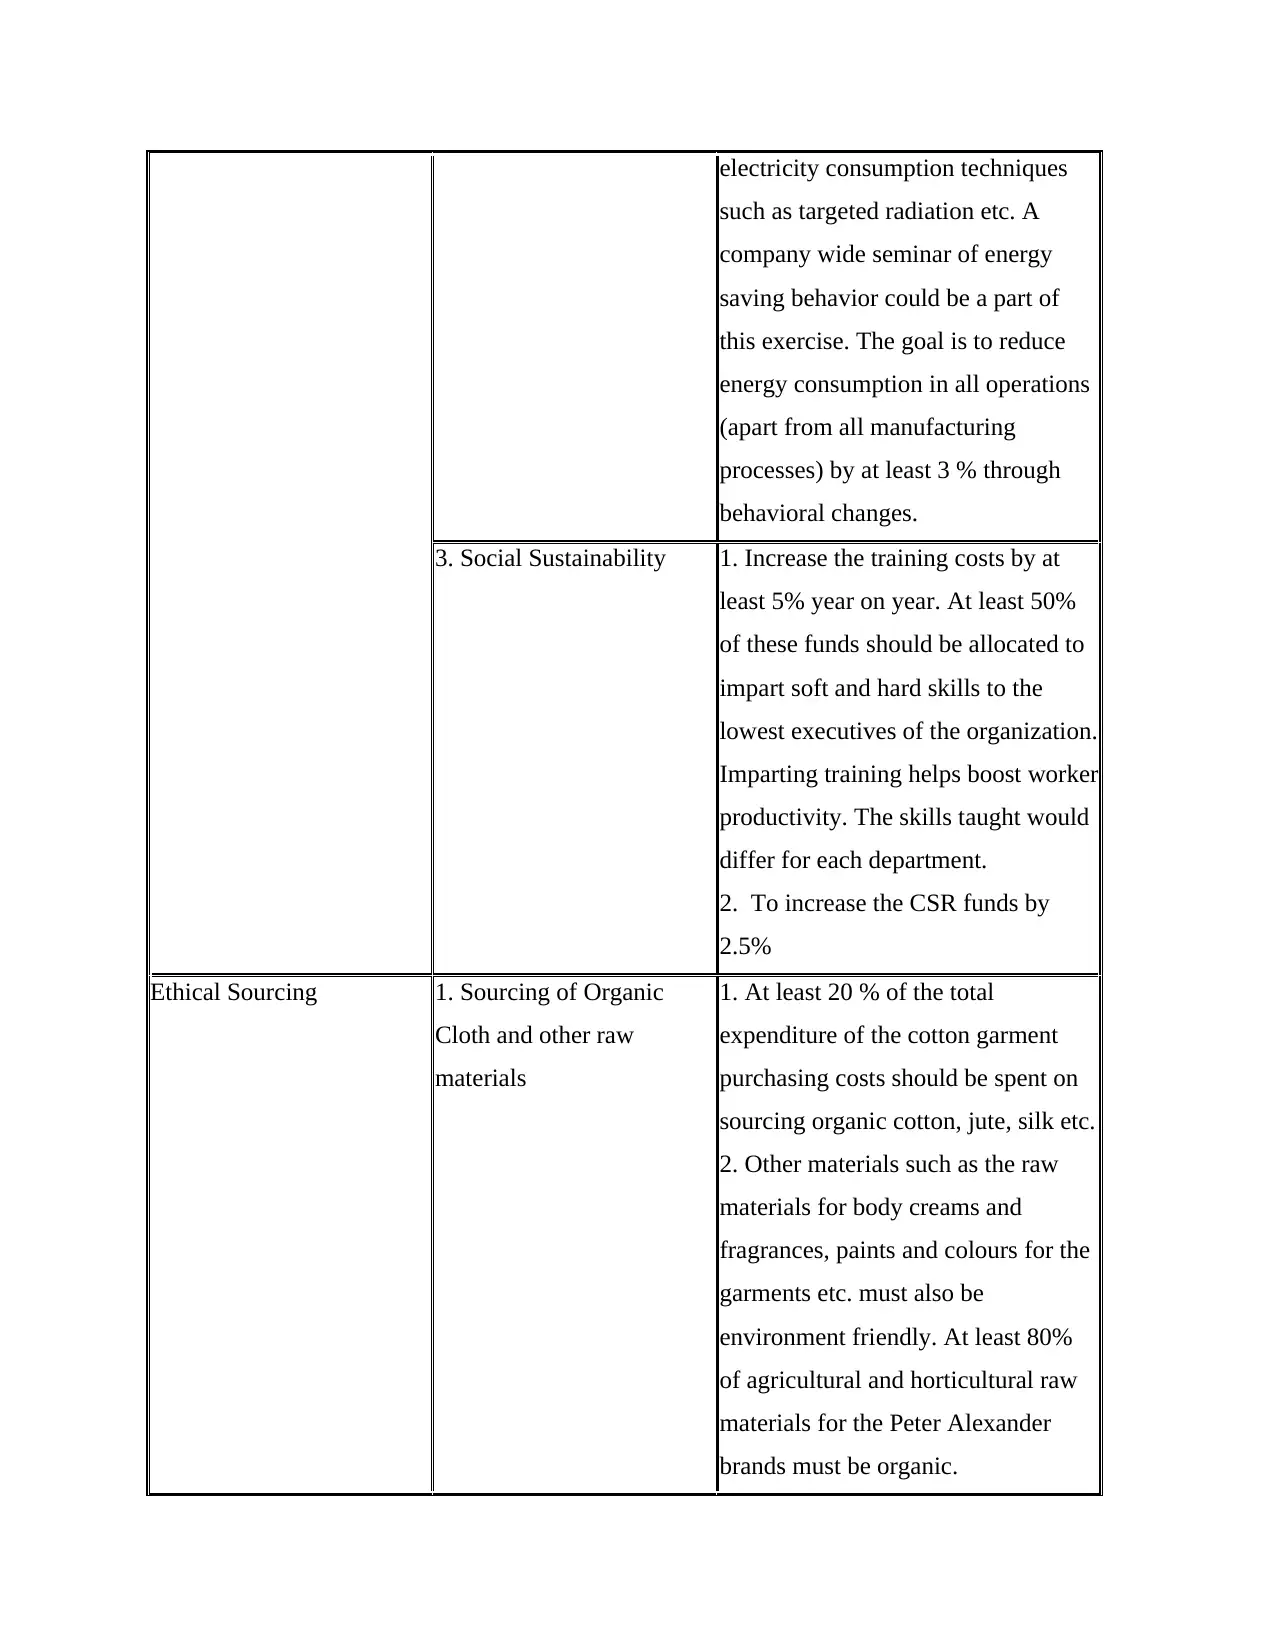
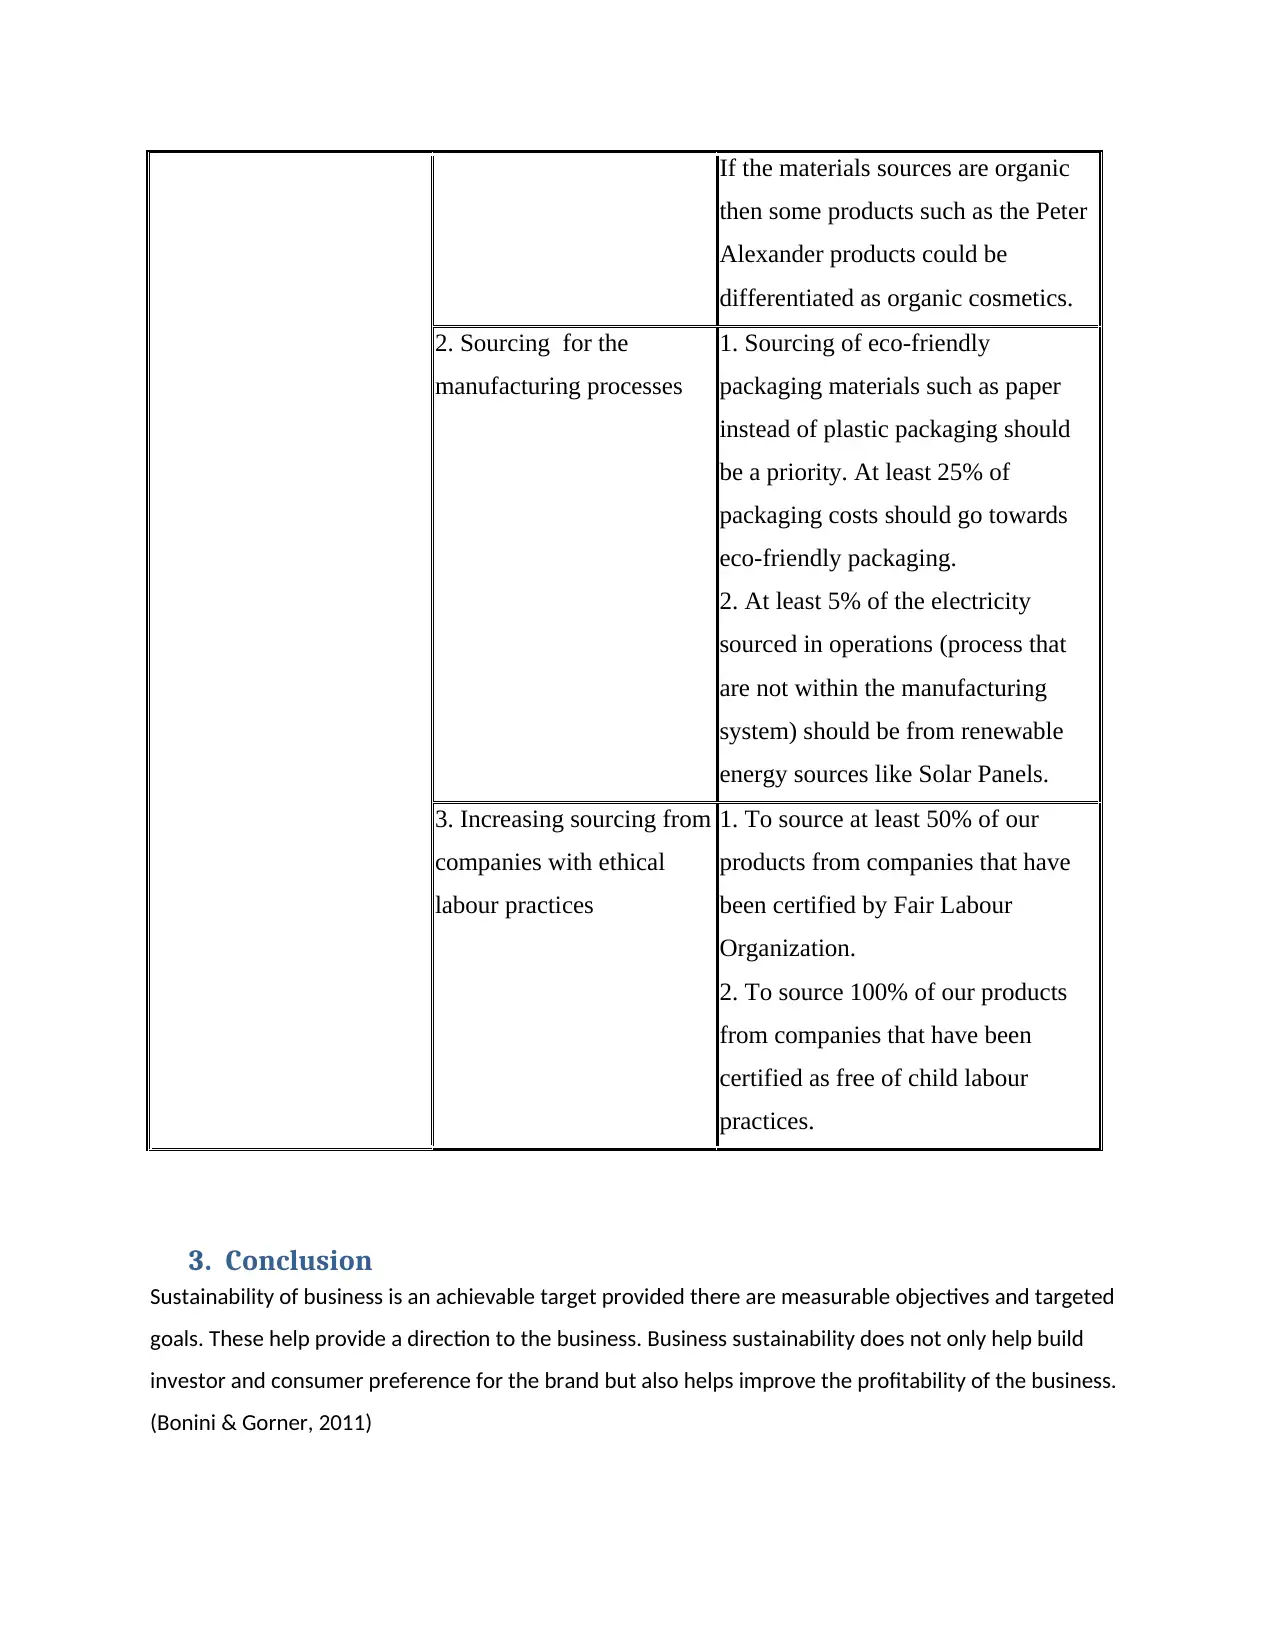
This report provides a comprehensive analysis of business sustainability for Premier Investments, focusing on financial, environmental, and social aspects. It explores key recommendations for improving revenue, reducing operational costs, and enhancing energy efficiency. The report also emphasizes the importance of ethical sourcing, including organic materials and eco-friendly packaging. Furthermore, it includes a transfer pricing analysis and capital investment analysis, detailing revenue projections, cost breakdowns, and financial metrics like Net Present Value (NPV) and Internal Rate of Return (IRR). The findings highlight the significance of measurable objectives and targeted goals in achieving business sustainability, ultimately contributing to investor and consumer preference and improved profitability. The report is divided into three parts: business sustainability, transfer pricing and capital investment analysis.
tabler-icon-diamond-filled.svg

Contribute Materials

Your contribution can guide someone’s learning journey. Share your documents today.
Document Page
Premier Investments
A Report on Business Sustainability For Premier Investments
[Type the document subtitle]
ABC
01/01/2017
tabler-icon-diamond-filled.svg

Secure Best Marks with AI Grader

Need help grading? Try our AI Grader for instant feedback on your assignments.
Document Page
Table of Contents
1. Introduction.........................................................................................................................................2
2. Recommendation for Business Sustainability of Premier Investments................................................2
3. Conclusion...........................................................................................................................................5
Table 1: Business Sustainability : Key Recommendations............................................................................3
Document Page
Executive Summary
Business Sustainability rests of three important pillars : financial soundness, environmental sustainability
and an organization’s responsibility towards people, in side the organization and outside. This report
seeks to highlight the importance of business sustainability for better business management of Premier
Investments. The report makes some key recommendations towards achieving business sustainability of
Premier Investments. Some of these measures include efforts to reduce energy consumption, efforts
towards ethical sourcing and financial sustainability by seeking better financial bottom lines and cost
cutting.
Document Page
Part 1: Report on Business Sustainability
for Premier Investments
1. Introduction
Premier Investments is not only looking at managing its operations in such a way that they are
financially sustainable but must also seeks to reduce its negative impact on the society and improve its
positive impact. Premier Investments aims at strengthening its bond with its customers by way of
impacting the society. (Bonini & Gorner, 2011)
Business sustainability largely encompasses three key aspects or “Triple Bottom Line” a term coined by
John Elkington in 1994. (Hindle, 2009)
Financial: The economics of the firm should fall in line in such a way that investors continue to
see the as a good investment and re-invest. (Friedman, 2012) Reduction of Costs is one the key
goals of remaining financially sustainable while taking advantage of every opportunity in the
market. (Friedman, 2012)
Environmental: This aspect includes creating an environmentally sustainable value chain. The
environmental aspect may relate to reducing the carbon footprint of all processes in the value
chain, making efforts to source environmentally sustainable products etc.
Social: The social aspect relates to the impact that the Company has on the society. Social
sustainability starts with creating a better environment for the employees and can be extended
to having a positive impact on the different members of the society that come in touch with the
business.
2. Recommendation for Business Sustainability of Premier
Investments
Table 1: Business Sustainability: Key Recommendations
Dimension Objective Possible Performance Measures
Business Sustainability 1. Financial Sustainability 1. Improving the revenues of the
Peter Alexander, at least 5%. The
expansion of the brand is likely to
tabler-icon-diamond-filled.svg

Secure Best Marks with AI Grader

Need help grading? Try our AI Grader for instant feedback on your assignments.
Document Page
have a significant impact on the
sales. There is a need to pick up
momentum due to the expansion and
this would be done through more
aggressive marketing of the brand.
2. Operational inefficiency is a major
threat to the Company, especially in
the garment sector. Reduction the
operational costs of all garment
brands within the portfolio. These are
to be achieved by way of reduction of
energy usage, helping improve the
productivity of the staff, better use of
resources etc. The Company has
opened 50 new stores and operational
efficiency is key to minimize losses
and improve the profitability.
2. Environmental
Sustainability
1. Reduction of energy consumption
by at least 10 % by improving energy
efficiency in every process of the
production of the garments within the
year. A big part of energy
consumption of garment
manufacturing and it negatively
affects the operational margins .
2. Reduction of energy consumption
in all Company premises by 10 %
with the first year through
behavioural measures. Professional
energy auditors help conduct energy
audits and suggest ways of reducing
Document Page
electricity consumption techniques
such as targeted radiation etc. A
company wide seminar of energy
saving behavior could be a part of
this exercise. The goal is to reduce
energy consumption in all operations
(apart from all manufacturing
processes) by at least 3 % through
behavioral changes.
3. Social Sustainability 1. Increase the training costs by at
least 5% year on year. At least 50%
of these funds should be allocated to
impart soft and hard skills to the
lowest executives of the organization.
Imparting training helps boost worker
productivity. The skills taught would
differ for each department.
2. To increase the CSR funds by
2.5%
Ethical Sourcing 1. Sourcing of Organic
Cloth and other raw
materials
1. At least 20 % of the total
expenditure of the cotton garment
purchasing costs should be spent on
sourcing organic cotton, jute, silk etc.
2. Other materials such as the raw
materials for body creams and
fragrances, paints and colours for the
garments etc. must also be
environment friendly. At least 80%
of agricultural and horticultural raw
materials for the Peter Alexander
brands must be organic.
Document Page
If the materials sources are organic
then some products such as the Peter
Alexander products could be
differentiated as organic cosmetics.
2. Sourcing for the
manufacturing processes
1. Sourcing of eco-friendly
packaging materials such as paper
instead of plastic packaging should
be a priority. At least 25% of
packaging costs should go towards
eco-friendly packaging.
2. At least 5% of the electricity
sourced in operations (process that
are not within the manufacturing
system) should be from renewable
energy sources like Solar Panels.
3. Increasing sourcing from
companies with ethical
labour practices
1. To source at least 50% of our
products from companies that have
been certified by Fair Labour
Organization.
2. To source 100% of our products
from companies that have been
certified as free of child labour
practices.
3. Conclusion
Sustainability of business is an achievable target provided there are measurable objectives and targeted
goals. These help provide a direction to the business. Business sustainability does not only help build
investor and consumer preference for the brand but also helps improve the profitability of the business.
(Bonini & Gorner, 2011)
tabler-icon-diamond-filled.svg

Paraphrase This Document

Need a fresh take? Get an instant paraphrase of this document with our AI Paraphraser
Document Page
Bibliography
Bonini, S., & Gorner, S. (2011). The Business of Sustainability: Putting It into Practice. San Francisco:
McKinsey & company.
Friedman, J. (2012, 06 11). 6 Business Benefits of Sustainability. Retrieved Spetember 16, 2017, from
HuffPost: https://huffpost.com/us/entry/1576400
Hindle, T. (2009, November 17). Triple Bottom Line. Retrieved Spetember 16, 2017, from The Economist.
Document Page
Part 2 Transfer Pricing
Document Page
Q1) I do not agree with this statement. Assigning a transfer price may not decrease the
profitability of the business it does not increase the amount of resources being used. It
simply assigns a value.
Using a transfer price allows the Company to understand the correct profit and
loss values better. If the Shea butter is going to be used in a fragrance, the correct
cost of the fragrance could not be calculated if the cost of acquiring butter may
not be taken into account. In addition, the firm may end up under-pricing its final
product, the fragrance, if it does not take into account all the costs..,
Similarly, the Butter department would not be able to calculate its profit and loss
completely if the price of inter departmental trade of Shea Butter is not accounted
for.
Q2) The managers of the two divisions have negotiated the price. In such a situation, it is
highly unlikely that the Shea Butter production department would be able to charge the full
market price of $40 to the mixing department. This method of negotiation would not be
appropriate since a competitive market for Shea butter already exists. In such a situation, a
negotiated price, which would be less than the market price, would imply that there would be
an opportunity cost for Shea butter that would be unaccounted for. It would be appropriate
only if the Shea Butter Department is selling in distress. Generally, such a situation would
occur if there is excess inventory and for some reason the department does not expect enough
demand for the butter.
Assuming that the Shea butter department expects some excess capacity but a robust demand
and does not need to necessarily incur losses, it could use the following pricing method
Variable Cost Pricing
Assuming that the Shea butter department has an excess production to a great extent and
seeks to minimize its losses, it can seek to recover just the variable costs i.e the costs of direct
materials, direct labour and the variable factory overhead.
Direct Materials $10.00
Direct Labour $5.00
Variable Overhead $3.00
Total $18.00
tabler-icon-diamond-filled.svg

Secure Best Marks with AI Grader

Need help grading? Try our AI Grader for instant feedback on your assignments.
Document Page
The total cost for the Mixing Department in this case would be $18 per kg multiplied by the
total amount of Shea Butter being transferred in Kilograms.
Actual Full Cost
The Butter Department could simply transfer the butter at the actual cost of production I,e.
Direct Materials $10.00
Direct Labour $5.00
Variable Overhead $3.00
Fixed Costs $1.00
Full Costs $19.00
Cost Plus Method: In the Cost plus method, the Shea butter department to simply assign a
gross profit margin per kg of butter or a gross profit margin for the cost of the total butter
being transferred and add that to the cost of profit. For example, the Shea Butter
Department assigns a Gross Profit Margin of $3 per kg of butter.
The total price would be:
Total production costs per kg = $19
Gross Profit Margin per kg = $3
Cost per kg of butter sold = $22
Alternatively, the Company could choose to assign a gross profit margin of $40 for 10 kgs of butter
transferred:
Total Cost of Shea Butter 10 x $19 = $190
Total Gross Margin = $ 40
Total Price for 10 kgs Shea Butter = $230
The general transfer price rule is if there is a competitive market, then the transfer price should be at
market price, if there is excessive production capacity, price should be negotiated. (Schuster, 2015) The
difference between the market price is the opportunity cost and the difference between the full market
price and the negotiated price is the loss of opportunity for the Company i.e it is a reflection of the
inefficiency of the Company in production of Shea Butter.
Document Page
Document Page
Part 3 Capital Investment Analysis
Table 1: Business Sustainability: Key Recommendations............................................................................3
Table 1 Revenues Generated (Government of Commonwealth of Australia, 2006)..................................13
Table 2 Costs of Good Sold and Profit After Tax........................................................................................13
Table 3 Total Cash Flows After Tax (Revenues – Costs + Derpreciation)....................................................13
Table 4T otal Net Present Value and IRR...................................................................................................14
Table 5 Payback Period..............................................................................................................................15
Table 6 Accounting Rate of Return............................................................................................................15
tabler-icon-diamond-filled.svg

Paraphrase This Document

Need a fresh take? Get an instant paraphrase of this document with our AI Paraphraser
Document Page
Table 2 Revenues Generated (Government of Commonwealth of Australia, 2006)
Year Revenues from
Sales of Jeans (in $)
Revenue from
Customization
Services (in $)
Total Revenues (in $)
1 55000 1225000 1280000
2 616000 1347500 1963500
3 689920 1482250 2172170
4 772710.4 1630475 2403185.4
5 865435.65 1793505 2658940.65
6 969287.93 1972845 2942132.93
7 1805602.48 2170140 3975742.48
Table 3 Costs of Good Sold and Profit After Tax
Year Costs of
Customization
Sold(in $)
(A)
Depreciation of
Investment
every year (in
$) (B)
Total Costs of
Producing
Jeans (in $)
(c)
Total Costs of
Goods Sold
(in $)
A)+B)+C)
Profits
Revenues –
Costs of
Goods Sold
1 1181000 235714 33000 1449714.285 -
169714.285
2 12586000 235714 369600 1863914.285
99585.7150
3 1326971.6 235714 413952 1976637.885
195532.115
4 1406589.9 235714 463626.24 2105930.425
297254.975
5 1490985.29 235714 519261.39 2245960.965
412979.685
6 1580444.41 235714 581572.758 2397731.453
544401.477
7 1675271.07 235714 1083361.488 2994346.843
981395.637
Document Page
Table 4 Total Cash Flows After Tax (Revenues – Costs + Depreciation)
Total Cash Flows After Tax are useful in calculating Net Present Value and are taken as
Year Total Revenues Total Costs Without
Depreciation
Total Cash Flows Total Cash
Flows After
Tax
Profit After
Tax (in $)
Profits –
30% Profits
1 1280000 1214000 66000 46200 -169714.285
2 1963500 495460 1468040 1027628 862628.0005
3 2172170 1740923.6 431246.4 301872.48 136872.4805
4 2403185.4 1870216.14 532969.26 373078.482 208078.4825
5 2658940.65 2010246.68 648693.97 454085.779 289085.7795
6 2942132.93 2162017.168 780115.762 546081.0334 381081.0339
7 3975742.48 2758632.558 1217109.922 851976.9454 686976.9459
Table 5 Total Net Present Value and Internal Return Rate
In order to calculate this, I took the value of investment less the cumulative depreciation at the end of
every period as the initial investment and used the Net Present Value Formula to the Total Cash Flows +
Initial Investment. After Tax (Seigel & Shim, 2000), in the corresponding year, in MSExcel. The Internal
Rate of Return was calculated from a series of trial and error to observe at which percentage does the
value of NPV come the nearest to zero. This is the discount rate.
Year Net Present Value
(NPV)
Internal Return
Rate
1 $87,075.63 2%
2 $102,916.81 3%
3 $108,560.71 4%
4 $114,544.41 5%
5 $121,351.75 6%
6 $129,082.44 7%
Document Page
7 $154,787.98 8%
Table 6: Payback Period
Basic payback period is used here. Discounted Payback Period is not used
Year The Initial Investment After
Depreciated value
Total Revenues
1 1,650,000 1280000
2 1,414,285.71 1963500
3 942857.14 2172170
4 707142.857 2403185
5 471428.571 2658940
6 235714 2942132
7 942857.14 3975742
In year 6, the cash flow exceeds the remaining investment to be paid off. Hence, the payback period os
5 years.
Table 7: Accounting Rate of Return
Accounting Rate of Return (ARR)was calculated as ((Net Profit/ 7 years) / Initial Investment) X100(Seigel
& Shim, 2000)
Year Total Revenues Total Costs of Jeans (in $)
1 1280000 1449714.285
2 1963500 1863914.285
3 2172170 1976637.885
4 2403185 2105930.425
5 2658940 2245960.965
6 2942132 2397731.453
7 3975742 2994346.843
tabler-icon-diamond-filled.svg

Secure Best Marks with AI Grader

Need help grading? Try our AI Grader for instant feedback on your assignments.
Document Page
Total 17395669 9919862.27
Average 2485095 1985927
ARR = 20.44
Q2)
Just Jeans may have to consider the energy used per unit and try to reduce it. Custom
Jeans imply that each pair of Jeans will be treated individually or would be treated with a
small number of jeans . This could possibly lead to an increase in energy use and the
Company must try to keep it’s energy footprint to the minimum. (Bonini & Gorner, 2011)
The Company could also consider ecologically sensitive materials, organic materials, eco
friendly paints etc. The Company could market these as a level of customization to the
product i.e these could be included as customised options by the Company.
Q3) The Net Present Value is negative. The Investment may make profits but it does not
fulfill the criteria of 16% Required Rate of Return since Net Present Value is negative.
The IRR is not a great indicator in this case. This recommendation is highly based in the
investment analysis. The strategy should be to reduce investments in garment brands at
this stage and seek greater operation efficiency.
Bibliography
overnment of Commonwealth of Australia. (2006). Introduction to Cost Benefit Analysis and Alternative
Evaluation Methodologies : Financial Management Reference Material. Canberra: Commonwealth of
Australia.
Schuster, P. (2015). Transfer Prices and Management Accounting. Springer.
Seigel, J. G., & Shim, J. K. (2000). Accounting Handbook. New York: Barron's education Series.
chevron_up_icon
1 out of 17
circle_padding
hide_on_mobile
zoom_out_icon
logo.png

Your All-in-One AI-Powered Toolkit for Academic Success.

Available 24*7 on WhatsApp / Email

[object Object]