Business Decision Making: Impact of Tech on Retail, Report, College
VerifiedAdded on 2020/12/09
|21
|4622
|154
Report
AI Summary
This report provides a comprehensive analysis of business decision-making processes, focusing on the impact of technological innovations and multichannel purchasing on high street shops and malls. The report begins with an introduction to business decisions and their significance, followed by a detailed plan for effective data collection from students across various campuses, utilizing both primary and secondary research methods, including questionnaires and interviews. The research methodology encompasses descriptive, quantitative, and qualitative approaches, along with sampling techniques. The analysis includes representative values, statistical tools, and graphical representations of the collected data. Furthermore, the report explores the benefits of software-generated information systems, network diagrams, critical paths, and investment appraisal techniques. The findings reveal consumer behavior patterns, preferences for online shopping, and factors influencing purchasing decisions, providing valuable insights into the evolving retail landscape. The report concludes with a summary of key findings and recommendations for businesses adapting to technological advancements and changing consumer behaviors.

BUSINESS
DECISION
MAKING
DECISION
MAKING
Paraphrase This Document
Need a fresh take? Get an instant paraphrase of this document with our AI Paraphraser
Table of Contents
INTRODUCTION...........................................................................................................................1
TASK 1............................................................................................................................................1
1.1: Creating a plan for effective data collection from students across various campuses:........1
1.2 Research Methodologies:......................................................................................................2
1.3 Framing Questionnaire..........................................................................................................3
TASK 2:...........................................................................................................................................5
2.1 Analysing the data collected with the help of representative values.....................................5
2.2 Analysing outcomes of the survey to get a reliable conclusion............................................7
2.3 Interpretation of data using measure of dispersion...............................................................8
2.4 Use of Statistical tools for reliable inference of data............................................................8
TASK 3............................................................................................................................................9
3.1 Graphical representation and interpretation..........................................................................9
3.2 Trend Analysis....................................................................................................................12
3.3: Covered in Poster...............................................................................................................13
3.4: Formal Report:...................................................................................................................13
TASK 4:.........................................................................................................................................14
4.1 Benefits of using software generated information systems in business:.............................14
4.2 Network Diagram and Critical Path:...................................................................................14
4.3 Investment appraisal techniques:........................................................................................16
CONCLUSION..............................................................................................................................17
REFERENCES..............................................................................................................................18
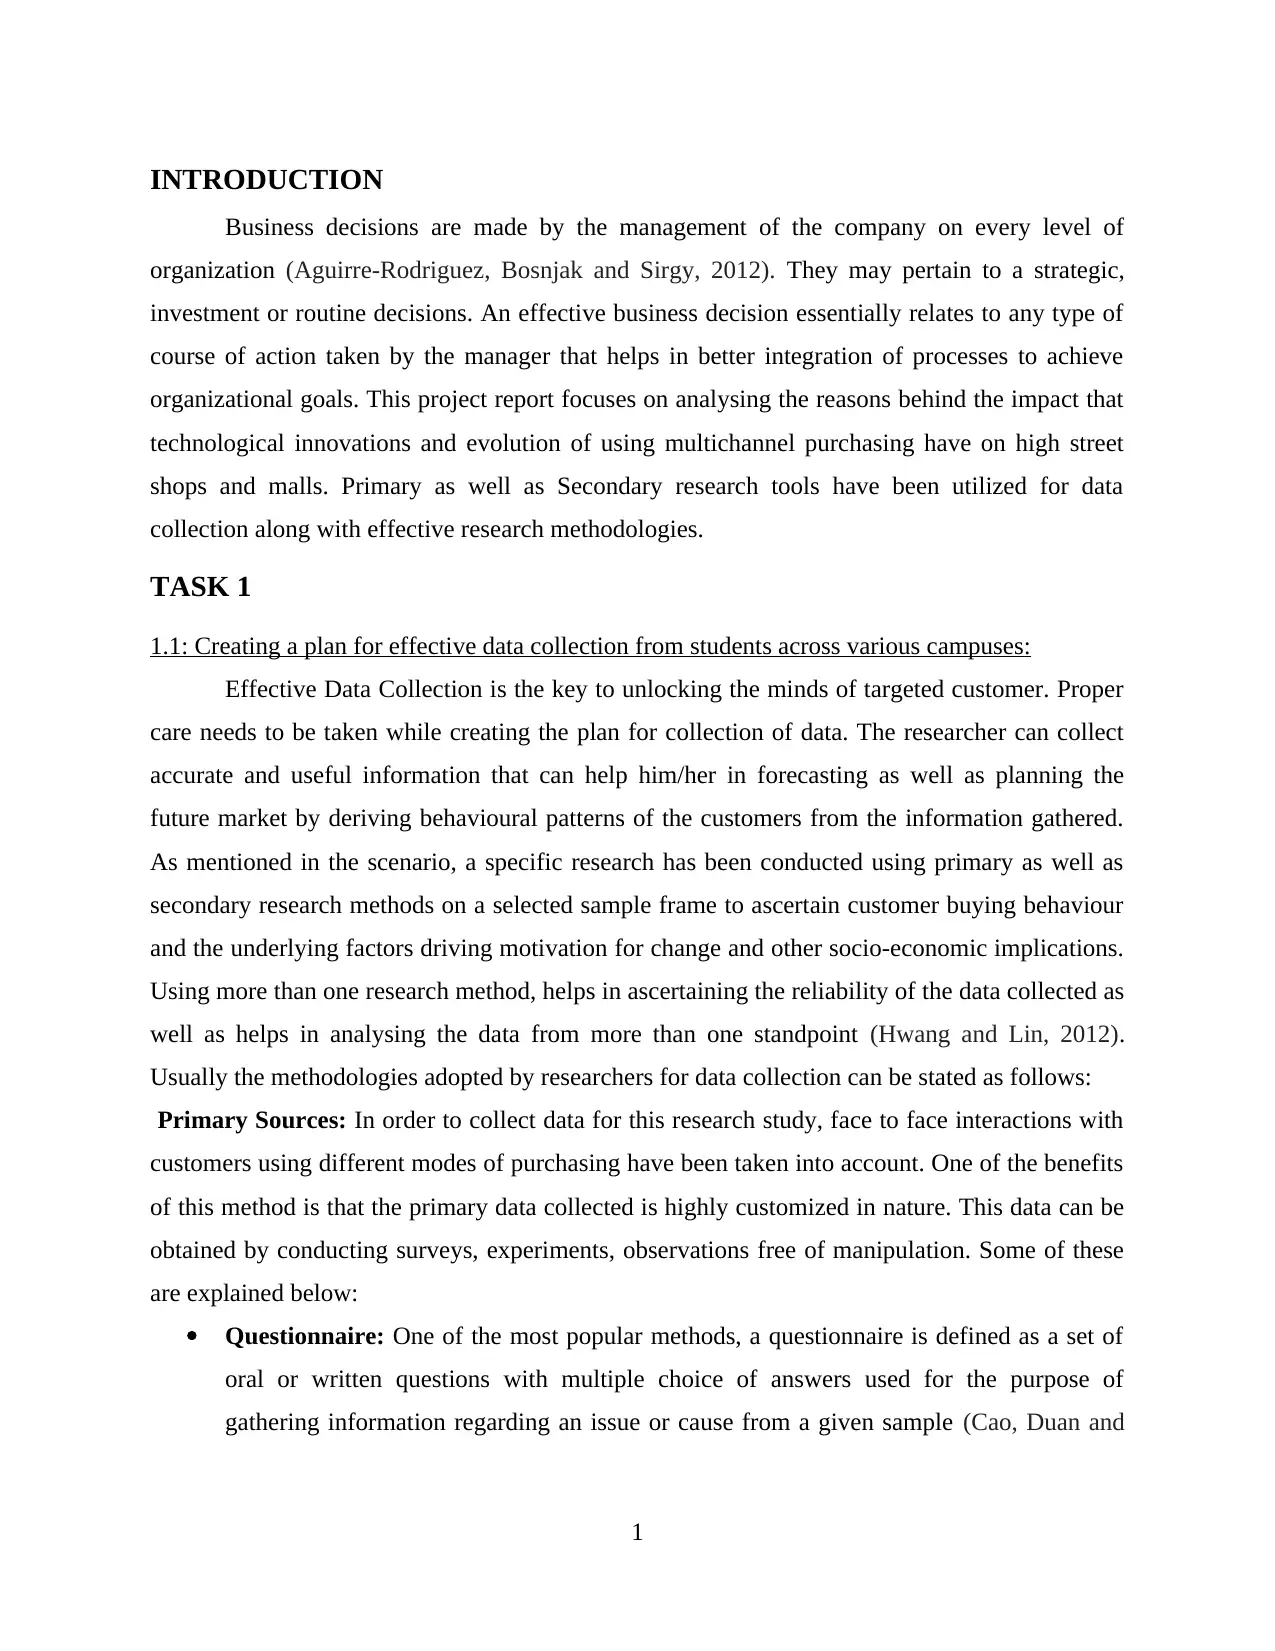
INTRODUCTION
Business decisions are made by the management of the company on every level of
organization (Aguirre-Rodriguez, Bosnjak and Sirgy, 2012). They may pertain to a strategic,
investment or routine decisions. An effective business decision essentially relates to any type of
course of action taken by the manager that helps in better integration of processes to achieve
organizational goals. This project report focuses on analysing the reasons behind the impact that
technological innovations and evolution of using multichannel purchasing have on high street
shops and malls. Primary as well as Secondary research tools have been utilized for data
collection along with effective research methodologies.
TASK 1
1.1: Creating a plan for effective data collection from students across various campuses:
Effective Data Collection is the key to unlocking the minds of targeted customer. Proper
care needs to be taken while creating the plan for collection of data. The researcher can collect
accurate and useful information that can help him/her in forecasting as well as planning the
future market by deriving behavioural patterns of the customers from the information gathered.
As mentioned in the scenario, a specific research has been conducted using primary as well as
secondary research methods on a selected sample frame to ascertain customer buying behaviour
and the underlying factors driving motivation for change and other socio-economic implications.
Using more than one research method, helps in ascertaining the reliability of the data collected as
well as helps in analysing the data from more than one standpoint (Hwang and Lin, 2012).
Usually the methodologies adopted by researchers for data collection can be stated as follows:
Primary Sources: In order to collect data for this research study, face to face interactions with
customers using different modes of purchasing have been taken into account. One of the benefits
of this method is that the primary data collected is highly customized in nature. This data can be
obtained by conducting surveys, experiments, observations free of manipulation. Some of these
are explained below:
Questionnaire: One of the most popular methods, a questionnaire is defined as a set of
oral or written questions with multiple choice of answers used for the purpose of
gathering information regarding an issue or cause from a given sample (Cao, Duan and
1
⊘ This is a preview!⊘
Do you want full access?
Subscribe today to unlock all pages.
Trusted by 1+ million students worldwide
Li, 2015). It should be concise and easy to understand. Questionnaires are convenient as
well as can be used for large samples.
Interviews: This method is based on a person asking questions to the samples to gather
data. Interviews are more open ended in comparison to Questionnaires and an in-depth
information can be obtained through this method. Confusions can be avoided in this type
of method and more clarity is obtained on the part of respondents.
Internet Communication: This method involves collecting data by means of internet
mediums such as emails, blogs and social media platforms. It is a faster and personal way
of data collection.
Secondary Sources: The secondary data is the data that has been already present in the market
in the form of magazines, journals and numerical data. Secondary Data can be used by the
researchers for purpose of reference and complementing their current research. These help in
gathering past trends and analysing results obtained when a similar research was carried out by
someone else previously (Barry and Edgman-Levitan, 2012).
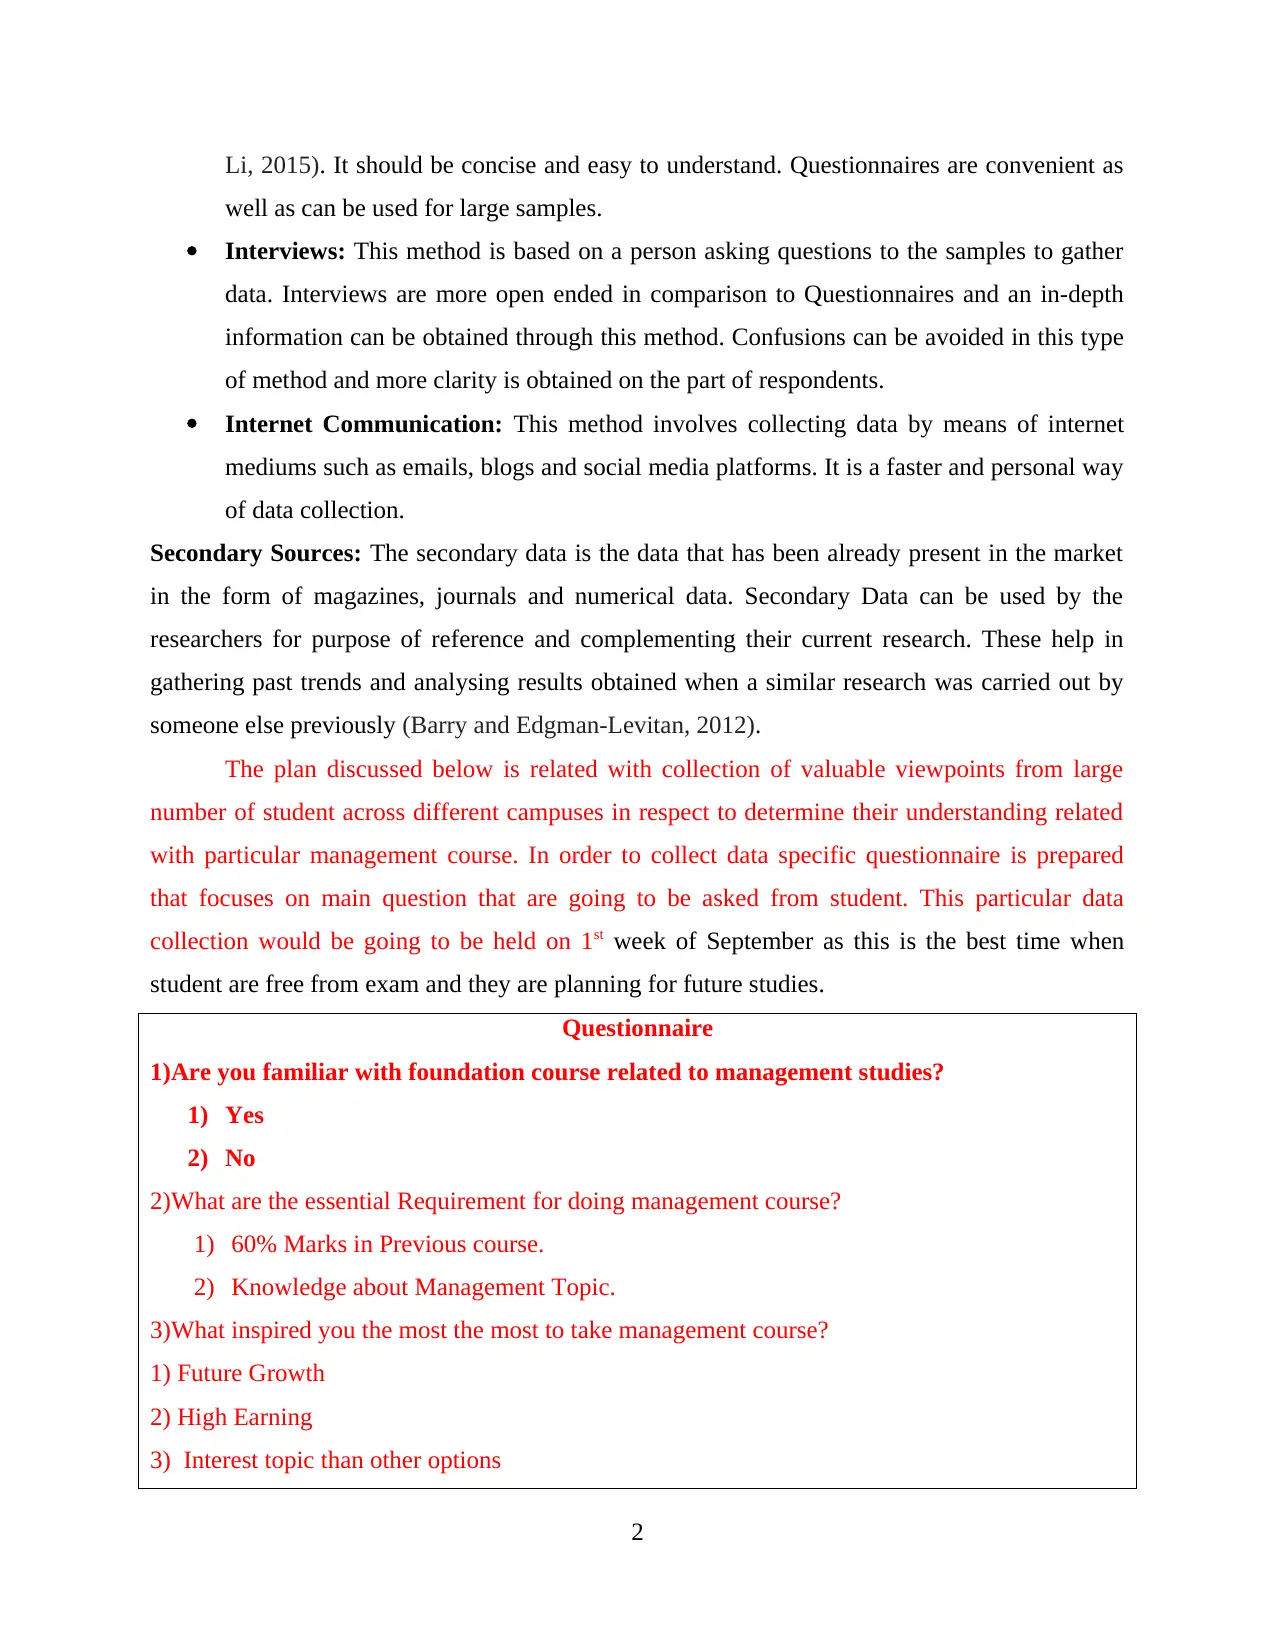
The plan discussed below is related with collection of valuable viewpoints from large
number of student across different campuses in respect to determine their understanding related
with particular management course. In order to collect data specific questionnaire is prepared
that focuses on main question that are going to be asked from student. This particular data
collection would be going to be held on 1st week of September as this is the best time when
student are free from exam and they are planning for future studies.
Questionnaire
1)Are you familiar with foundation course related to management studies?
1) Yes
2) No
2)What are the essential Requirement for doing management course?
1) 60% Marks in Previous course.
2) Knowledge about Management Topic.
3)What inspired you the most the most to take management course?
1) Future Growth
2) High Earning
3) Interest topic than other options
2
well as can be used for large samples.
Interviews: This method is based on a person asking questions to the samples to gather
data. Interviews are more open ended in comparison to Questionnaires and an in-depth
information can be obtained through this method. Confusions can be avoided in this type
of method and more clarity is obtained on the part of respondents.
Internet Communication: This method involves collecting data by means of internet
mediums such as emails, blogs and social media platforms. It is a faster and personal way
of data collection.
Secondary Sources: The secondary data is the data that has been already present in the market
in the form of magazines, journals and numerical data. Secondary Data can be used by the
researchers for purpose of reference and complementing their current research. These help in
gathering past trends and analysing results obtained when a similar research was carried out by
someone else previously (Barry and Edgman-Levitan, 2012).
The plan discussed below is related with collection of valuable viewpoints from large
number of student across different campuses in respect to determine their understanding related
with particular management course. In order to collect data specific questionnaire is prepared
that focuses on main question that are going to be asked from student. This particular data
collection would be going to be held on 1st week of September as this is the best time when
student are free from exam and they are planning for future studies.
Questionnaire
1)Are you familiar with foundation course related to management studies?
1) Yes
2) No
2)What are the essential Requirement for doing management course?
1) 60% Marks in Previous course.
2) Knowledge about Management Topic.
3)What inspired you the most the most to take management course?
1) Future Growth
2) High Earning
3) Interest topic than other options
2
Paraphrase This Document
Need a fresh take? Get an instant paraphrase of this document with our AI Paraphraser
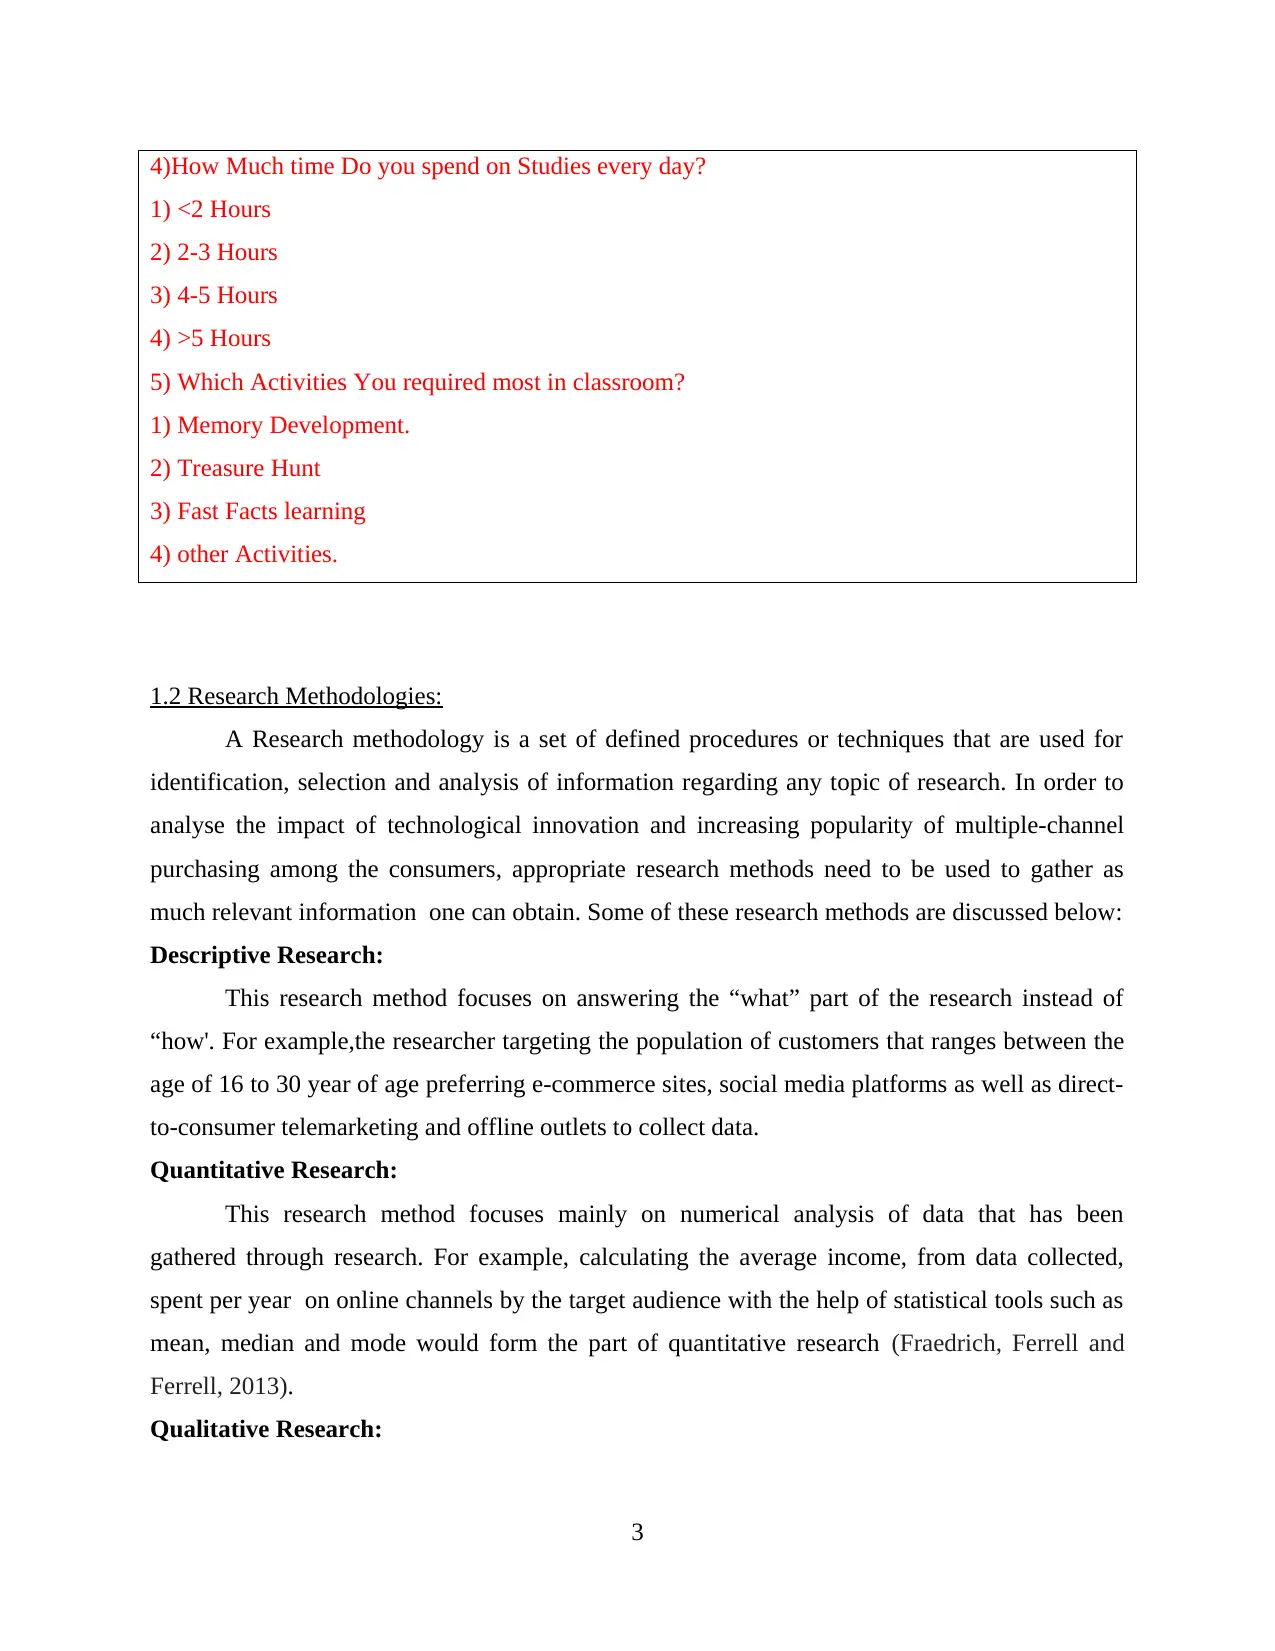
4)How Much time Do you spend on Studies every day?
1) <2 Hours
2) 2-3 Hours
3) 4-5 Hours
4) >5 Hours
5) Which Activities You required most in classroom?
1) Memory Development.
2) Treasure Hunt
3) Fast Facts learning
4) other Activities.
1.2 Research Methodologies:
A Research methodology is a set of defined procedures or techniques that are used for
identification, selection and analysis of information regarding any topic of research. In order to
analyse the impact of technological innovation and increasing popularity of multiple-channel
purchasing among the consumers, appropriate research methods need to be used to gather as
much relevant information one can obtain. Some of these research methods are discussed below:
Descriptive Research:
This research method focuses on answering the “what” part of the research instead of
“how'. For example,the researcher targeting the population of customers that ranges between the
age of 16 to 30 year of age preferring e-commerce sites, social media platforms as well as direct-
to-consumer telemarketing and offline outlets to collect data.
Quantitative Research:
This research method focuses mainly on numerical analysis of data that has been
gathered through research. For example, calculating the average income, from data collected,
spent per year on online channels by the target audience with the help of statistical tools such as
mean, median and mode would form the part of quantitative research (Fraedrich, Ferrell and
Ferrell, 2013).
Qualitative Research:
3
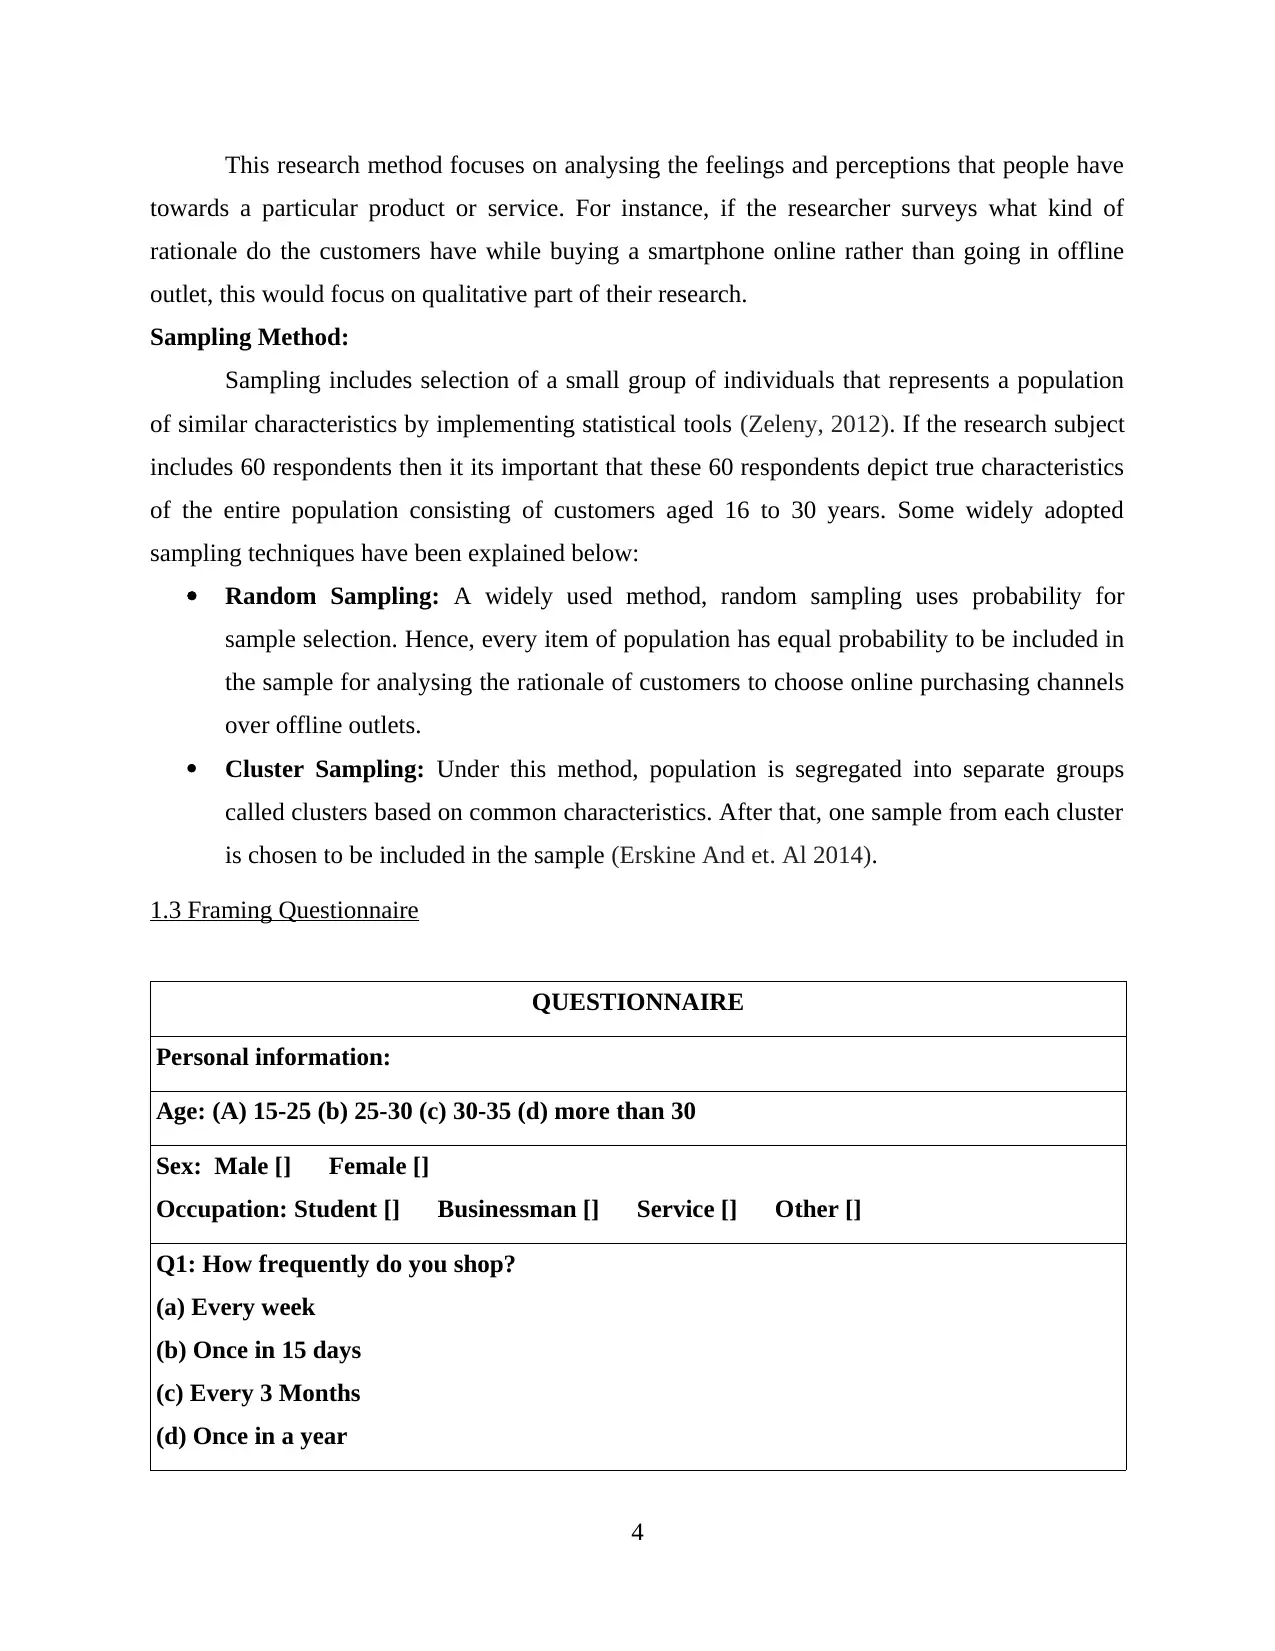
This research method focuses on analysing the feelings and perceptions that people have
towards a particular product or service. For instance, if the researcher surveys what kind of
rationale do the customers have while buying a smartphone online rather than going in offline
outlet, this would focus on qualitative part of their research.
Sampling Method:
Sampling includes selection of a small group of individuals that represents a population
of similar characteristics by implementing statistical tools (Zeleny, 2012). If the research subject
includes 60 respondents then it its important that these 60 respondents depict true characteristics
of the entire population consisting of customers aged 16 to 30 years. Some widely adopted
sampling techniques have been explained below:
Random Sampling: A widely used method, random sampling uses probability for
sample selection. Hence, every item of population has equal probability to be included in
the sample for analysing the rationale of customers to choose online purchasing channels
over offline outlets.
Cluster Sampling: Under this method, population is segregated into separate groups
called clusters based on common characteristics. After that, one sample from each cluster
is chosen to be included in the sample (Erskine And et. Al 2014).
1.3 Framing Questionnaire
QUESTIONNAIRE
Personal information:
Age: (A) 15-25 (b) 25-30 (c) 30-35 (d) more than 30
Sex: Male [] Female []
Occupation: Student [] Businessman [] Service [] Other []
Q1: How frequently do you shop?
(a) Every week
(b) Once in 15 days
(c) Every 3 Months
(d) Once in a year
4
⊘ This is a preview!⊘
Do you want full access?
Subscribe today to unlock all pages.
Trusted by 1+ million students worldwide
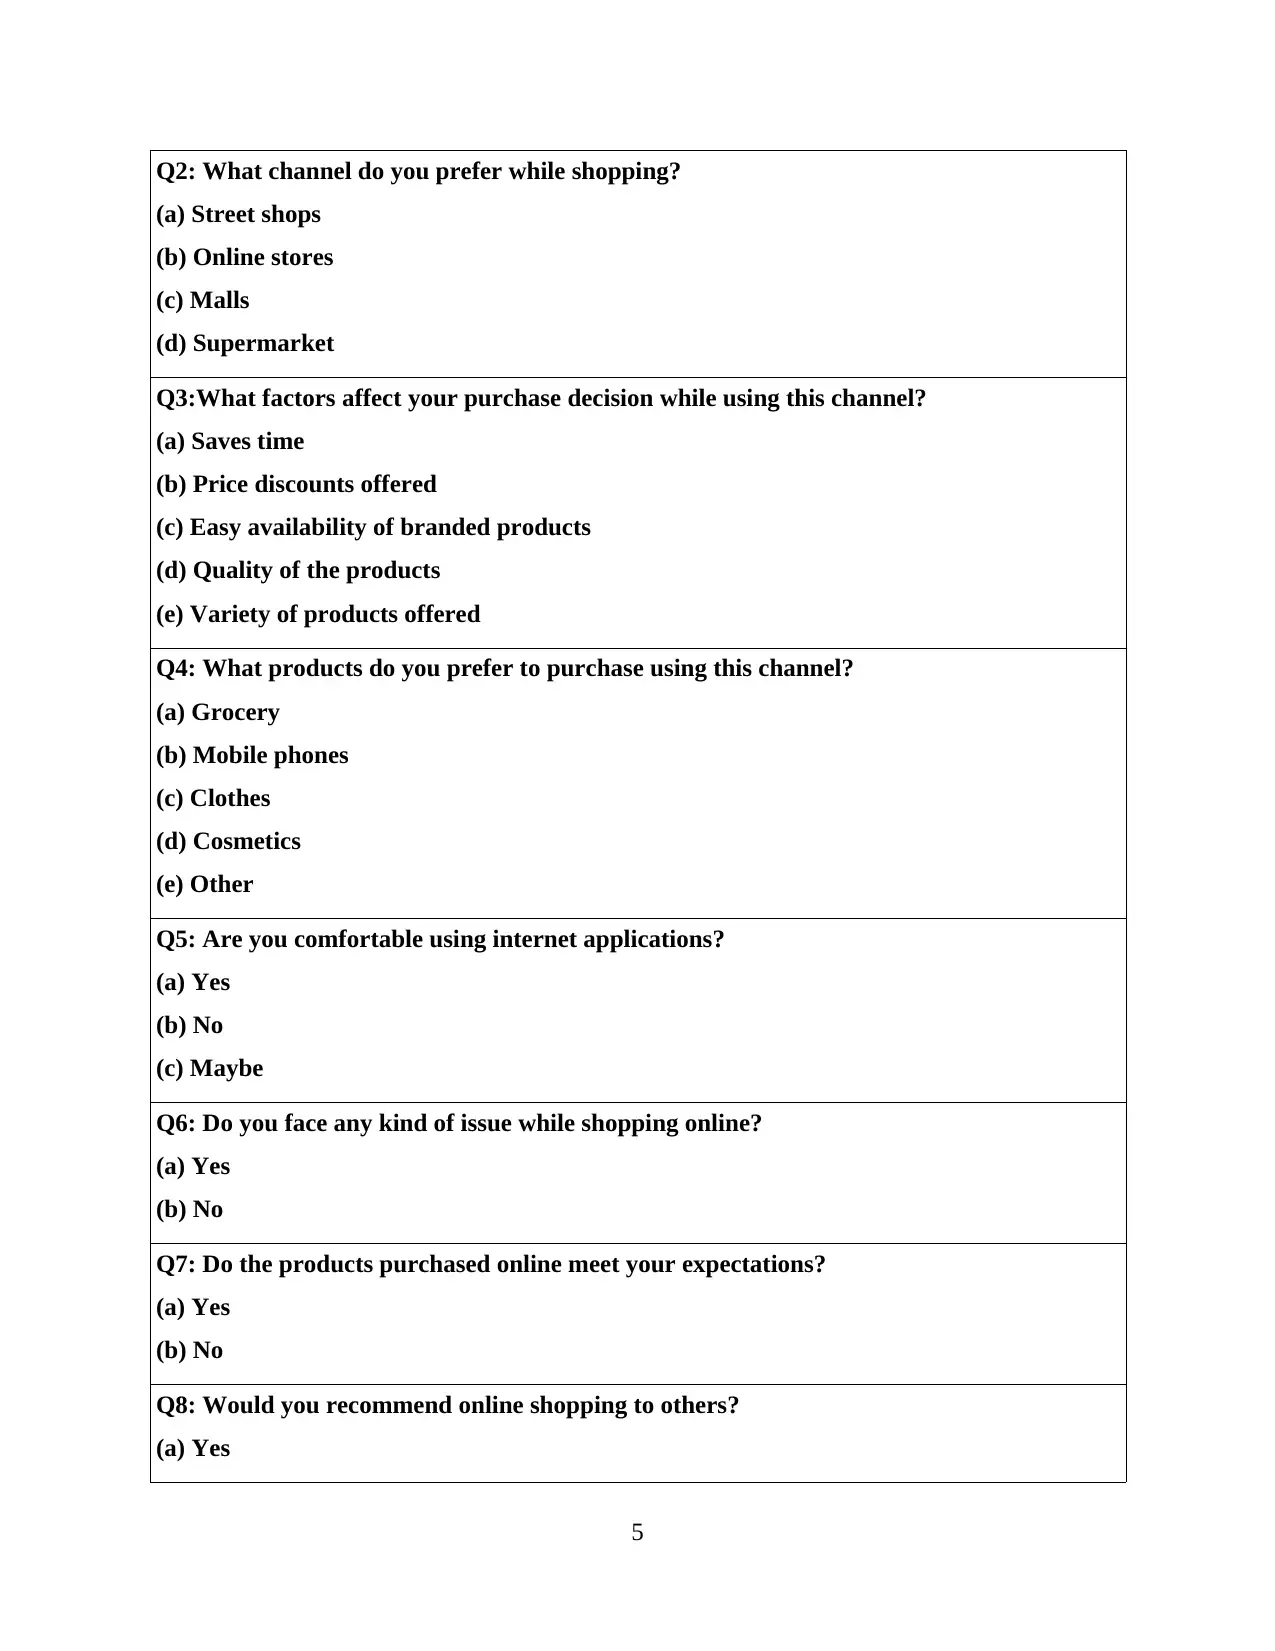
Q2: What channel do you prefer while shopping?
(a) Street shops
(b) Online stores
(c) Malls
(d) Supermarket
Q3:What factors affect your purchase decision while using this channel?
(a) Saves time
(b) Price discounts offered
(c) Easy availability of branded products
(d) Quality of the products
(e) Variety of products offered
Q4: What products do you prefer to purchase using this channel?
(a) Grocery
(b) Mobile phones
(c) Clothes
(d) Cosmetics
(e) Other
Q5: Are you comfortable using internet applications?
(a) Yes
(b) No
(c) Maybe
Q6: Do you face any kind of issue while shopping online?
(a) Yes
(b) No
Q7: Do the products purchased online meet your expectations?
(a) Yes
(b) No
Q8: Would you recommend online shopping to others?
(a) Yes
5
Paraphrase This Document
Need a fresh take? Get an instant paraphrase of this document with our AI Paraphraser
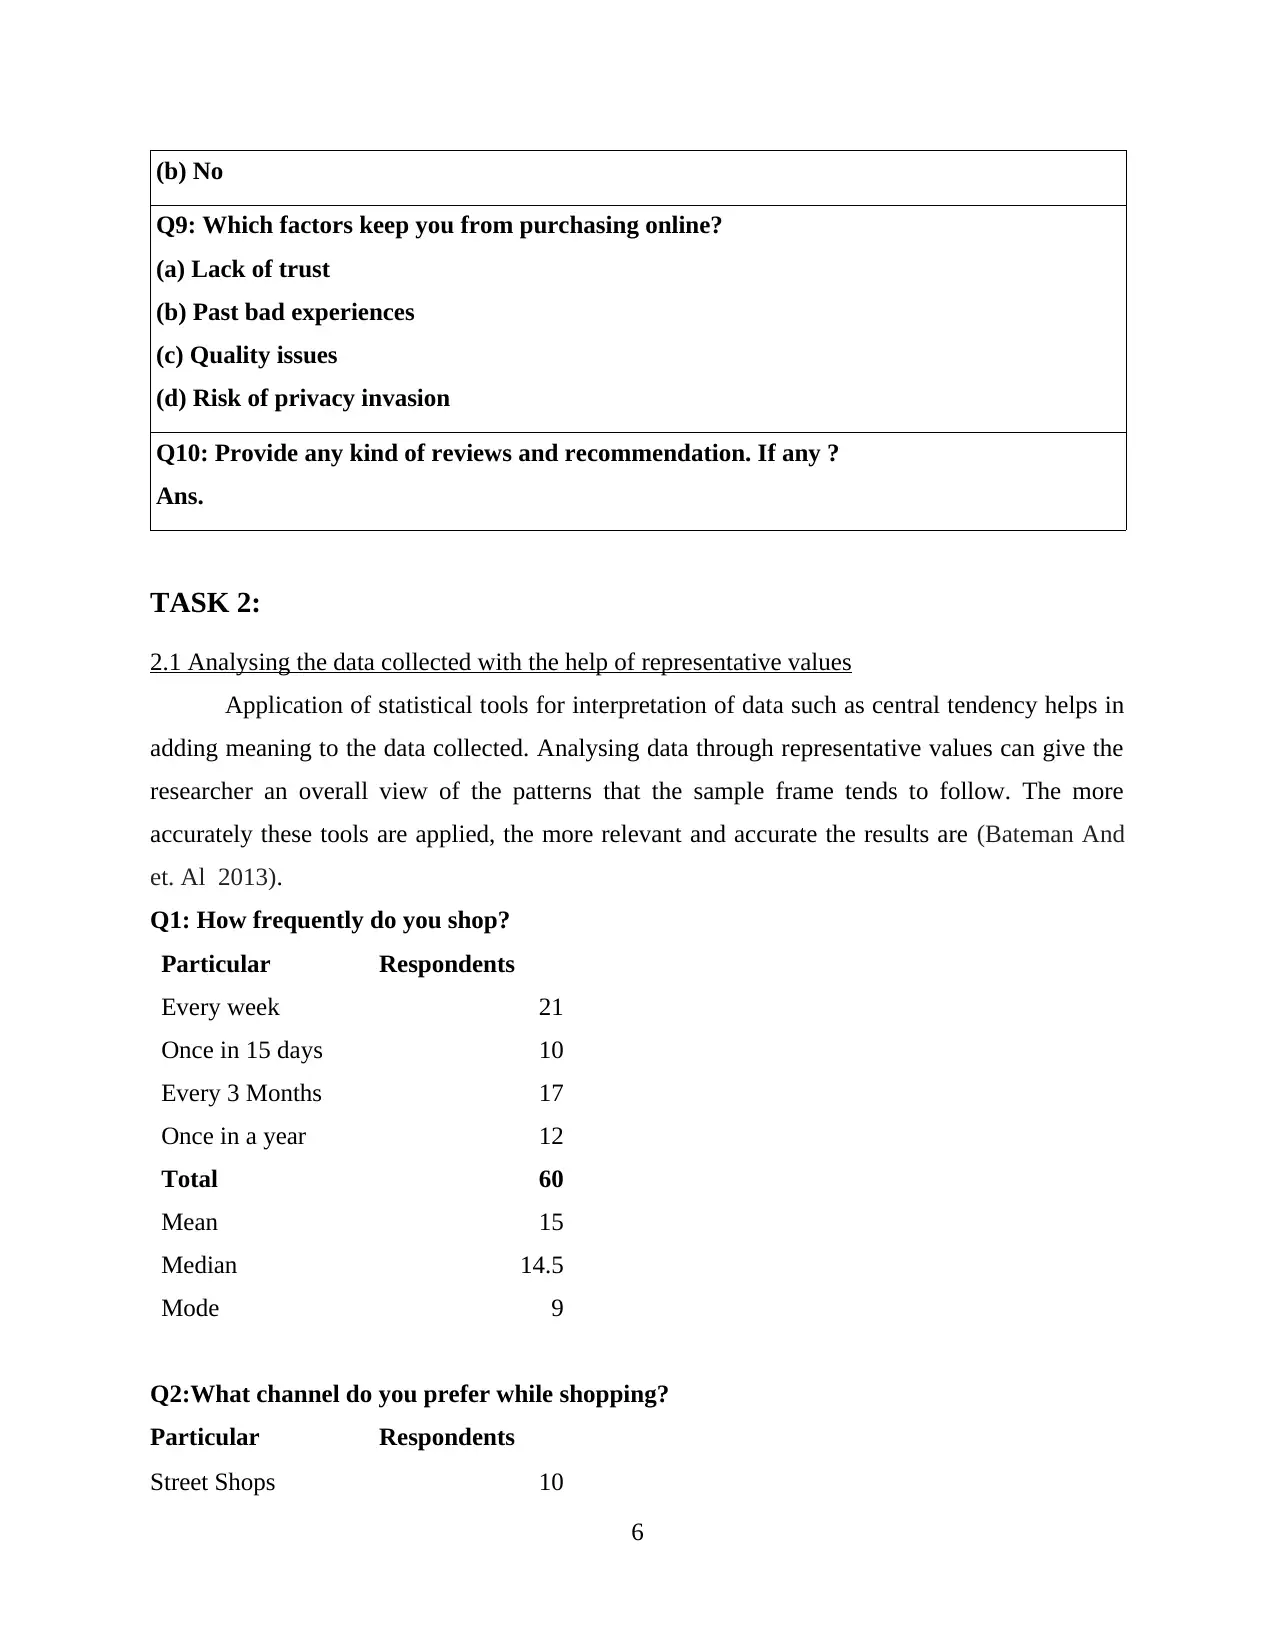
(b) No
Q9: Which factors keep you from purchasing online?
(a) Lack of trust
(b) Past bad experiences
(c) Quality issues
(d) Risk of privacy invasion
Q10: Provide any kind of reviews and recommendation. If any ?
Ans.
TASK 2:
2.1 Analysing the data collected with the help of representative values
Application of statistical tools for interpretation of data such as central tendency helps in
adding meaning to the data collected. Analysing data through representative values can give the
researcher an overall view of the patterns that the sample frame tends to follow. The more
accurately these tools are applied, the more relevant and accurate the results are (Bateman And
et. Al 2013).
Q1: How frequently do you shop?
Particular Respondents
Every week 21
Once in 15 days 10
Every 3 Months 17
Once in a year 12
Total 60
Mean 15
Median 14.5
Mode 9
Q2:What channel do you prefer while shopping?
Particular Respondents
Street Shops 10
6
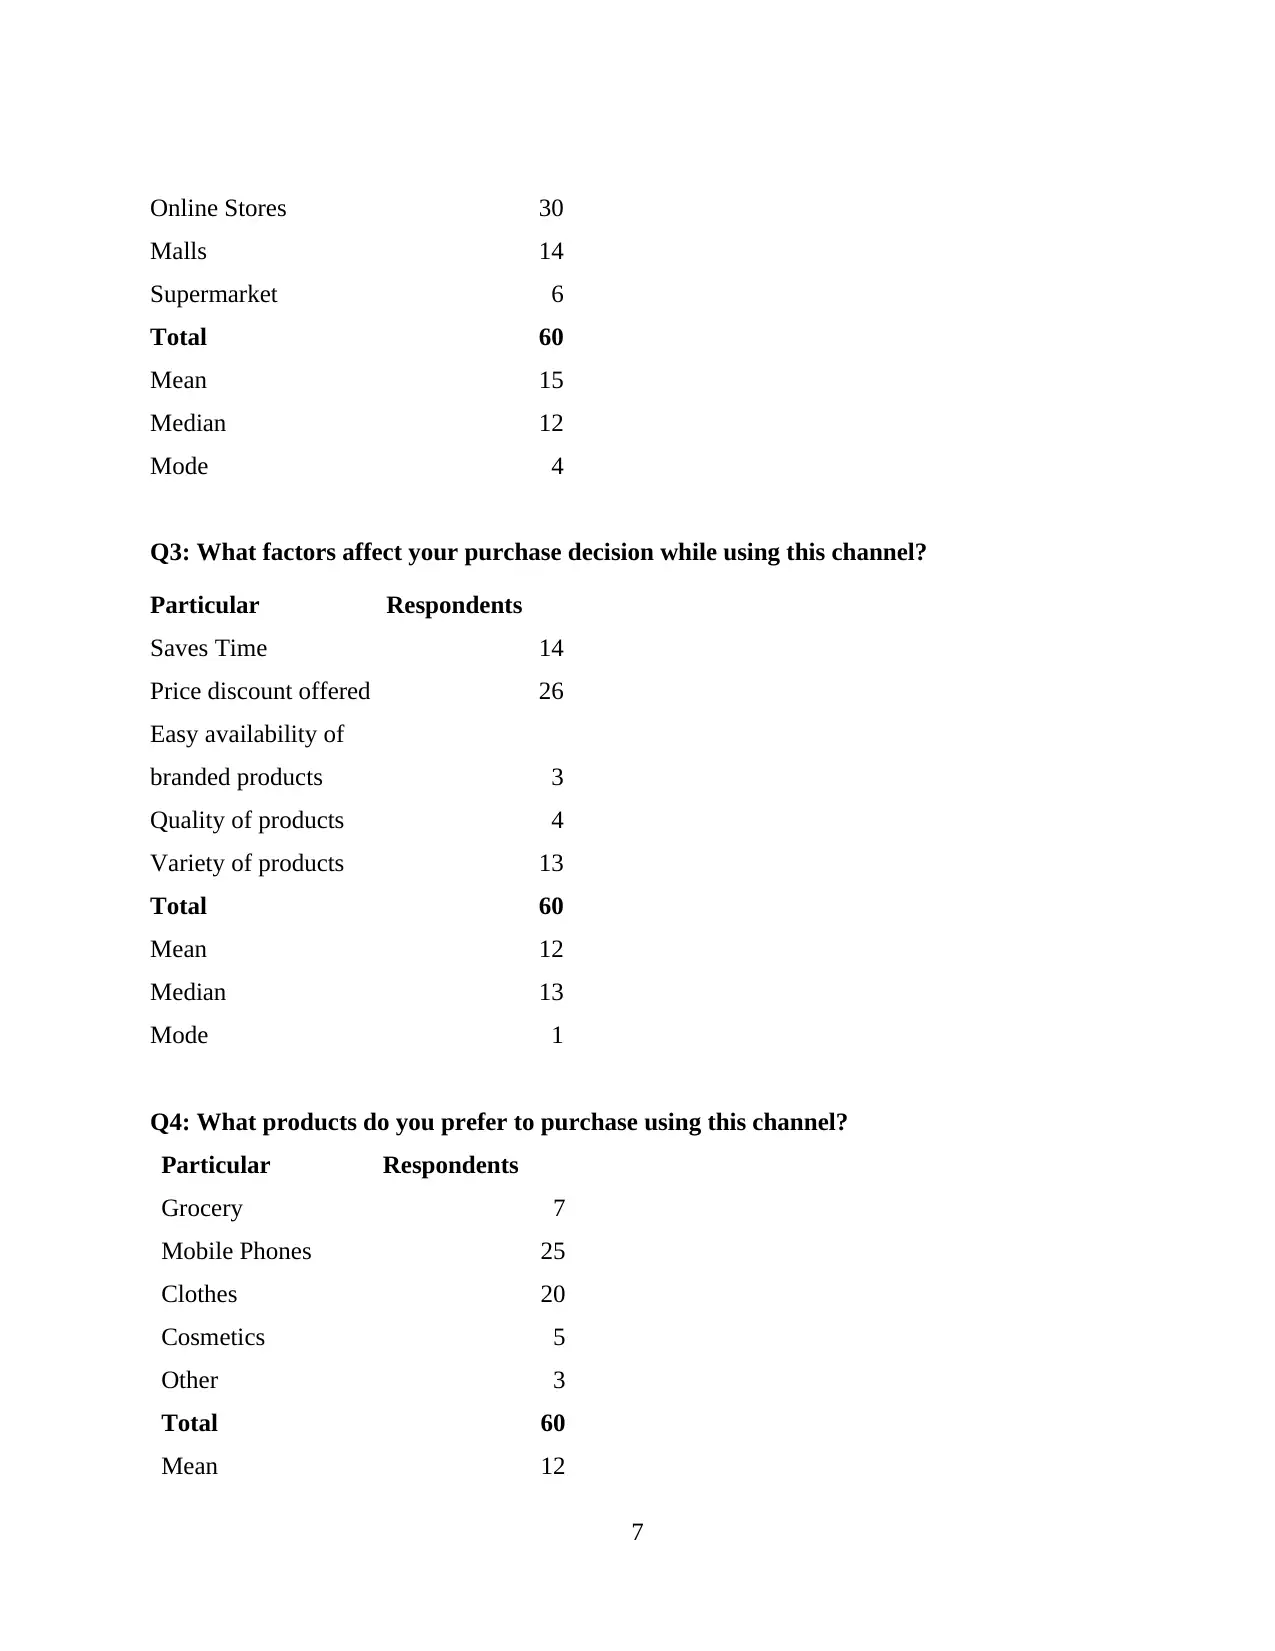
Online Stores 30
Malls 14
Supermarket 6
Total 60
Mean 15
Median 12
Mode 4
Q3: What factors affect your purchase decision while using this channel?
Particular Respondents
Saves Time 14
Price discount offered 26
Easy availability of
branded products 3
Quality of products 4
Variety of products 13
Total 60
Mean 12
Median 13
Mode 1
Q4: What products do you prefer to purchase using this channel?
Particular Respondents
Grocery 7
Mobile Phones 25
Clothes 20
Cosmetics 5
Other 3
Total 60
Mean 12
7
⊘ This is a preview!⊘
Do you want full access?
Subscribe today to unlock all pages.
Trusted by 1+ million students worldwide
Median 7
Mode 1
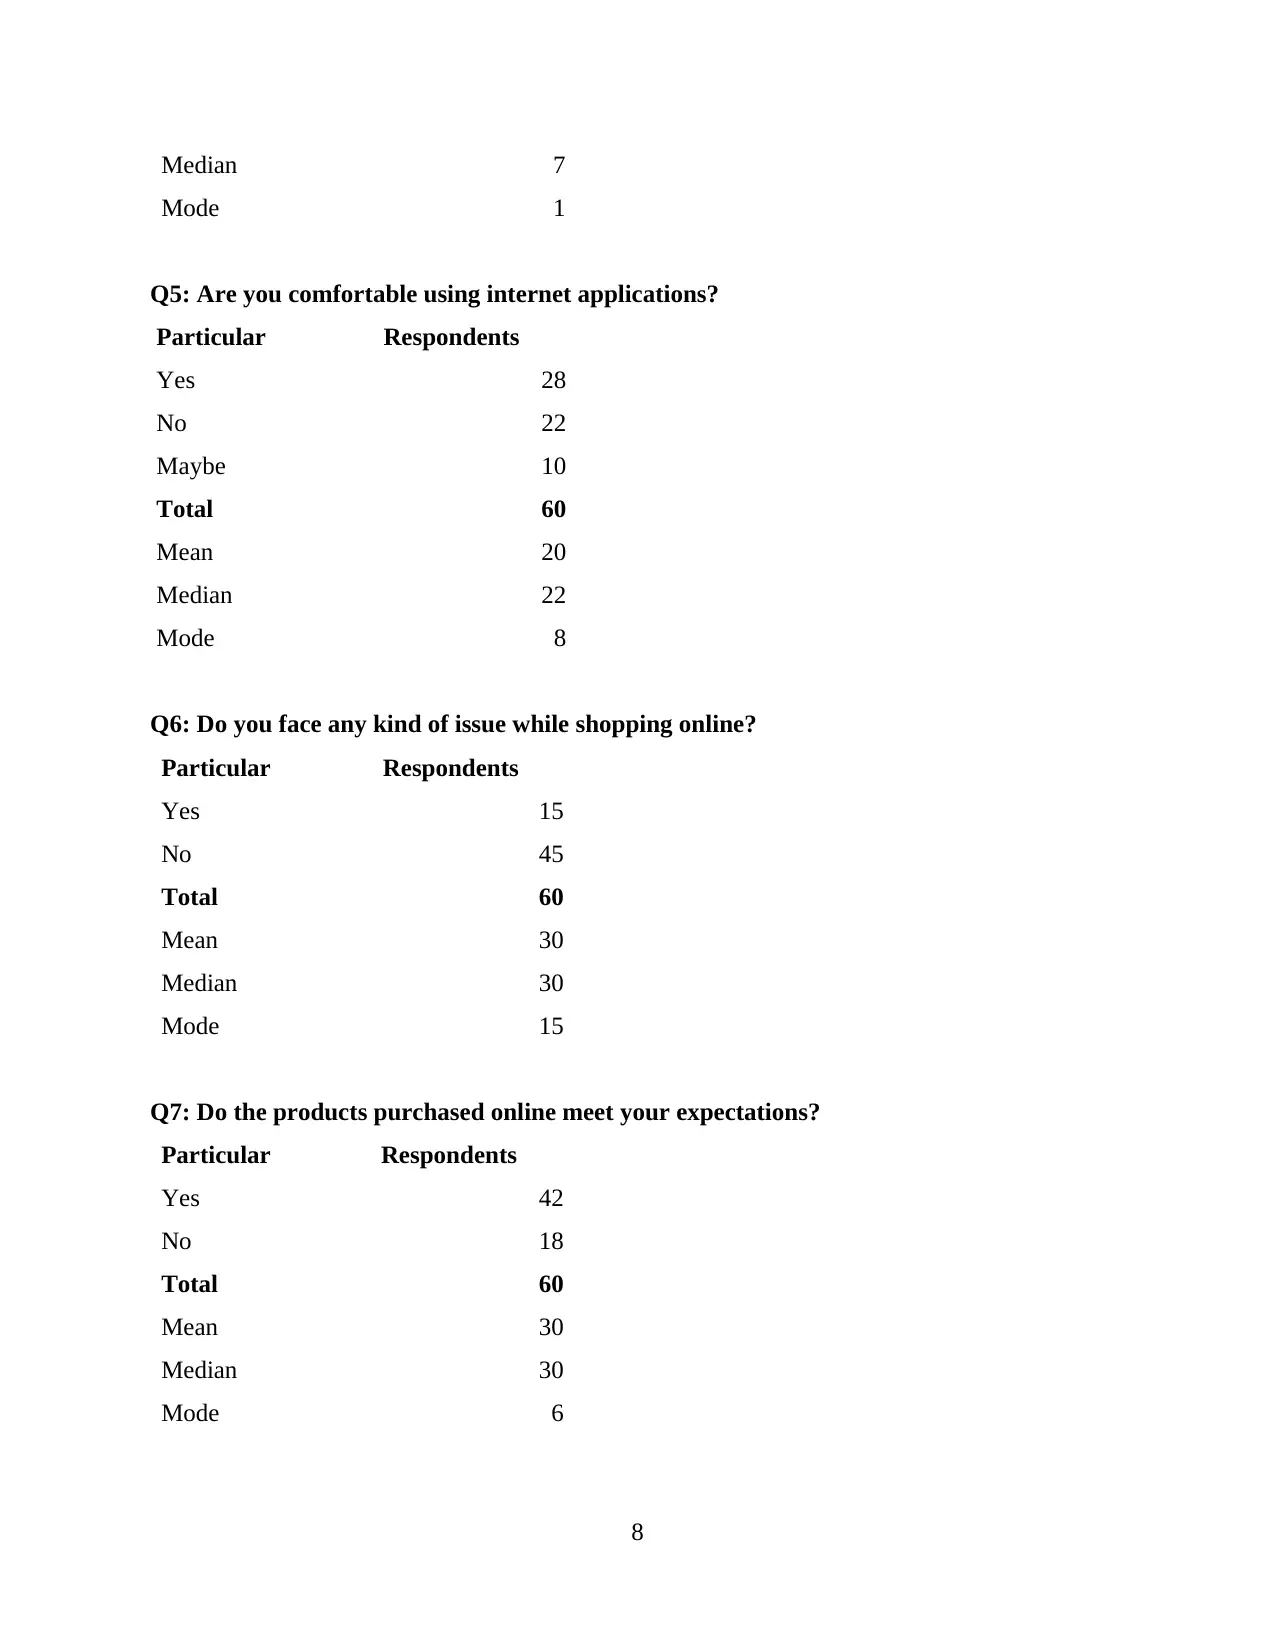
Q5: Are you comfortable using internet applications?
Particular Respondents
Yes 28
No 22
Maybe 10
Total 60
Mean 20
Median 22
Mode 8
Q6: Do you face any kind of issue while shopping online?
Particular Respondents
Yes 15
No 45
Total 60
Mean 30
Median 30
Mode 15
Q7: Do the products purchased online meet your expectations?
Particular Respondents
Yes 42
No 18
Total 60
Mean 30
Median 30
Mode 6
8
Mode 1
Q5: Are you comfortable using internet applications?
Particular Respondents
Yes 28
No 22
Maybe 10
Total 60
Mean 20
Median 22
Mode 8
Q6: Do you face any kind of issue while shopping online?
Particular Respondents
Yes 15
No 45
Total 60
Mean 30
Median 30
Mode 15
Q7: Do the products purchased online meet your expectations?
Particular Respondents
Yes 42
No 18
Total 60
Mean 30
Median 30
Mode 6
8
Paraphrase This Document
Need a fresh take? Get an instant paraphrase of this document with our AI Paraphraser
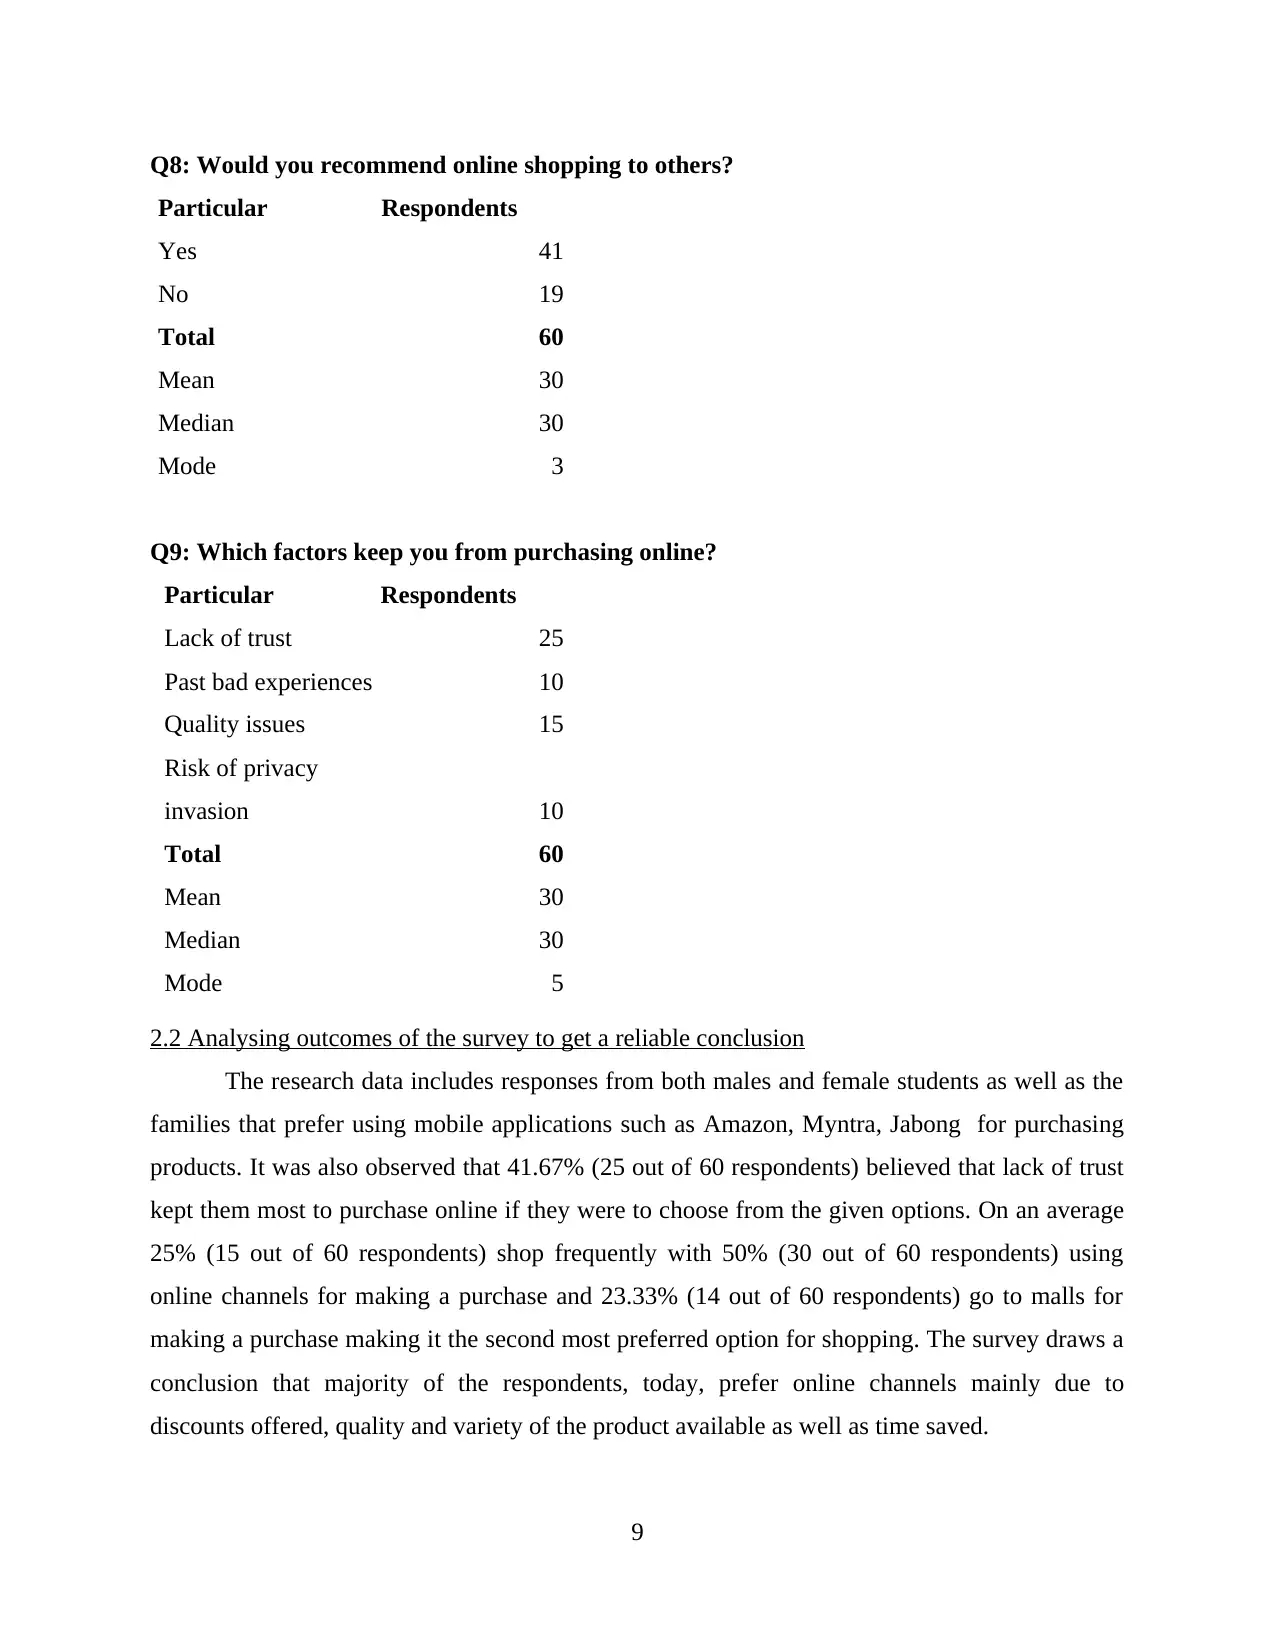
Q8: Would you recommend online shopping to others?
Particular Respondents
Yes 41
No 19
Total 60
Mean 30
Median 30
Mode 3
Q9: Which factors keep you from purchasing online?
Particular Respondents
Lack of trust 25
Past bad experiences 10
Quality issues 15
Risk of privacy
invasion 10
Total 60
Mean 30
Median 30
Mode 5
2.2 Analysing outcomes of the survey to get a reliable conclusion
The research data includes responses from both males and female students as well as the
families that prefer using mobile applications such as Amazon, Myntra, Jabong for purchasing
products. It was also observed that 41.67% (25 out of 60 respondents) believed that lack of trust
kept them most to purchase online if they were to choose from the given options. On an average
25% (15 out of 60 respondents) shop frequently with 50% (30 out of 60 respondents) using
online channels for making a purchase and 23.33% (14 out of 60 respondents) go to malls for
making a purchase making it the second most preferred option for shopping. The survey draws a
conclusion that majority of the respondents, today, prefer online channels mainly due to
discounts offered, quality and variety of the product available as well as time saved.
9
Particular Respondents
Yes 41
No 19
Total 60
Mean 30
Median 30
Mode 3
Q9: Which factors keep you from purchasing online?
Particular Respondents
Lack of trust 25
Past bad experiences 10
Quality issues 15
Risk of privacy
invasion 10
Total 60
Mean 30
Median 30
Mode 5
2.2 Analysing outcomes of the survey to get a reliable conclusion
The research data includes responses from both males and female students as well as the
families that prefer using mobile applications such as Amazon, Myntra, Jabong for purchasing
products. It was also observed that 41.67% (25 out of 60 respondents) believed that lack of trust
kept them most to purchase online if they were to choose from the given options. On an average
25% (15 out of 60 respondents) shop frequently with 50% (30 out of 60 respondents) using
online channels for making a purchase and 23.33% (14 out of 60 respondents) go to malls for
making a purchase making it the second most preferred option for shopping. The survey draws a
conclusion that majority of the respondents, today, prefer online channels mainly due to
discounts offered, quality and variety of the product available as well as time saved.
9
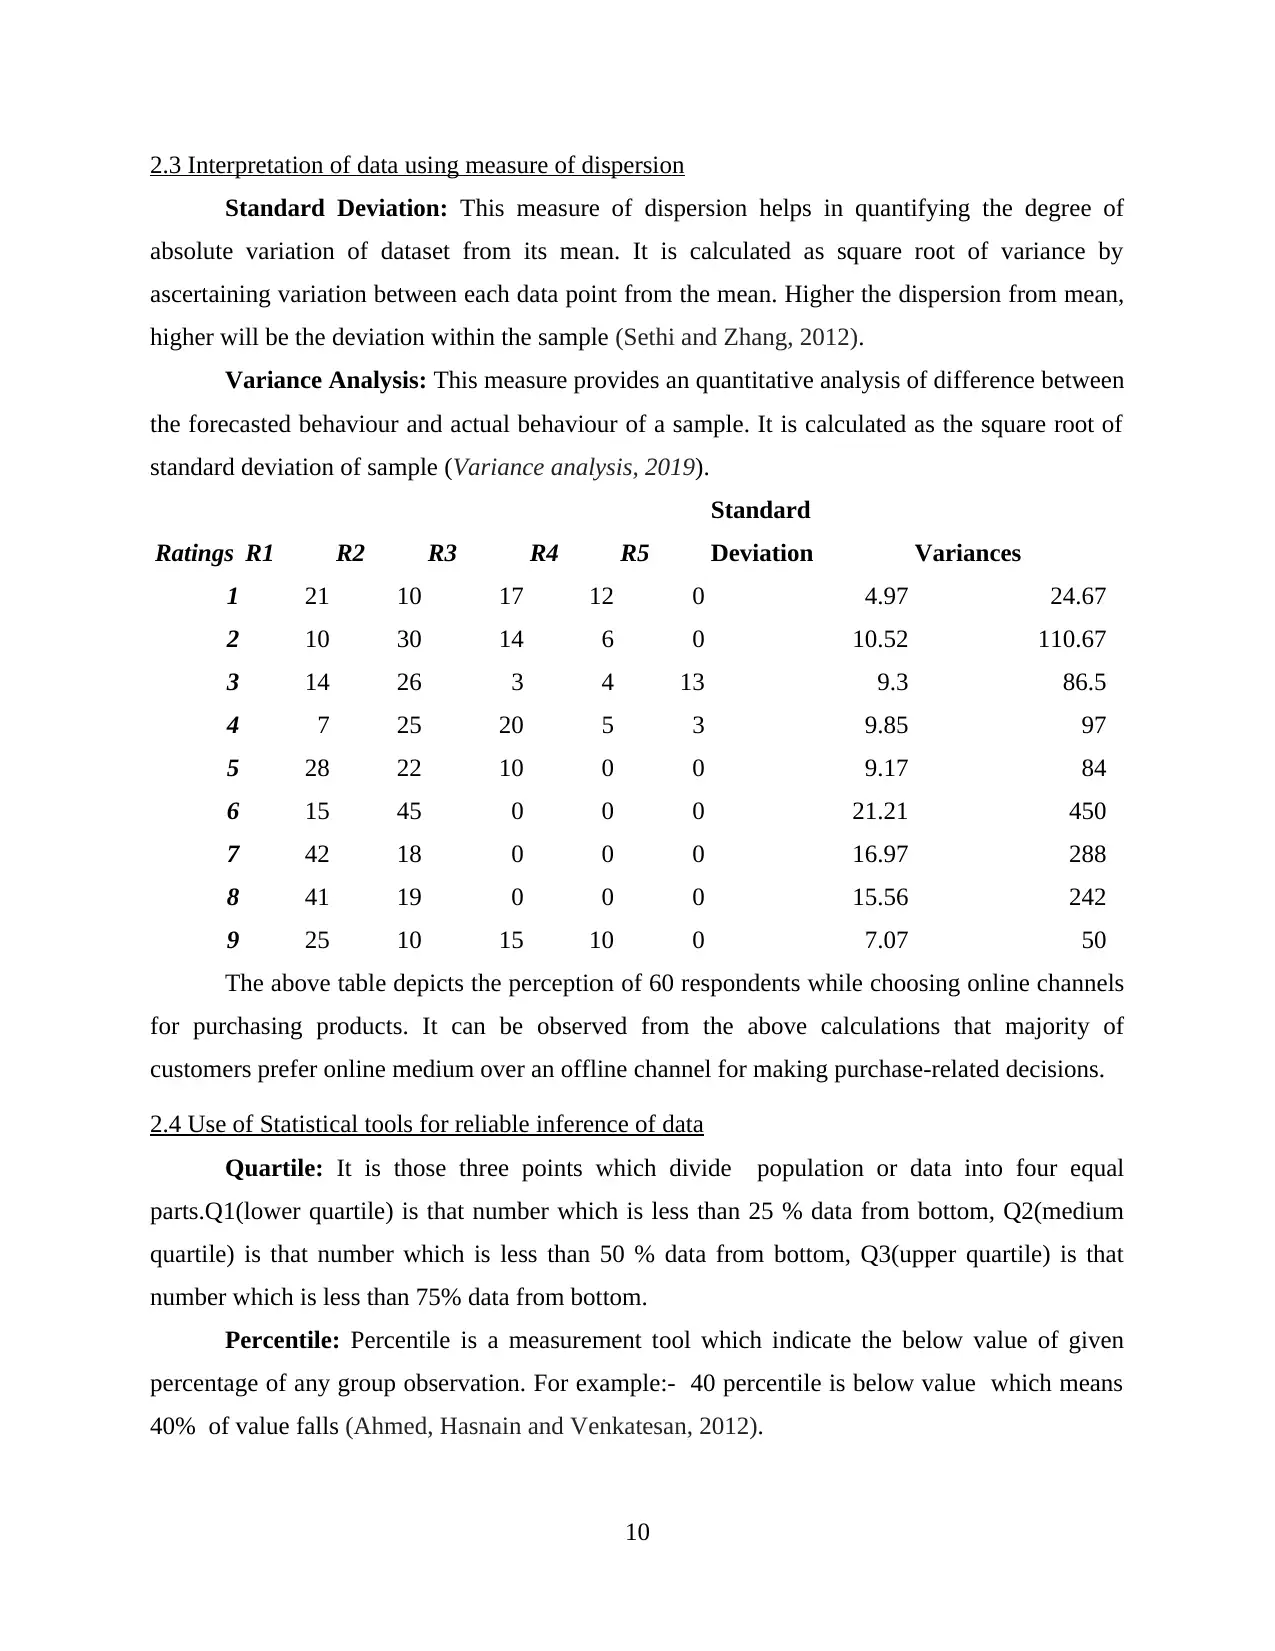
2.3 Interpretation of data using measure of dispersion
Standard Deviation: This measure of dispersion helps in quantifying the degree of
absolute variation of dataset from its mean. It is calculated as square root of variance by
ascertaining variation between each data point from the mean. Higher the dispersion from mean,
higher will be the deviation within the sample (Sethi and Zhang, 2012).
Variance Analysis: This measure provides an quantitative analysis of difference between
the forecasted behaviour and actual behaviour of a sample. It is calculated as the square root of
standard deviation of sample (Variance analysis, 2019).
Ratings R1 R2 R3 R4 R5
Standard
Deviation Variances
1 21 10 17 12 0 4.97 24.67
2 10 30 14 6 0 10.52 110.67
3 14 26 3 4 13 9.3 86.5
4 7 25 20 5 3 9.85 97
5 28 22 10 0 0 9.17 84
6 15 45 0 0 0 21.21 450
7 42 18 0 0 0 16.97 288
8 41 19 0 0 0 15.56 242
9 25 10 15 10 0 7.07 50
The above table depicts the perception of 60 respondents while choosing online channels
for purchasing products. It can be observed from the above calculations that majority of
customers prefer online medium over an offline channel for making purchase-related decisions.
2.4 Use of Statistical tools for reliable inference of data
Quartile: It is those three points which divide population or data into four equal
parts.Q1(lower quartile) is that number which is less than 25 % data from bottom, Q2(medium
quartile) is that number which is less than 50 % data from bottom, Q3(upper quartile) is that
number which is less than 75% data from bottom.
Percentile: Percentile is a measurement tool which indicate the below value of given
percentage of any group observation. For example:- 40 percentile is below value which means
40% of value falls (Ahmed, Hasnain and Venkatesan, 2012).
10
⊘ This is a preview!⊘
Do you want full access?
Subscribe today to unlock all pages.
Trusted by 1+ million students worldwide
1 out of 21
Related Documents


Your All-in-One AI-Powered Toolkit for Academic Success.
+13062052269
info@desklib.com
Available 24*7 on WhatsApp / Email
![[object Object]](/_next/static/media/star-bottom.7253800d.svg)
Unlock your academic potential
Copyright © 2020–2026 A2Z Services. All Rights Reserved. Developed and managed by ZUCOL.