Business Decision Making for Tour Company: Data Analysis Report

Verified

Added on  2020/02/03

|41
|3439
|29
Report
AI Summary
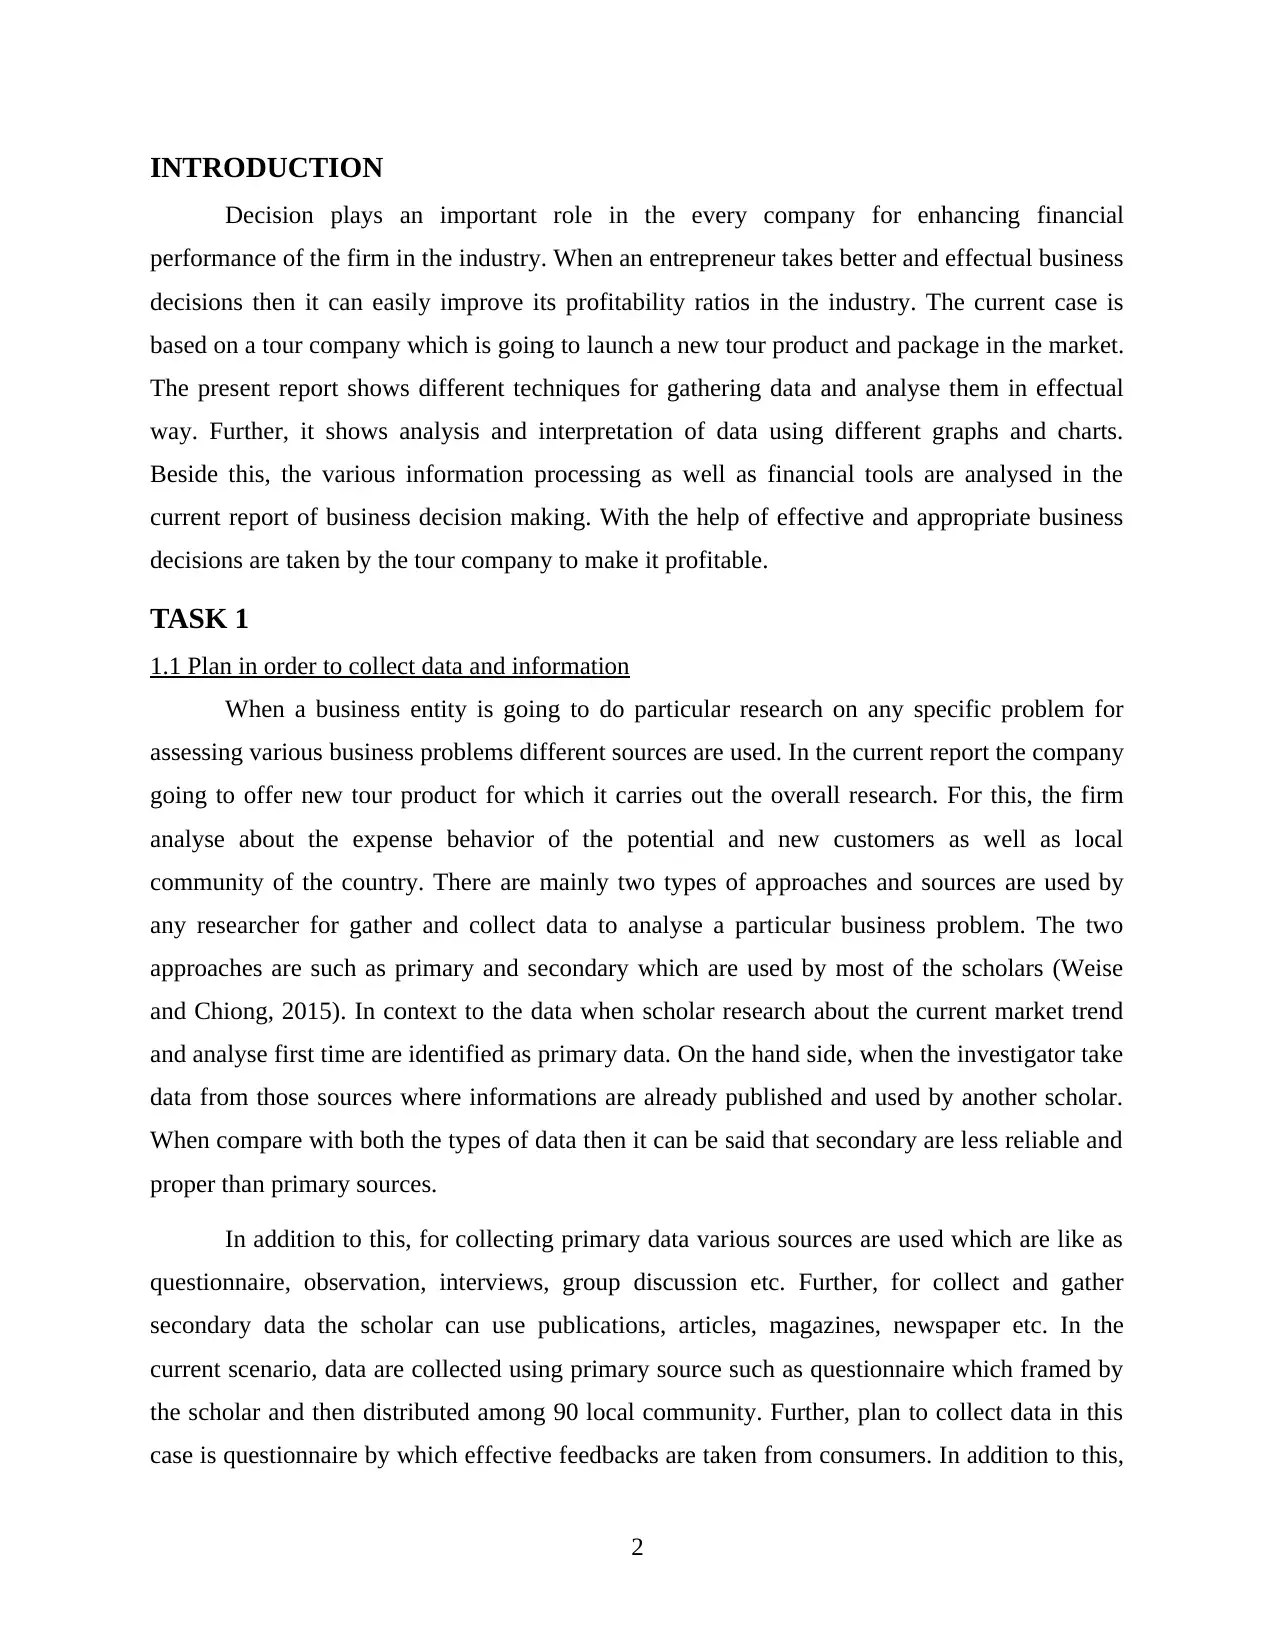
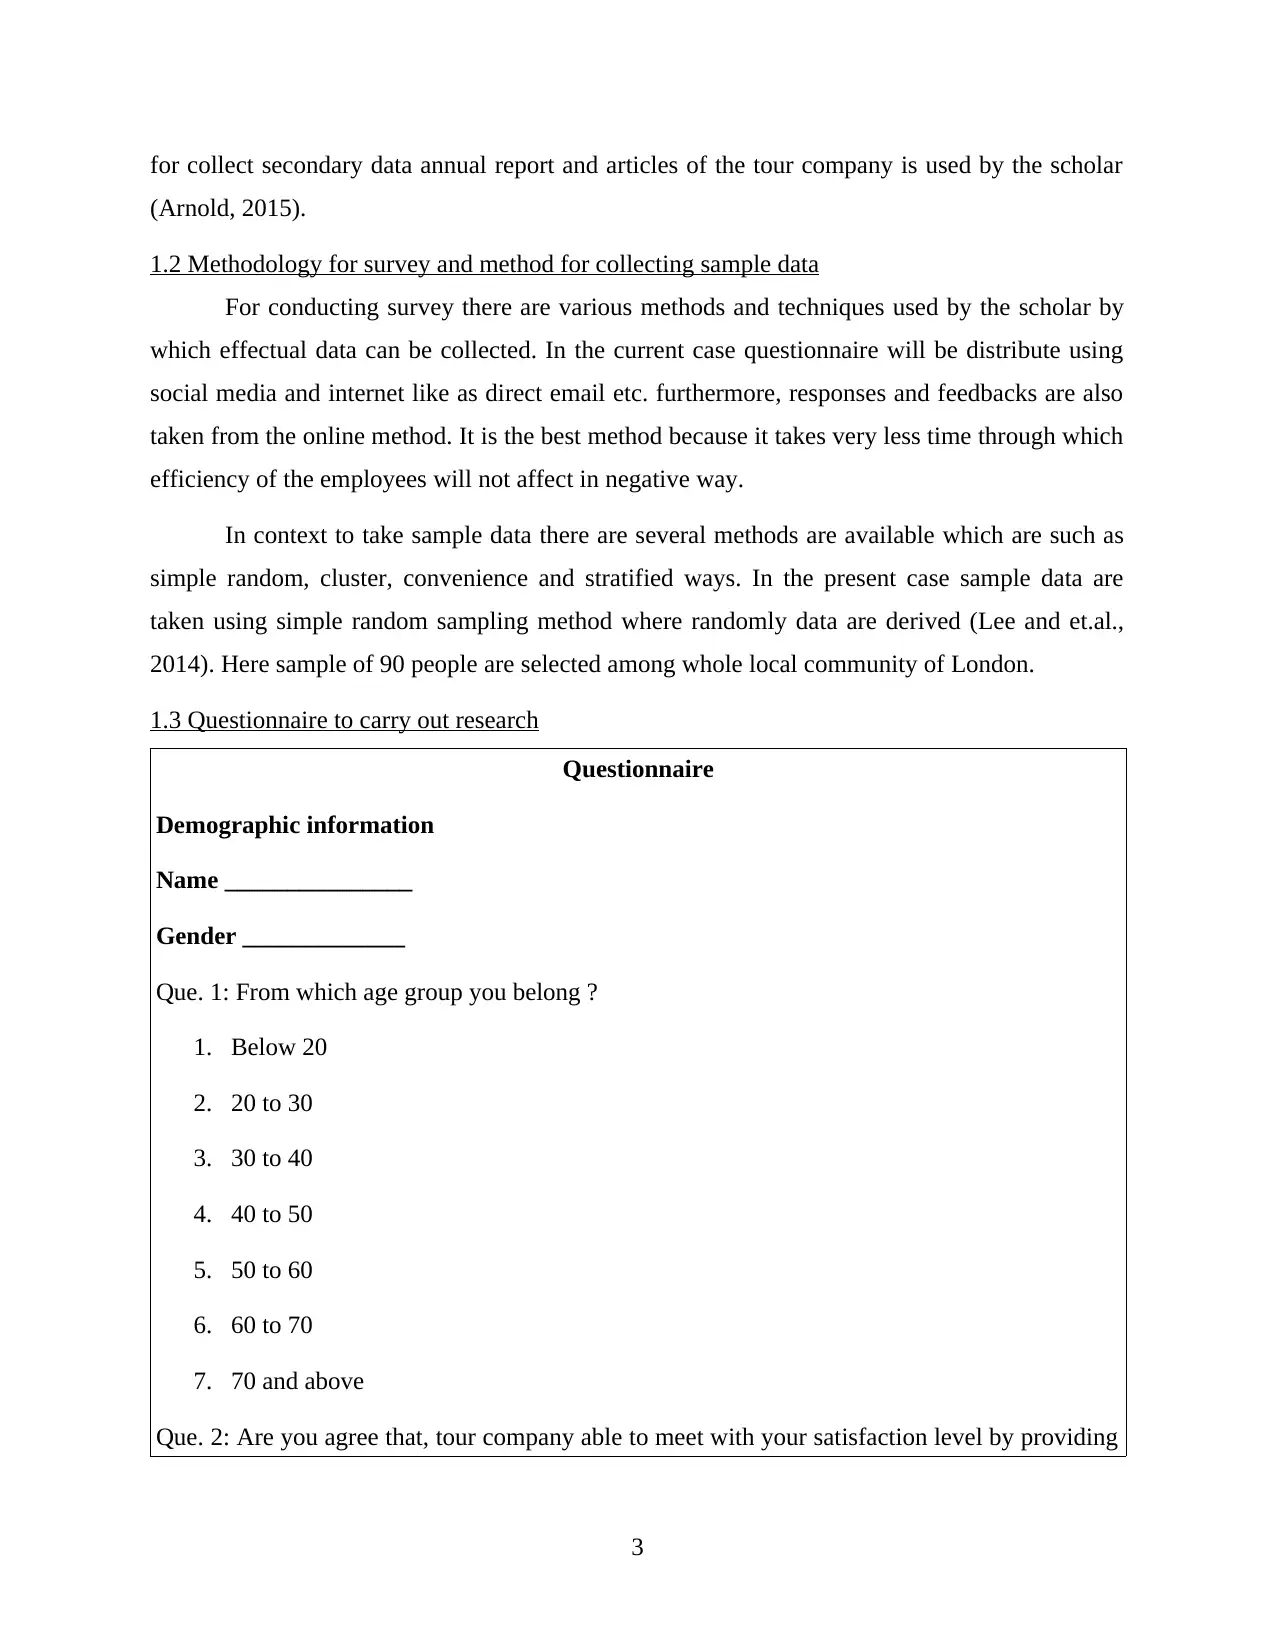
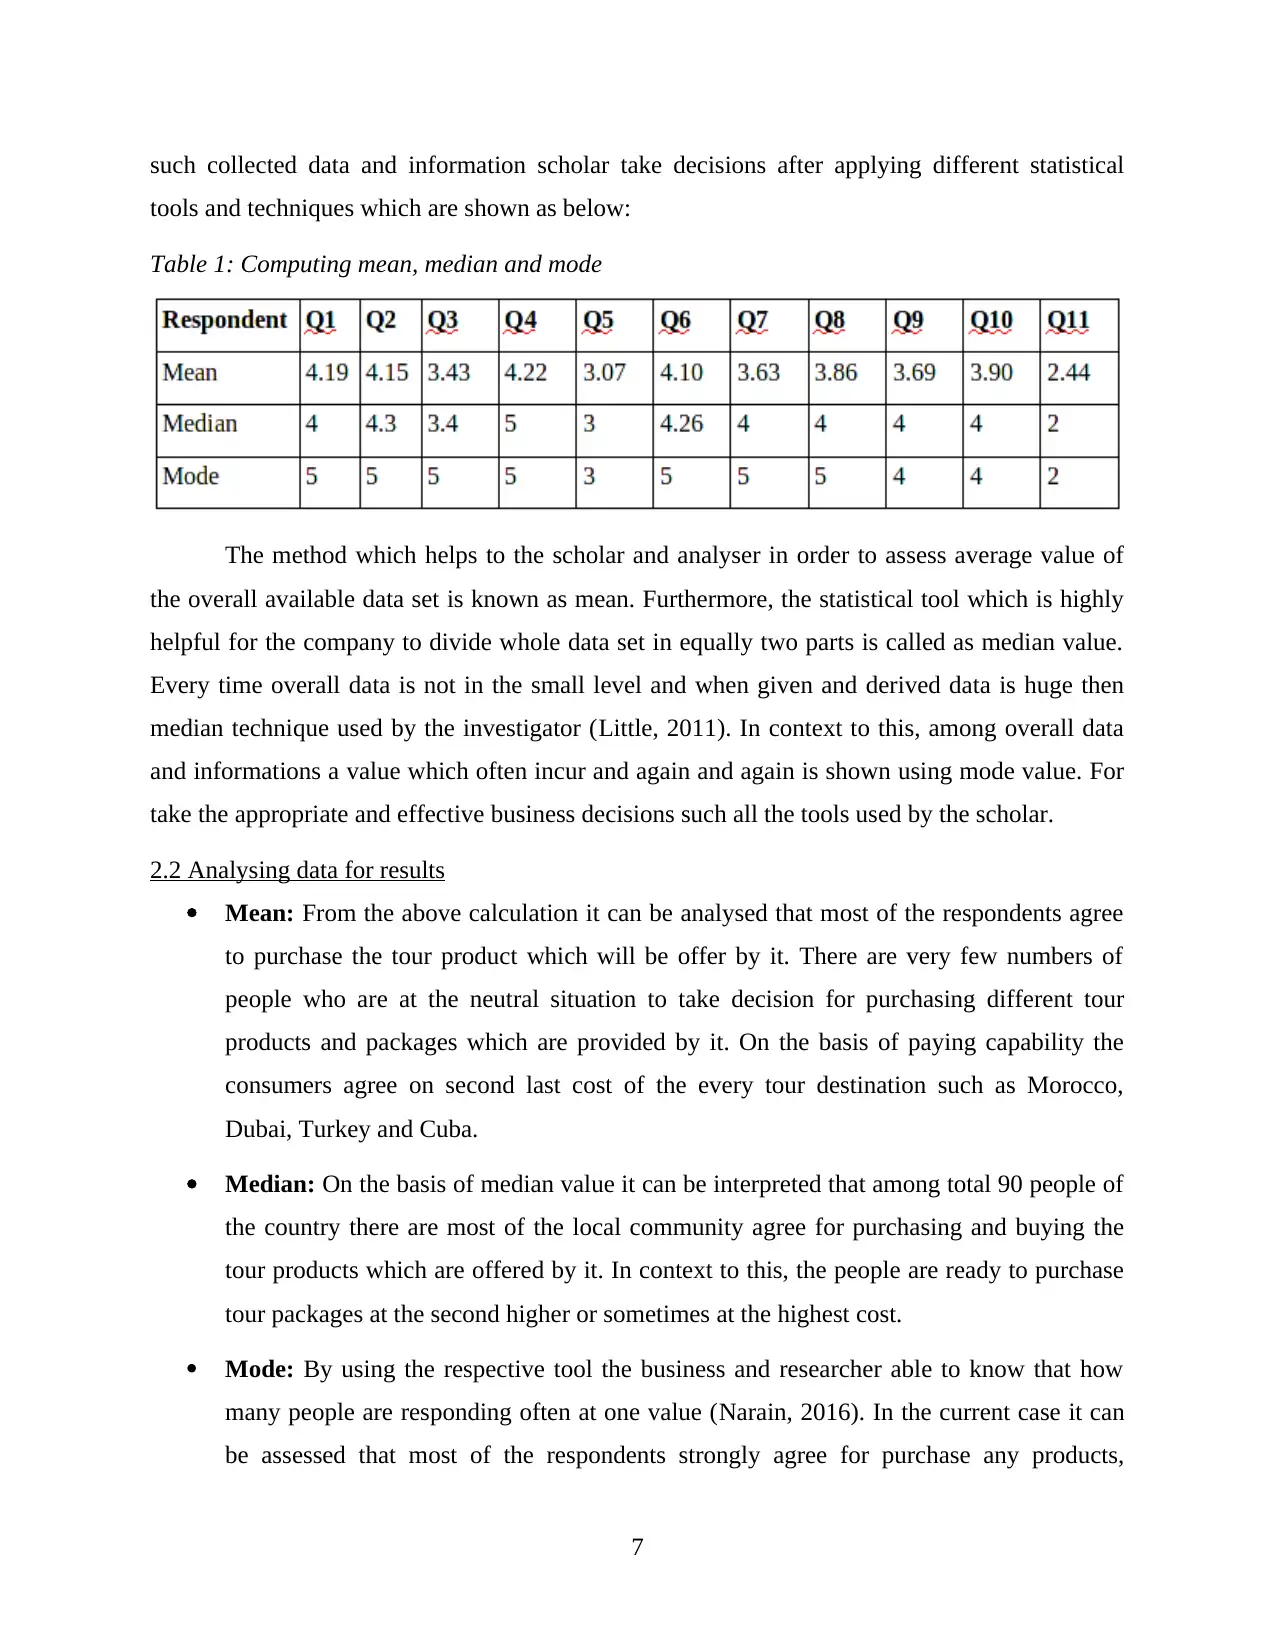
This report analyzes the business decision-making process for a tour company planning to launch a new product. It begins by outlining data collection methods, including the use of questionnaires distributed to a local community, and discusses both primary and secondary data sources. The report details the methodology used for the survey, including sampling techniques like simple random sampling. The core of the report focuses on summarizing and analyzing the collected data using statistical tools such as mean, median, mode, interquartile range, standard deviation, quartiles, and percentiles to assess consumer preferences and spending capabilities. Furthermore, the report includes a graphical representation of the data, utilizing pie charts, bar charts, and line charts to illustrate sales trends and revenue generation. Finally, the report incorporates trend lines to forecast future performance, aiding the tour company in making informed decisions about its new product launch and overall business strategy. The report concludes by drawing insights from the data analysis to aid in making informed business decisions.
Document Page
BUSINESS DECISION
MAKING
tabler-icon-diamond-filled.svg

Paraphrase This Document

Need a fresh take? Get an instant paraphrase of this document with our AI Paraphraser
Document Page
Document Page
1
Document Page
INTRODUCTION
Decision plays an important role in the every company for enhancing financial
performance of the firm in the industry. When an entrepreneur takes better and effectual business
decisions then it can easily improve its profitability ratios in the industry. The current case is
based on a tour company which is going to launch a new tour product and package in the market.
The present report shows different techniques for gathering data and analyse them in effectual
way. Further, it shows analysis and interpretation of data using different graphs and charts.
Beside this, the various information processing as well as financial tools are analysed in the
current report of business decision making. With the help of effective and appropriate business
decisions are taken by the tour company to make it profitable.
TASK 1
1.1 Plan in order to collect data and information
When a business entity is going to do particular research on any specific problem for
assessing various business problems different sources are used. In the current report the company
going to offer new tour product for which it carries out the overall research. For this, the firm
analyse about the expense behavior of the potential and new customers as well as local
community of the country. There are mainly two types of approaches and sources are used by
any researcher for gather and collect data to analyse a particular business problem. The two
approaches are such as primary and secondary which are used by most of the scholars (Weise
and Chiong, 2015). In context to the data when scholar research about the current market trend
and analyse first time are identified as primary data. On the hand side, when the investigator take
data from those sources where informations are already published and used by another scholar.
When compare with both the types of data then it can be said that secondary are less reliable and
proper than primary sources.
In addition to this, for collecting primary data various sources are used which are like as
questionnaire, observation, interviews, group discussion etc. Further, for collect and gather
secondary data the scholar can use publications, articles, magazines, newspaper etc. In the
current scenario, data are collected using primary source such as questionnaire which framed by
the scholar and then distributed among 90 local community. Further, plan to collect data in this
case is questionnaire by which effective feedbacks are taken from consumers. In addition to this,
2
tabler-icon-diamond-filled.svg

Paraphrase This Document

Need a fresh take? Get an instant paraphrase of this document with our AI Paraphraser
Document Page
for collect secondary data annual report and articles of the tour company is used by the scholar
(Arnold, 2015).
1.2 Methodology for survey and method for collecting sample data
For conducting survey there are various methods and techniques used by the scholar by
which effectual data can be collected. In the current case questionnaire will be distribute using
social media and internet like as direct email etc. furthermore, responses and feedbacks are also
taken from the online method. It is the best method because it takes very less time through which
efficiency of the employees will not affect in negative way.
In context to take sample data there are several methods are available which are such as
simple random, cluster, convenience and stratified ways. In the present case sample data are
taken using simple random sampling method where randomly data are derived (Lee and et.al.,
2014). Here sample of 90 people are selected among whole local community of London.
1.3 Questionnaire to carry out research
Questionnaire
Demographic information
Name _______________
Gender _____________
Que. 1: From which age group you belong ?
1. Below 20
2. 20 to 30
3. 30 to 40
4. 40 to 50
5. 50 to 60
6. 60 to 70
7. 70 and above
Que. 2: Are you agree that, tour company able to meet with your satisfaction level by providing
3
Document Page
tout products ?
11 Strongly disagree
1
1 Disagree
1
1 Neutral
1
1 Agree
1
1 Strongly agree
Que. 3: How frequently you are purchasing a tour package within one year ?
Monthly
Quarterly
Half yearly
Yearly
Sometimes
Que. 4: You will buy a tour package or product for destination A such as Morocco in further
years ?
1. Strongly disagree
2. Disagree
3. Neutral
4. Agree
5. Strongly agree
Que. 5: Up to which extent you are capable to pay on tour package or product for every person
or traveller for the destination A like as Morocco ?
1. £600 but less than 625
2. £625 but less than 650
3. £650 but less than 675
4
Document Page
4. £675 but less than 700
5. £700 but less than 725
Que. 6: You will buy a tour package or product for destination B such as Turkey in upcoming
years ?
1. Strongly disagree
2. Disagree
3. Neutral
4. Agree
5. Strongly agree
Que. 7: Up to which extent you are capable to pay on tour package or product for every person
or traveller for the destination B like as Turkey ?
1. £600 but less than 625
2. £625 but less than 650
3. £650 but less than 675
4. £675 but less than 700
5. £700 but less than 725
Que. 8: You will buy a tour package or product for destination C such as Cuba in upcoming
years ?
1. Strongly disagree
2. Disagree
3. Neutral
4. Agree
5. Strongly agree
Que. 9: Up to which extent you are capable to pay on tour package or product for every person
5
tabler-icon-diamond-filled.svg

Paraphrase This Document

Need a fresh take? Get an instant paraphrase of this document with our AI Paraphraser
Document Page
or traveller for the destination C like as Cuba ?
1. £800 but less than 825
2. £825 but less than 850
3. £850 but less than 875
4. £875 but less than 900
5. £900 but less than 925
Que. 10: You will buy a tour package or product for destination D like as Dubai in upcoming
years ?
1. Strongly disagree
2. Disagree
3. Neutral
4. Agree
5. Strongly agree
Que. 11: Up to which extent you are capable to pay on tour package or product for every person
or traveller for the destination D like as Dubai ?
1. £900 but less than 925
2. £925 but less than 950
3. £950 but less than 975
4. £975 but less than 1000
5. £1000 but less than 1025
TASK 2
2.1 Summarising data which are collected from respondents
The data which are collected from the total 90 respondents are to be used and
summarised for further decision making such as launching new tour product. On the basis of
6
Document Page
such collected data and information scholar take decisions after applying different statistical
tools and techniques which are shown as below:
Table 1: Computing mean, median and mode
The method which helps to the scholar and analyser in order to assess average value of
the overall available data set is known as mean. Furthermore, the statistical tool which is highly
helpful for the company to divide whole data set in equally two parts is called as median value.
Every time overall data is not in the small level and when given and derived data is huge then
median technique used by the investigator (Little, 2011). In context to this, among overall data
and informations a value which often incur and again and again is shown using mode value. For
take the appropriate and effective business decisions such all the tools used by the scholar.
2.2 Analysing data for results
Mean: From the above calculation it can be analysed that most of the respondents agree
to purchase the tour product which will be offer by it. There are very few numbers of
people who are at the neutral situation to take decision for purchasing different tour
products and packages which are provided by it. On the basis of paying capability the
consumers agree on second last cost of the every tour destination such as Morocco,
Dubai, Turkey and Cuba.
Median: On the basis of median value it can be interpreted that among total 90 people of
the country there are most of the local community agree for purchasing and buying the
tour products which are offered by it. In context to this, the people are ready to purchase
tour packages at the second higher or sometimes at the highest cost.
Mode: By using the respective tool the business and researcher able to know that how
many people are responding often at one value (Narain, 2016). In the current case it can
be assessed that most of the respondents strongly agree for purchase any products,
7
Document Page
further, the people and customers are the most frequent to purchase at the highest cost of
tour package which is profitable for it.
2.3 Analysing measure of dispersions
Inter quartile range
Table 2: Computing inter quartile range
On the basis of inter quartile range it can be said that at total eleven questions the
customers are not purchasing any product between the year. It shows middle value of the overall
quartile value and in the statistics it denotes as Q2. For assessing value of the inter quartile there
are two value are necessary which are like as upper (Q1) and lower quartile (Q3) and formula is
Q1-Q3.
Standard deviation
Table 3: Computing standard deviation
It can be said that standard value is deviate from the mean value up to greater level
because of occurring huge difference in this case. It can be said that on the basis of mean value
there are customers respondent in profitable way (Arnicans, 2013). Moreover, according to the
standard value performance of the tour company is little poor where it needs to provide schemes
and discounts on tour packages.
2.4
Quartiles
Table 4: Computing quartile
8
tabler-icon-diamond-filled.svg

Paraphrase This Document

Need a fresh take? Get an instant paraphrase of this document with our AI Paraphraser
Document Page
Percentiles
Table 5: Computing percentile
Findings:
It can be found from the above both tables of quartile and percentile that the company not
performing well because at the all level and stages consumers are constant and purchasing tour
products at one cost (Narain, 2016). At the upper, middle and lower quartile the customers or
people purchases tour products at same cost per person.
TASK 3
3.1 Graphical representation of data
The presentation which helps to the researcher and analyser in order to analyse and make
interpretation of the data in effective and appropriate manner. Further, various types of graphs
and charts are comes under graphical representation which are shown for the tour company as
below:
Pie chart
For the year 2014
9
Document Page
931
959
1104
713
For the year 2015
957
997
1163
769
For the year 2016
10
Q1
Q2
Q3
Q4
Q1
Q2
Q3
Q4
chevron_up_icon
1 out of 41
circle_padding
hide_on_mobile
zoom_out_icon
[object Object]