Analyzing Information and Data for Business Development Decisions
VerifiedAdded on 2023/03/22
|15
|3331
|35
Homework Assignment
AI Summary
This assignment presents a comprehensive analysis of data related to the stationary market in Germany, focusing on trends, sales values, and business decision-making. The analysis includes an examination of wholesale stationary business trends, sales values across European countries (France, Germany, Italy, Romania, UK, Poland, and Switzerland), and product-wise sales from 2015 to 2017. The assignment utilizes various analytical tools, such as scatter diagrams and correlation coefficients, to predict sales trends and assess the impact of market factors. Furthermore, the assignment evaluates the application of international standards (ISO) to the firm's business and calculates monthly costs. It also includes a SWOT analysis and a confidence interval calculation to assess the firm's potential in the German market. The report concludes with recommendations for improving the business situation, supported by descriptive statistics. The assignment's primary goal is to provide insights for strategic decision-making and business development within the context of the German stationary market.
ANALYSING INFORMATION AND DATA
FOR PROBLEM SOLVING
FOR PROBLEM SOLVING
Paraphrase This Document
Need a fresh take? Get an instant paraphrase of this document with our AI Paraphraser
TABLE OF CONTENTS
INTRODUCTION...........................................................................................................................1
TASK 1............................................................................................................................................1
Trends in Germany stationary market.........................................................................................1
TASK 2............................................................................................................................................2
TASK 3............................................................................................................................................3
(a)Total sales value of products from 2015 to 2017....................................................................3
(b) Pie chart for sales amid of 2016 and 2017 productwise.......................................................4
© Coorelation cofficient..............................................................................................................5
(d) Prediction on sales trend........................................................................................................5
TASK 4............................................................................................................................................6
(a)Completion of table.................................................................................................................6
(b)International standard applied to the firm business................................................................6
TASK 5............................................................................................................................................7
(a)Monthly cost by considering year...........................................................................................7
(b)Monthly cost by considering month........................................................................................7
TASK 6............................................................................................................................................7
Confidence interval......................................................................................................................7
TASK 7............................................................................................................................................8
(a)Advise in respect to improving situation.................................................................................8
(b) Descriptive statistics..............................................................................................................8
TASK 8 CONCLUSION.................................................................................................................8
APPENDIX....................................................................................................................................11
INTRODUCTION
Data analysis is the one of the important approach that is used to make decisions. In the
current report varied facts are analyzed in proper manner. On basis of analysis of facts it is
identified whether firm must open its business in Germany. Scatter diagram is prepared and by
using same coorelation cofficient is identified. On analysis of both coorelation and trend analysis
chart it is predicted that in upcoming years sales value will increase at rapid rate. Sales in second
charting reflecting total amount of sales for different years for varied nations in dollar amount.
Sales data is related to revenue that is generated betweeen 2012 to 2017. At end of the report,
dscriptive statisics is applied on dataset. In this way, entire research work is carried out.
TASK 1
Trends in Germany stationary market
1 2 3 4 5 6 7 8 9 10 11 12 13 14 15
0
1000
2000
3000
4000
5000
6000
7000
8000
9000 7973 7791 7736 7620 7429 7242 6965 6941 6632 6335 6047 5710 5440 5200 5300
Sale
Sale
Figure 1Wholesale stationary business in Germany
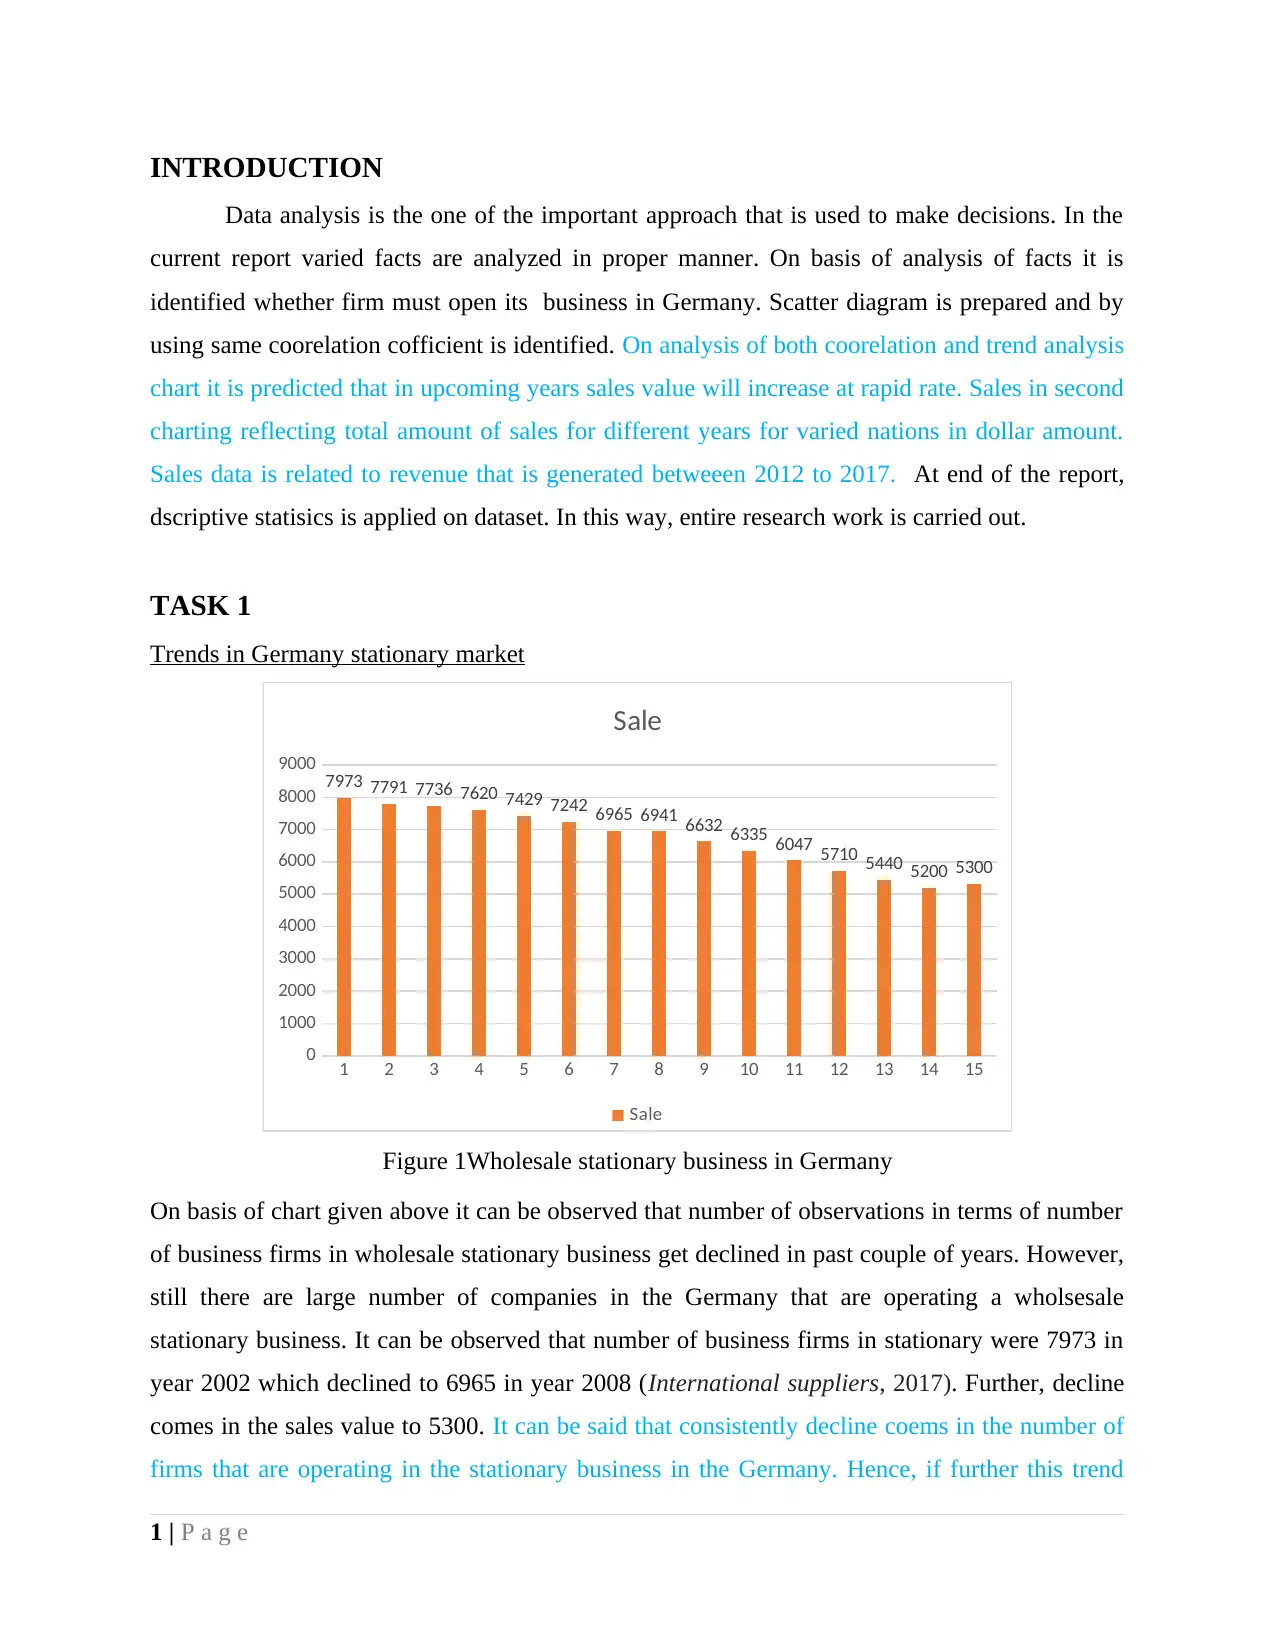
On basis of chart given above it can be observed that number of observations in terms of number
of business firms in wholesale stationary business get declined in past couple of years. However,
still there are large number of companies in the Germany that are operating a wholsesale
stationary business. It can be observed that number of business firms in stationary were 7973 in
year 2002 which declined to 6965 in year 2008 (International suppliers, 2017). Further, decline
comes in the sales value to 5300. It can be said that consistently decline coems in the number of
firms that are operating in the stationary business in the Germany. Hence, if further this trend
1 | P a g e
Data analysis is the one of the important approach that is used to make decisions. In the
current report varied facts are analyzed in proper manner. On basis of analysis of facts it is
identified whether firm must open its business in Germany. Scatter diagram is prepared and by
using same coorelation cofficient is identified. On analysis of both coorelation and trend analysis
chart it is predicted that in upcoming years sales value will increase at rapid rate. Sales in second
charting reflecting total amount of sales for different years for varied nations in dollar amount.
Sales data is related to revenue that is generated betweeen 2012 to 2017. At end of the report,
dscriptive statisics is applied on dataset. In this way, entire research work is carried out.
TASK 1
Trends in Germany stationary market
1 2 3 4 5 6 7 8 9 10 11 12 13 14 15
0
1000
2000
3000
4000
5000
6000
7000
8000
9000 7973 7791 7736 7620 7429 7242 6965 6941 6632 6335 6047 5710 5440 5200 5300
Sale
Sale
Figure 1Wholesale stationary business in Germany
On basis of chart given above it can be observed that number of observations in terms of number
of business firms in wholesale stationary business get declined in past couple of years. However,
still there are large number of companies in the Germany that are operating a wholsesale
stationary business. It can be observed that number of business firms in stationary were 7973 in
year 2002 which declined to 6965 in year 2008 (International suppliers, 2017). Further, decline
comes in the sales value to 5300. It can be said that consistently decline coems in the number of
firms that are operating in the stationary business in the Germany. Hence, if further this trend
1 | P a g e
⊘ This is a preview!⊘
Do you want full access?
Subscribe today to unlock all pages.
Trusted by 1+ million students worldwide
remain continue in the market then number of competitors of the firm will reduced. This thing
will prove beneficial for the Donald to great extent. There is need to take steps to improve
numbers in the wholesale statioanry business in Germany. However, still number of firms
operating in this segment is high which reflect there there is great demand of stationary items in
Germany and exports are also high in other European countries. Thus, it can be said that still
stationary business is operating at wide level in the Germany and it is possible that in upcoming
time period it grow at rapid pace.
TASK 2
France
Germany
Italy
Romania
UK
Poland
Switzerland
0 5000 10000 15000 20000 25000 30000
15475
24984
16000
17000
14000
19000
20500
14887
24559
14000
17600
16900
19900
21000
14746
24900
14500
18300
17300
20000
21500
14697
25483
15000
18000
17900
23000
22500
15432
26757
15750
18900
18795
24150
23625
Sales value of five years for Europe an countries
Series6 Series5 Series4 Series3 Series2 Series1
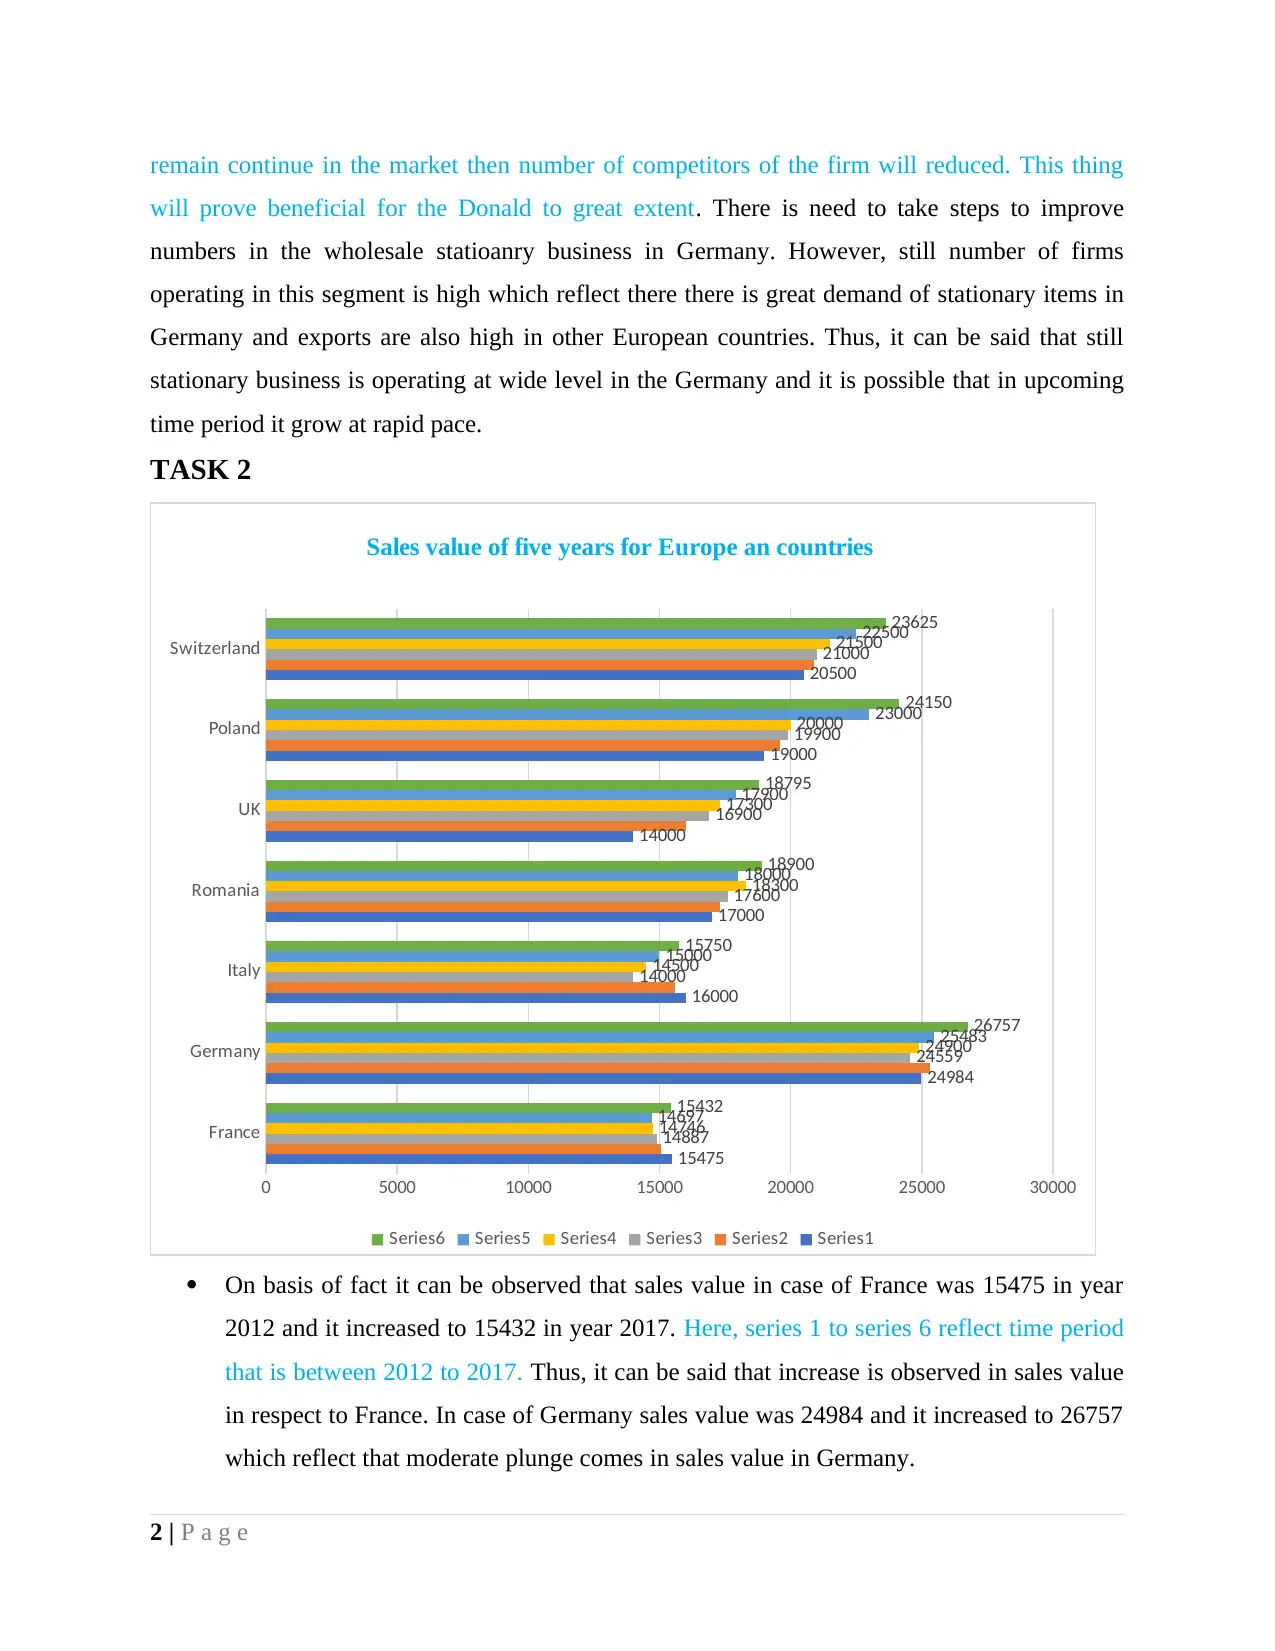
On basis of fact it can be observed that sales value in case of France was 15475 in year
2012 and it increased to 15432 in year 2017. Here, series 1 to series 6 reflect time period
that is between 2012 to 2017. Thus, it can be said that increase is observed in sales value
in respect to France. In case of Germany sales value was 24984 and it increased to 26757
which reflect that moderate plunge comes in sales value in Germany.
2 | P a g e
will prove beneficial for the Donald to great extent. There is need to take steps to improve
numbers in the wholesale statioanry business in Germany. However, still number of firms
operating in this segment is high which reflect there there is great demand of stationary items in
Germany and exports are also high in other European countries. Thus, it can be said that still
stationary business is operating at wide level in the Germany and it is possible that in upcoming
time period it grow at rapid pace.
TASK 2
France
Germany
Italy
Romania
UK
Poland
Switzerland
0 5000 10000 15000 20000 25000 30000
15475
24984
16000
17000
14000
19000
20500
14887
24559
14000
17600
16900
19900
21000
14746
24900
14500
18300
17300
20000
21500
14697
25483
15000
18000
17900
23000
22500
15432
26757
15750
18900
18795
24150
23625
Sales value of five years for Europe an countries
Series6 Series5 Series4 Series3 Series2 Series1
On basis of fact it can be observed that sales value in case of France was 15475 in year
2012 and it increased to 15432 in year 2017. Here, series 1 to series 6 reflect time period
that is between 2012 to 2017. Thus, it can be said that increase is observed in sales value
in respect to France. In case of Germany sales value was 24984 and it increased to 26757
which reflect that moderate plunge comes in sales value in Germany.
2 | P a g e
Paraphrase This Document
Need a fresh take? Get an instant paraphrase of this document with our AI Paraphraser
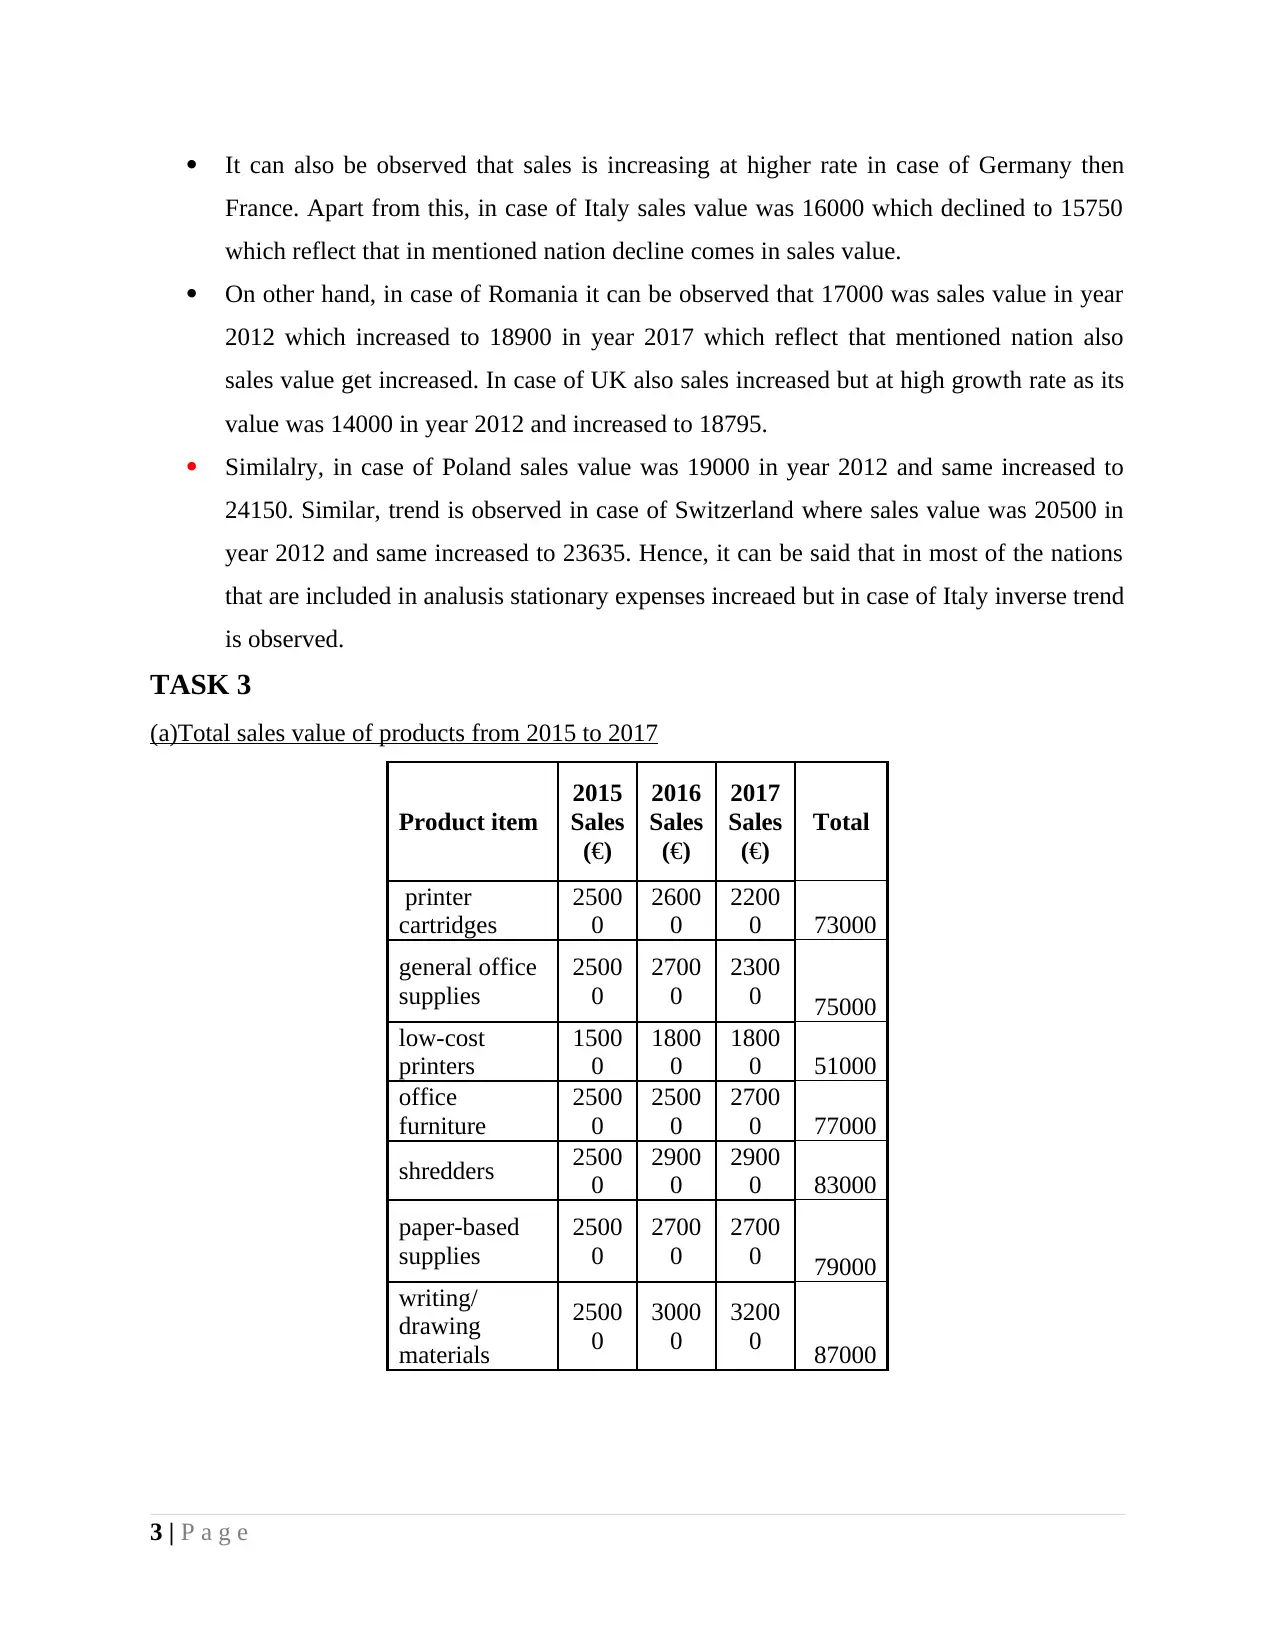
It can also be observed that sales is increasing at higher rate in case of Germany then
France. Apart from this, in case of Italy sales value was 16000 which declined to 15750
which reflect that in mentioned nation decline comes in sales value.
On other hand, in case of Romania it can be observed that 17000 was sales value in year
2012 which increased to 18900 in year 2017 which reflect that mentioned nation also
sales value get increased. In case of UK also sales increased but at high growth rate as its
value was 14000 in year 2012 and increased to 18795.
Similalry, in case of Poland sales value was 19000 in year 2012 and same increased to
24150. Similar, trend is observed in case of Switzerland where sales value was 20500 in
year 2012 and same increased to 23635. Hence, it can be said that in most of the nations
that are included in analusis stationary expenses increaed but in case of Italy inverse trend
is observed.
TASK 3
(a)Total sales value of products from 2015 to 2017
Product item
2015
Sales
(€)
2016
Sales
(€)
2017
Sales
(€)
Total
printer
cartridges
2500
0
2600
0
2200
0 73000
general office
supplies
2500
0
2700
0
2300
0 75000
low-cost
printers
1500
0
1800
0
1800
0 51000
office
furniture
2500
0
2500
0
2700
0 77000
shredders 2500
0
2900
0
2900
0 83000
paper-based
supplies
2500
0
2700
0
2700
0 79000
writing/
drawing
materials
2500
0
3000
0
3200
0 87000
3 | P a g e
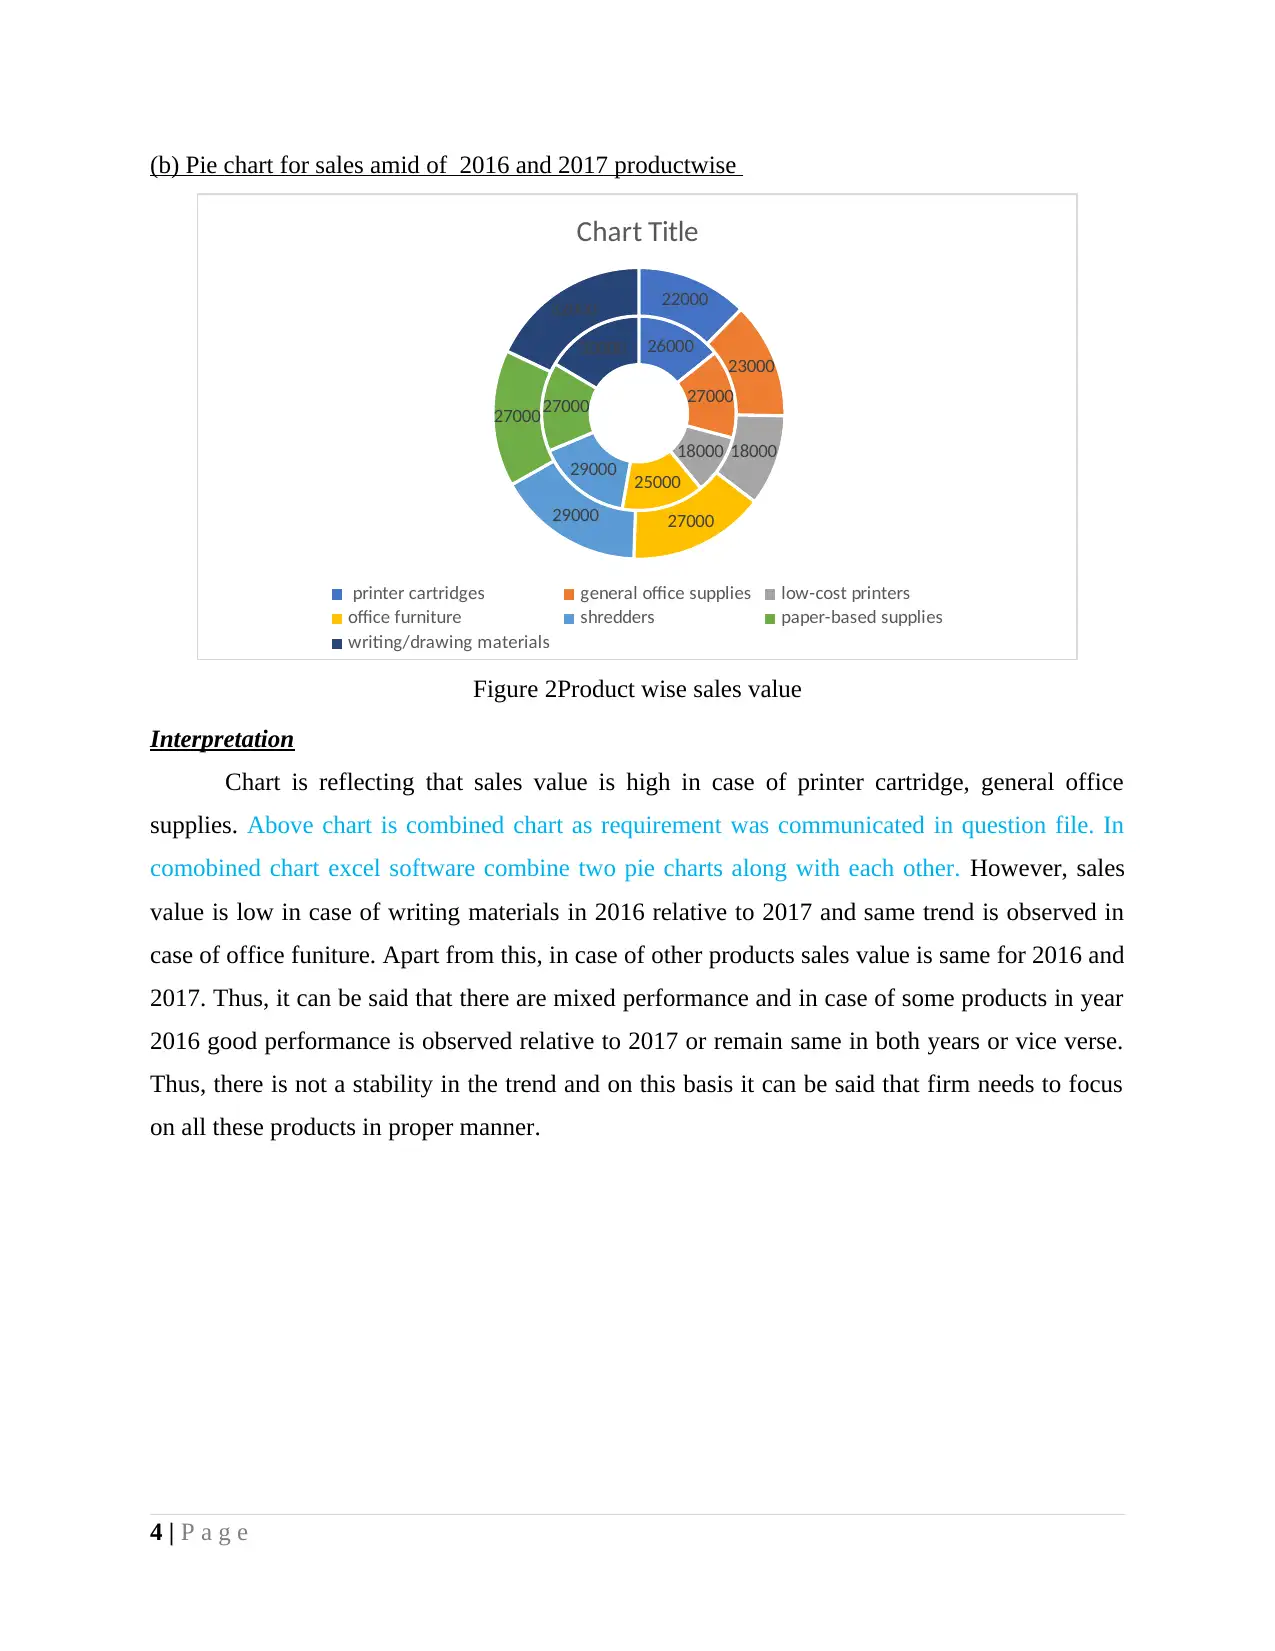
(b) Pie chart for sales amid of 2016 and 2017 productwise
26000
27000
18000
25000
29000
27000
30000
22000
23000
18000
2700029000
27000
32000
Chart Title
printer cartridges general office supplies low-cost printers
office furniture shredders paper-based supplies
writing/drawing materials
Figure 2Product wise sales value
Interpretation
Chart is reflecting that sales value is high in case of printer cartridge, general office
supplies. Above chart is combined chart as requirement was communicated in question file. In
comobined chart excel software combine two pie charts along with each other. However, sales
value is low in case of writing materials in 2016 relative to 2017 and same trend is observed in
case of office funiture. Apart from this, in case of other products sales value is same for 2016 and
2017. Thus, it can be said that there are mixed performance and in case of some products in year
2016 good performance is observed relative to 2017 or remain same in both years or vice verse.
Thus, there is not a stability in the trend and on this basis it can be said that firm needs to focus
on all these products in proper manner.
4 | P a g e
⊘ This is a preview!⊘
Do you want full access?
Subscribe today to unlock all pages.
Trusted by 1+ million students worldwide
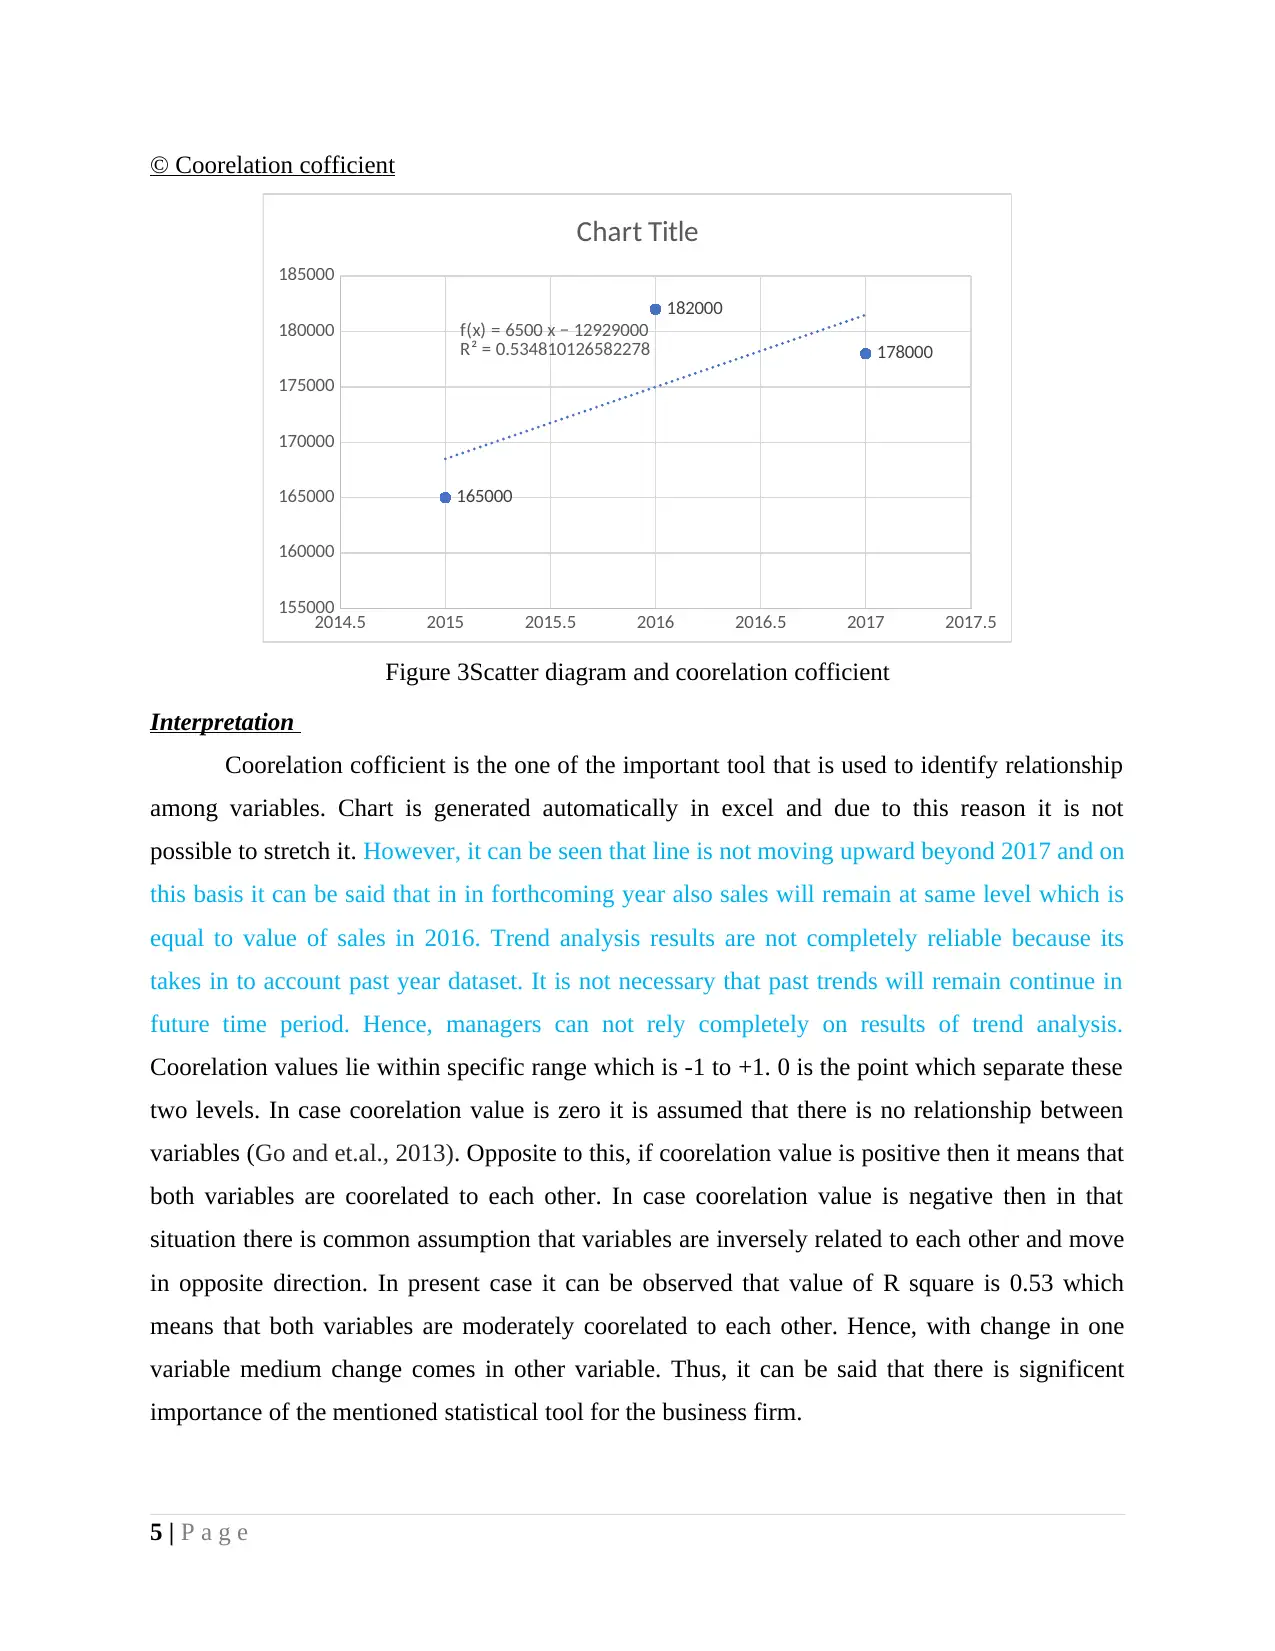
© Coorelation cofficient
2014.5 2015 2015.5 2016 2016.5 2017 2017.5
155000
160000
165000
170000
175000
180000
185000
165000
182000
178000
f(x) = 6500 x − 12929000
R² = 0.534810126582278
Chart Title
Figure 3Scatter diagram and coorelation cofficient
Interpretation
Coorelation cofficient is the one of the important tool that is used to identify relationship
among variables. Chart is generated automatically in excel and due to this reason it is not
possible to stretch it. However, it can be seen that line is not moving upward beyond 2017 and on
this basis it can be said that in in forthcoming year also sales will remain at same level which is
equal to value of sales in 2016. Trend analysis results are not completely reliable because its
takes in to account past year dataset. It is not necessary that past trends will remain continue in
future time period. Hence, managers can not rely completely on results of trend analysis.
Coorelation values lie within specific range which is -1 to +1. 0 is the point which separate these
two levels. In case coorelation value is zero it is assumed that there is no relationship between
variables (Go and et.al., 2013). Opposite to this, if coorelation value is positive then it means that
both variables are coorelated to each other. In case coorelation value is negative then in that
situation there is common assumption that variables are inversely related to each other and move
in opposite direction. In present case it can be observed that value of R square is 0.53 which
means that both variables are moderately coorelated to each other. Hence, with change in one
variable medium change comes in other variable. Thus, it can be said that there is significent
importance of the mentioned statistical tool for the business firm.
5 | P a g e
Paraphrase This Document
Need a fresh take? Get an instant paraphrase of this document with our AI Paraphraser
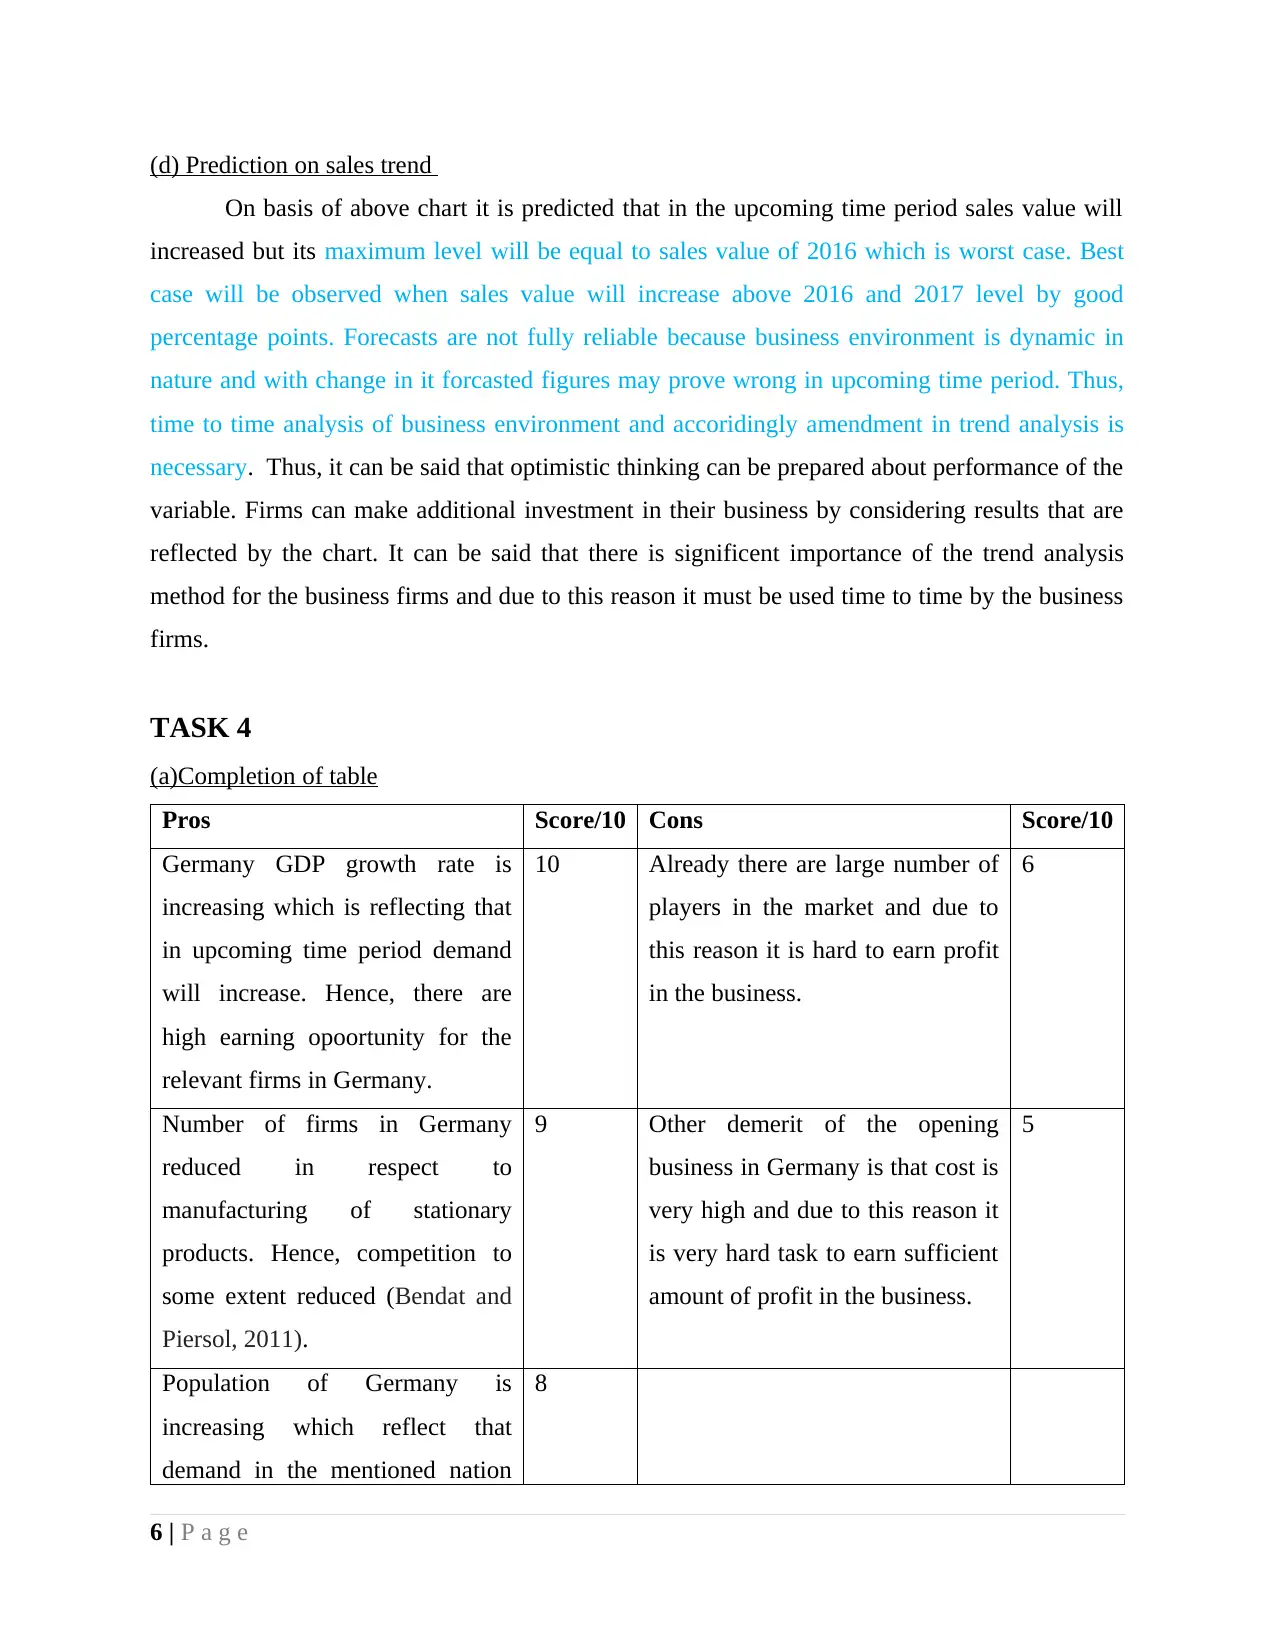
(d) Prediction on sales trend
On basis of above chart it is predicted that in the upcoming time period sales value will
increased but its maximum level will be equal to sales value of 2016 which is worst case. Best
case will be observed when sales value will increase above 2016 and 2017 level by good
percentage points. Forecasts are not fully reliable because business environment is dynamic in
nature and with change in it forcasted figures may prove wrong in upcoming time period. Thus,
time to time analysis of business environment and accoridingly amendment in trend analysis is
necessary. Thus, it can be said that optimistic thinking can be prepared about performance of the
variable. Firms can make additional investment in their business by considering results that are
reflected by the chart. It can be said that there is significent importance of the trend analysis
method for the business firms and due to this reason it must be used time to time by the business
firms.
TASK 4
(a)Completion of table
Pros Score/10 Cons Score/10
Germany GDP growth rate is
increasing which is reflecting that
in upcoming time period demand
will increase. Hence, there are
high earning opoortunity for the
relevant firms in Germany.
10 Already there are large number of
players in the market and due to
this reason it is hard to earn profit
in the business.
6
Number of firms in Germany
reduced in respect to
manufacturing of stationary
products. Hence, competition to
some extent reduced (Bendat and
Piersol, 2011).
9 Other demerit of the opening
business in Germany is that cost is
very high and due to this reason it
is very hard task to earn sufficient
amount of profit in the business.
5
Population of Germany is
increasing which reflect that
demand in the mentioned nation
8
6 | P a g e
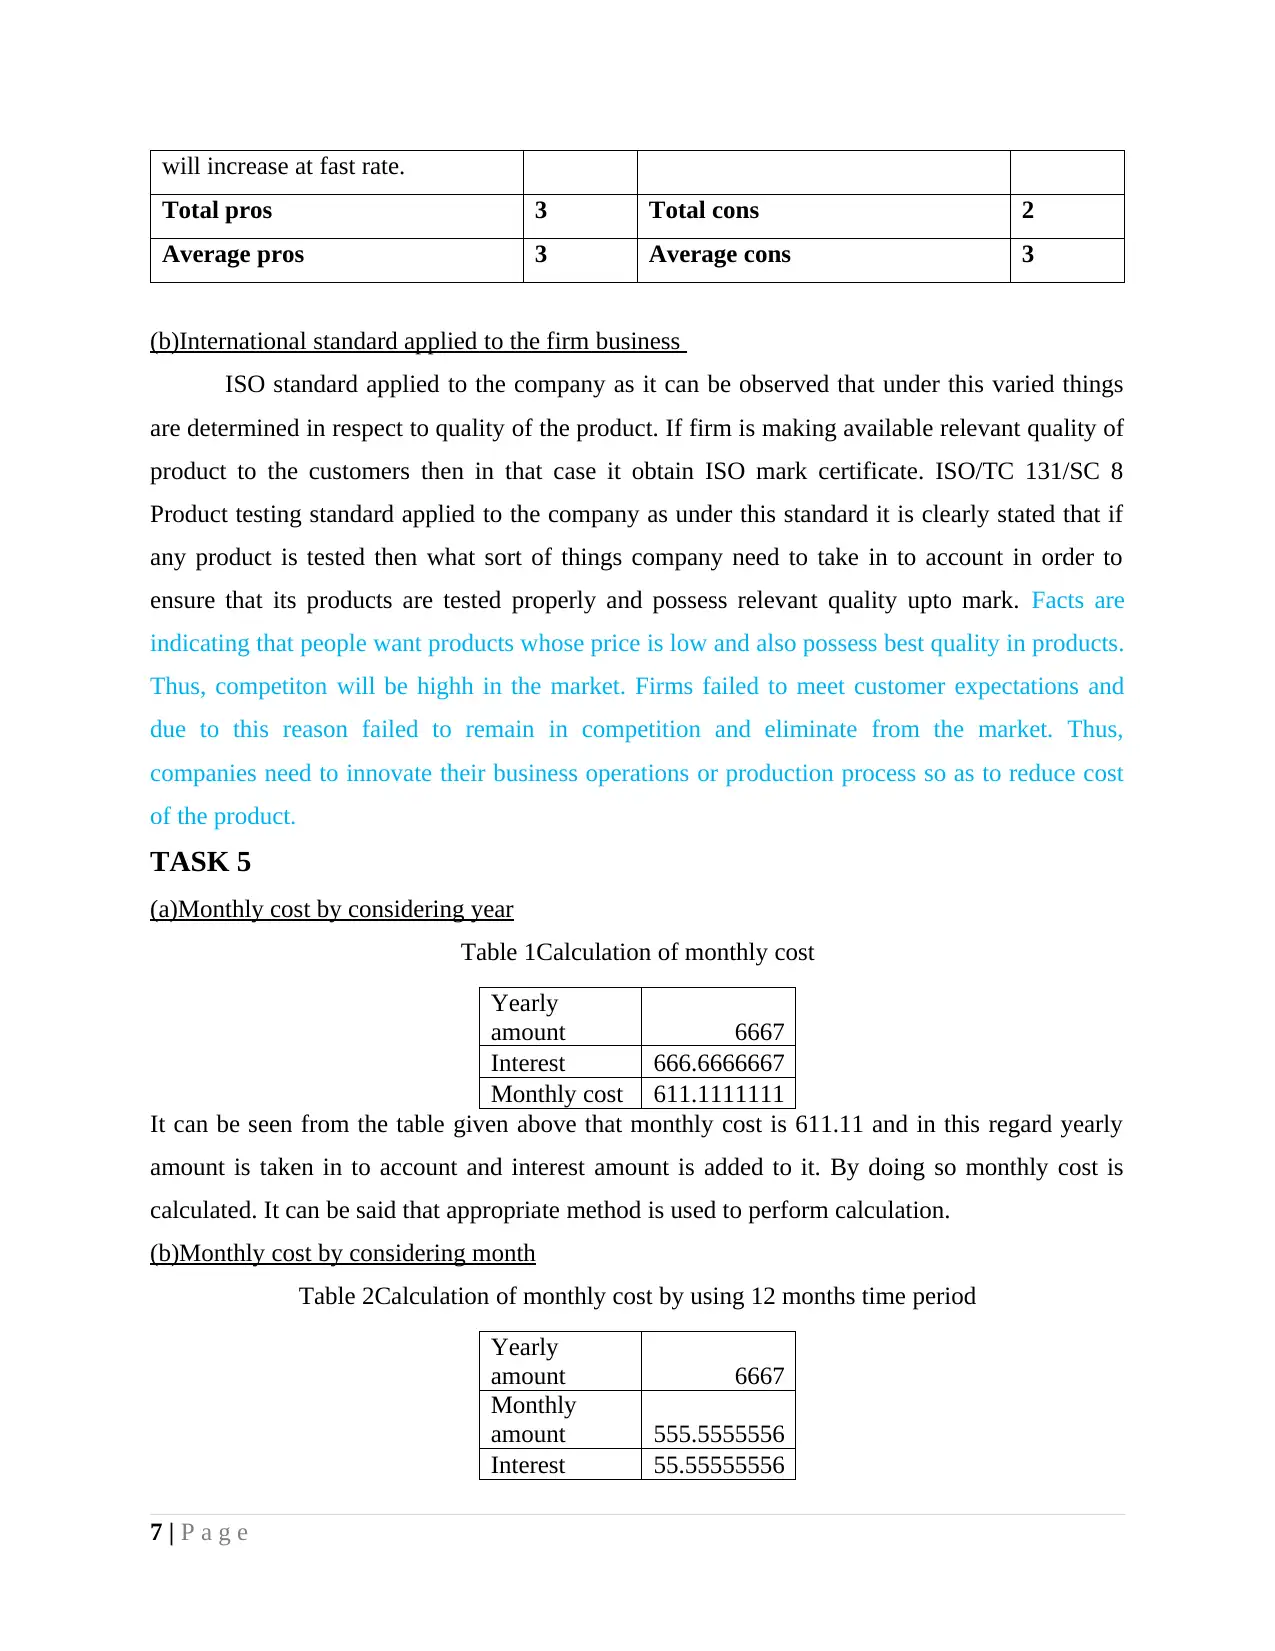
will increase at fast rate.
Total pros 3 Total cons 2
Average pros 3 Average cons 3
(b)International standard applied to the firm business
ISO standard applied to the company as it can be observed that under this varied things
are determined in respect to quality of the product. If firm is making available relevant quality of
product to the customers then in that case it obtain ISO mark certificate. ISO/TC 131/SC 8
Product testing standard applied to the company as under this standard it is clearly stated that if
any product is tested then what sort of things company need to take in to account in order to
ensure that its products are tested properly and possess relevant quality upto mark. Facts are
indicating that people want products whose price is low and also possess best quality in products.
Thus, competiton will be highh in the market. Firms failed to meet customer expectations and
due to this reason failed to remain in competition and eliminate from the market. Thus,
companies need to innovate their business operations or production process so as to reduce cost
of the product.
TASK 5
(a)Monthly cost by considering year
Table 1Calculation of monthly cost
Yearly
amount 6667
Interest 666.6666667
Monthly cost 611.1111111
It can be seen from the table given above that monthly cost is 611.11 and in this regard yearly
amount is taken in to account and interest amount is added to it. By doing so monthly cost is
calculated. It can be said that appropriate method is used to perform calculation.
(b)Monthly cost by considering month
Table 2Calculation of monthly cost by using 12 months time period
Yearly
amount 6667
Monthly
amount 555.5555556
Interest 55.55555556
7 | P a g e
⊘ This is a preview!⊘
Do you want full access?
Subscribe today to unlock all pages.
Trusted by 1+ million students worldwide
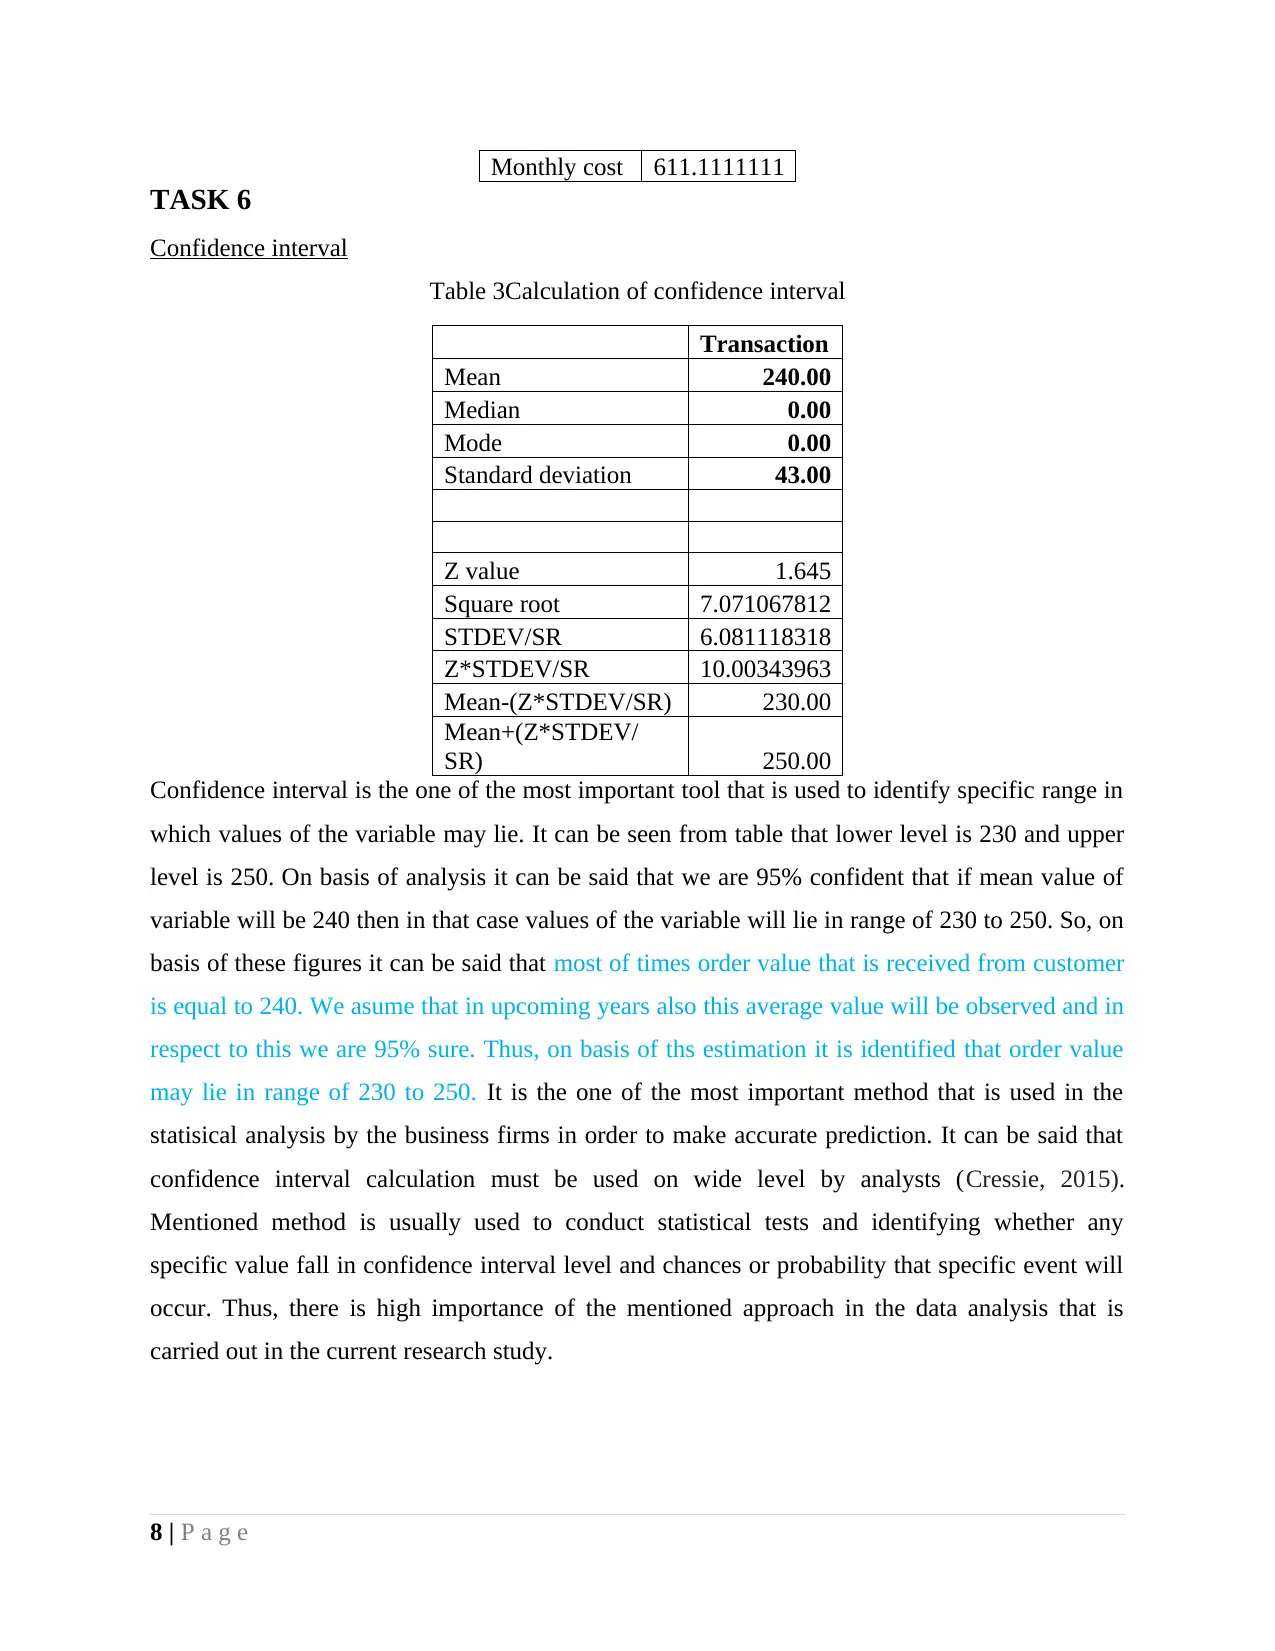
Monthly cost 611.1111111
TASK 6
Confidence interval
Table 3Calculation of confidence interval
Transaction
Mean 240.00
Median 0.00
Mode 0.00
Standard deviation 43.00
Z value 1.645
Square root 7.071067812
STDEV/SR 6.081118318
Z*STDEV/SR 10.00343963
Mean-(Z*STDEV/SR) 230.00
Mean+(Z*STDEV/
SR) 250.00
Confidence interval is the one of the most important tool that is used to identify specific range in
which values of the variable may lie. It can be seen from table that lower level is 230 and upper
level is 250. On basis of analysis it can be said that we are 95% confident that if mean value of
variable will be 240 then in that case values of the variable will lie in range of 230 to 250. So, on
basis of these figures it can be said that most of times order value that is received from customer
is equal to 240. We asume that in upcoming years also this average value will be observed and in
respect to this we are 95% sure. Thus, on basis of ths estimation it is identified that order value
may lie in range of 230 to 250. It is the one of the most important method that is used in the
statisical analysis by the business firms in order to make accurate prediction. It can be said that
confidence interval calculation must be used on wide level by analysts (Cressie, 2015).
Mentioned method is usually used to conduct statistical tests and identifying whether any
specific value fall in confidence interval level and chances or probability that specific event will
occur. Thus, there is high importance of the mentioned approach in the data analysis that is
carried out in the current research study.
8 | P a g e
Paraphrase This Document
Need a fresh take? Get an instant paraphrase of this document with our AI Paraphraser
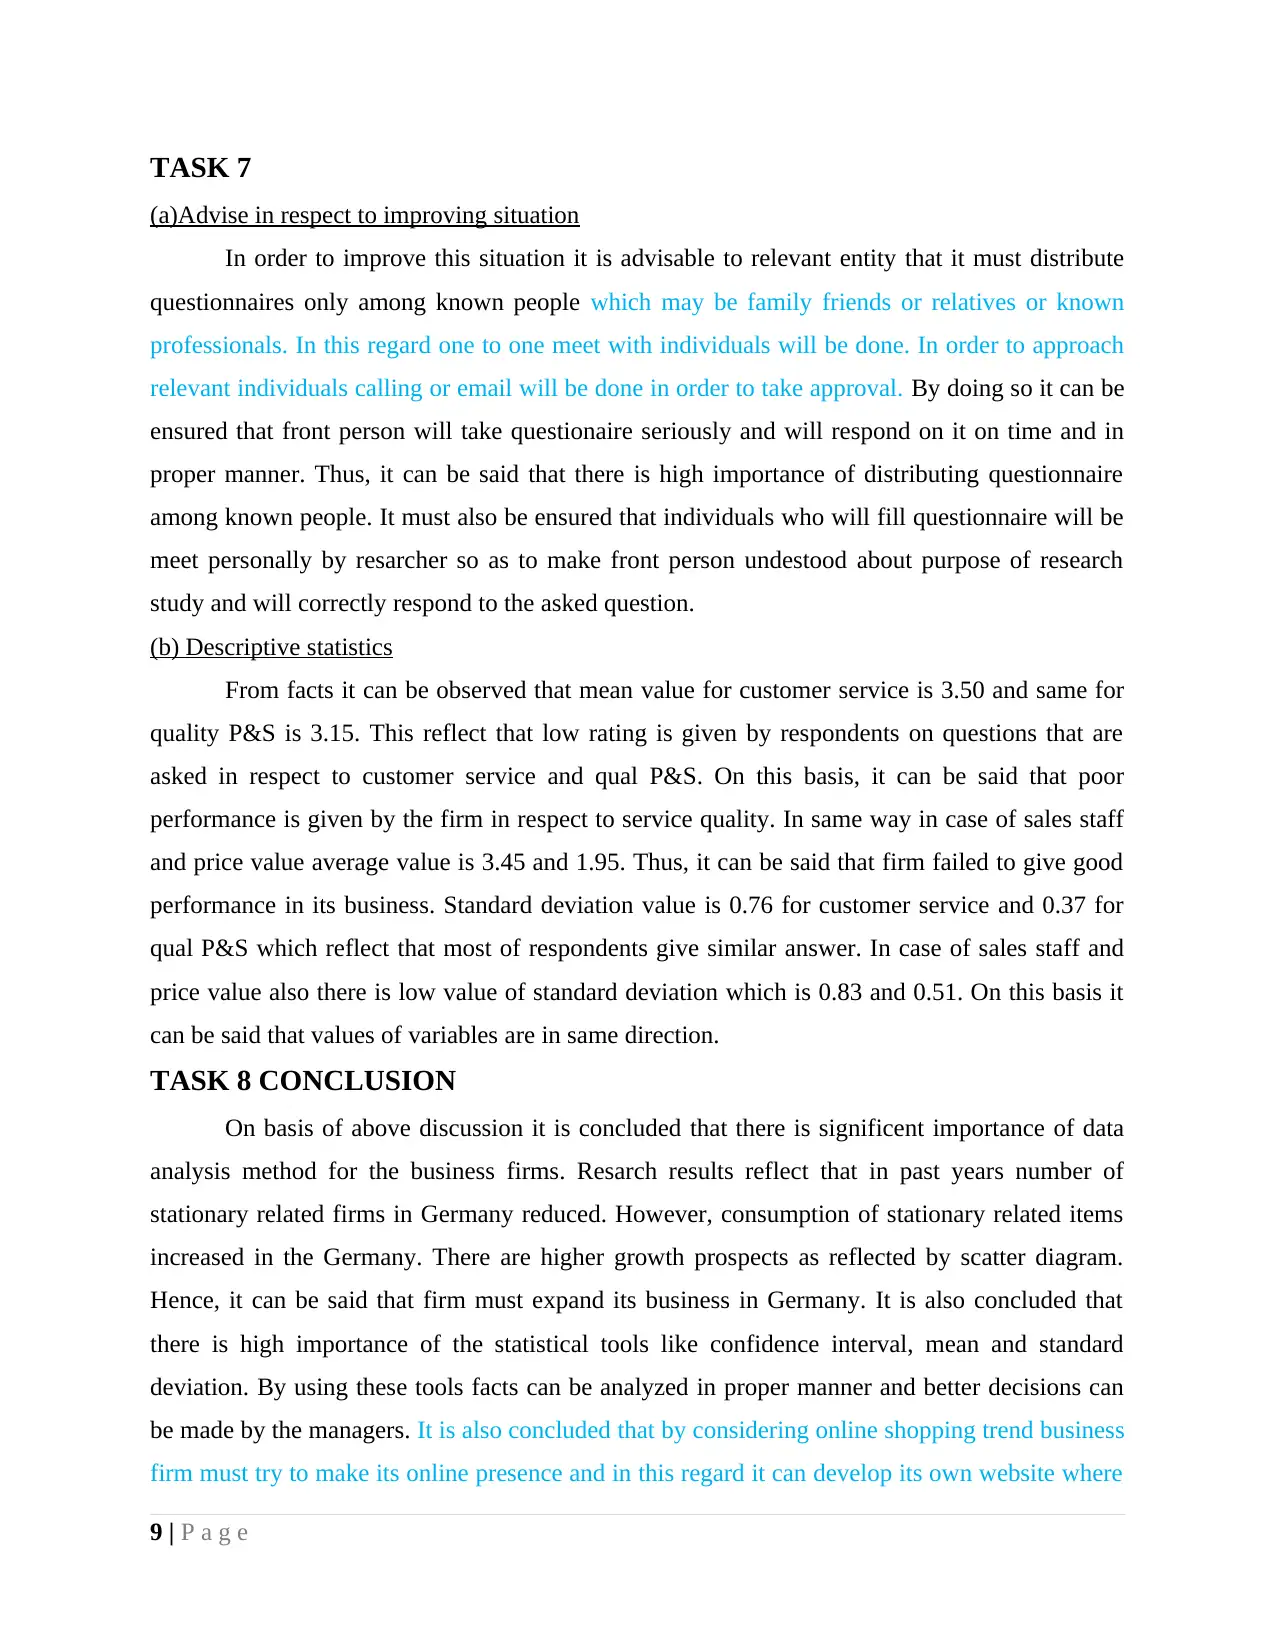
TASK 7
(a)Advise in respect to improving situation
In order to improve this situation it is advisable to relevant entity that it must distribute
questionnaires only among known people which may be family friends or relatives or known
professionals. In this regard one to one meet with individuals will be done. In order to approach
relevant individuals calling or email will be done in order to take approval. By doing so it can be
ensured that front person will take questionaire seriously and will respond on it on time and in
proper manner. Thus, it can be said that there is high importance of distributing questionnaire
among known people. It must also be ensured that individuals who will fill questionnaire will be
meet personally by resarcher so as to make front person undestood about purpose of research
study and will correctly respond to the asked question.
(b) Descriptive statistics
From facts it can be observed that mean value for customer service is 3.50 and same for
quality P&S is 3.15. This reflect that low rating is given by respondents on questions that are
asked in respect to customer service and qual P&S. On this basis, it can be said that poor
performance is given by the firm in respect to service quality. In same way in case of sales staff
and price value average value is 3.45 and 1.95. Thus, it can be said that firm failed to give good
performance in its business. Standard deviation value is 0.76 for customer service and 0.37 for
qual P&S which reflect that most of respondents give similar answer. In case of sales staff and
price value also there is low value of standard deviation which is 0.83 and 0.51. On this basis it
can be said that values of variables are in same direction.
TASK 8 CONCLUSION
On basis of above discussion it is concluded that there is significent importance of data
analysis method for the business firms. Resarch results reflect that in past years number of
stationary related firms in Germany reduced. However, consumption of stationary related items
increased in the Germany. There are higher growth prospects as reflected by scatter diagram.
Hence, it can be said that firm must expand its business in Germany. It is also concluded that
there is high importance of the statistical tools like confidence interval, mean and standard
deviation. By using these tools facts can be analyzed in proper manner and better decisions can
be made by the managers. It is also concluded that by considering online shopping trend business
firm must try to make its online presence and in this regard it can develop its own website where
9 | P a g e
retail shopkeeprs and people can place order. According to demand inventory will be maintained
in the business which will lead to low cost and proper distribution of goods. In respect to
improving quality it is recommended that firms must carry out R&D activities or must upgrade
technology base by using new machines. In order to finance firm must adopt varied sources like
private equity, joint venture or strategic business unit. If it is not possible to enter into German
market through these ways then in that situation mortgage loan must be taken from the banks.
10 | P a g e
⊘ This is a preview!⊘
Do you want full access?
Subscribe today to unlock all pages.
Trusted by 1+ million students worldwide
1 out of 15
Related Documents


Your All-in-One AI-Powered Toolkit for Academic Success.
+13062052269
info@desklib.com
Available 24*7 on WhatsApp / Email
![[object Object]](/_next/static/media/star-bottom.7253800d.svg)
Unlock your academic potential
Copyright © 2020–2026 A2Z Services. All Rights Reserved. Developed and managed by ZUCOL.