Business Valuation Project: Financial Modeling and Analysis Report

Verified

Added on  2021/01/03

|6
|583
|481
Project
AI Summary
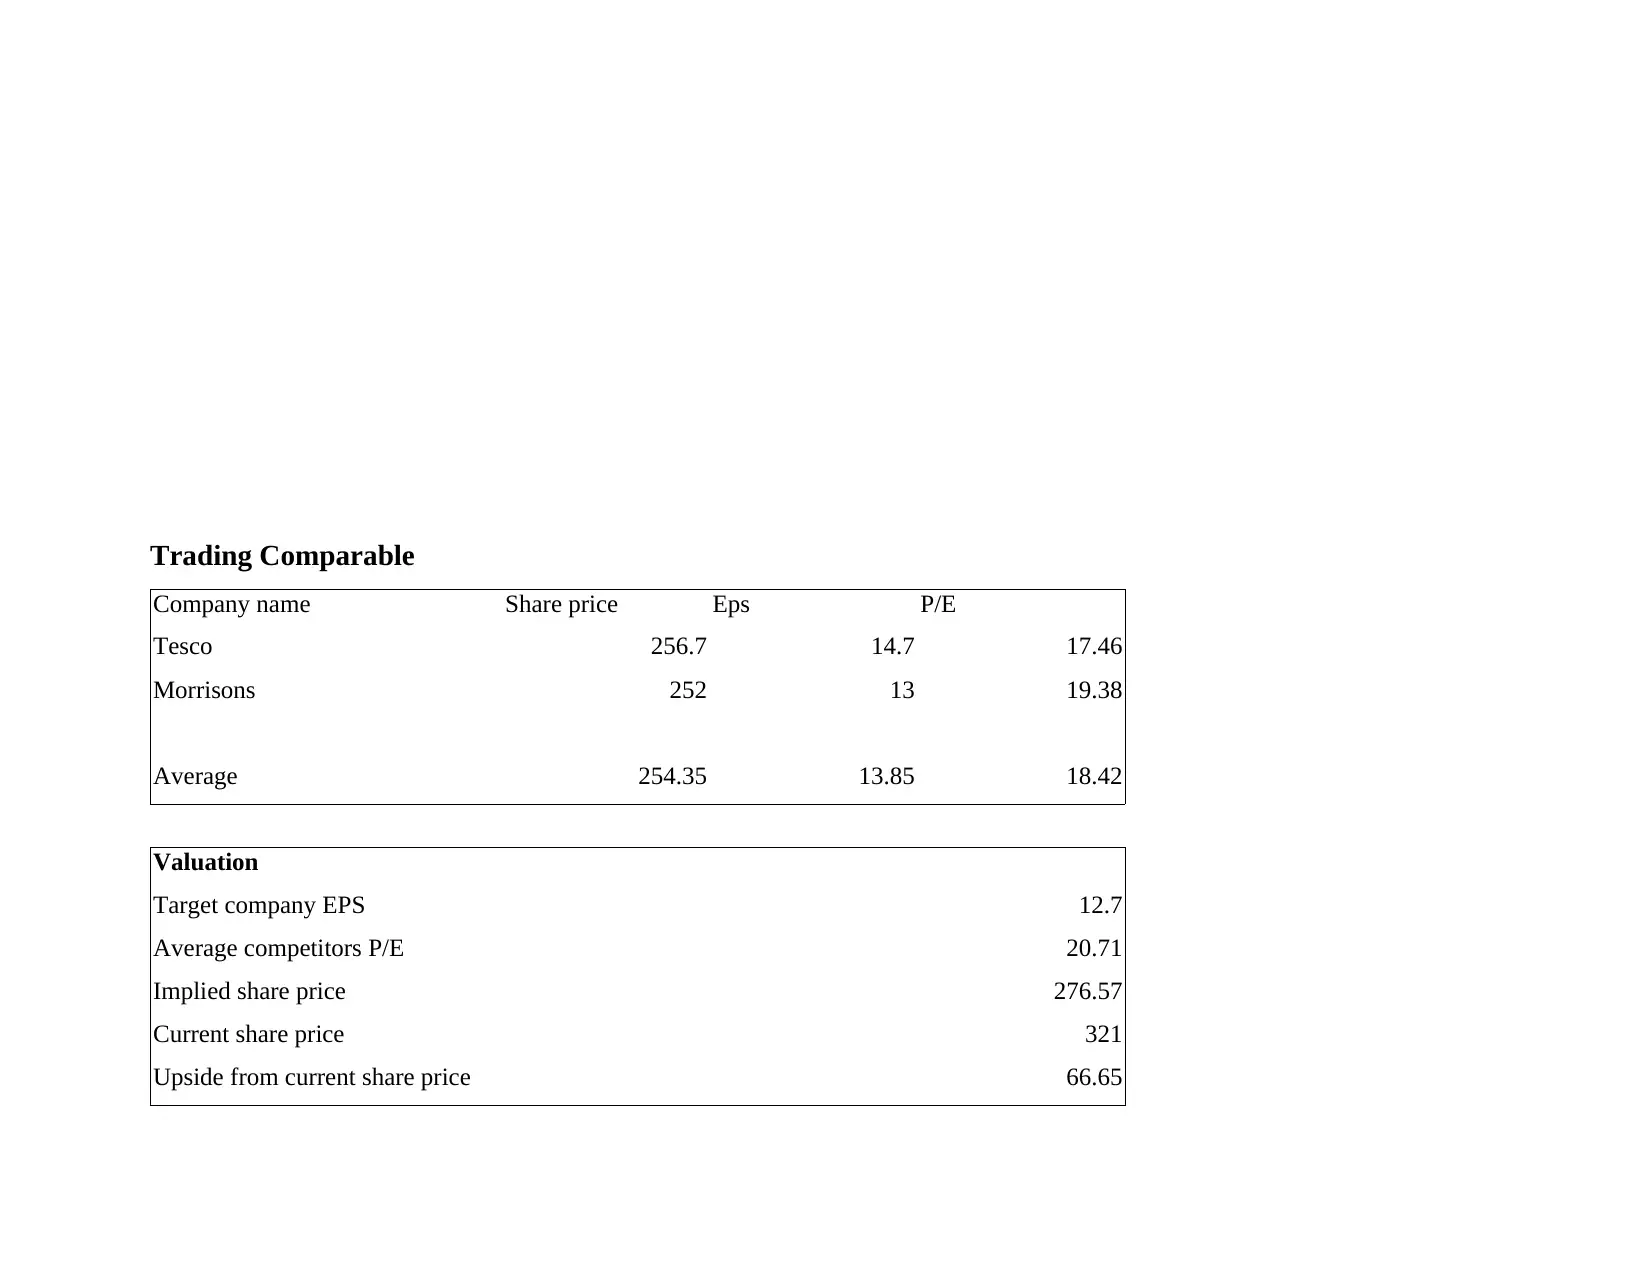
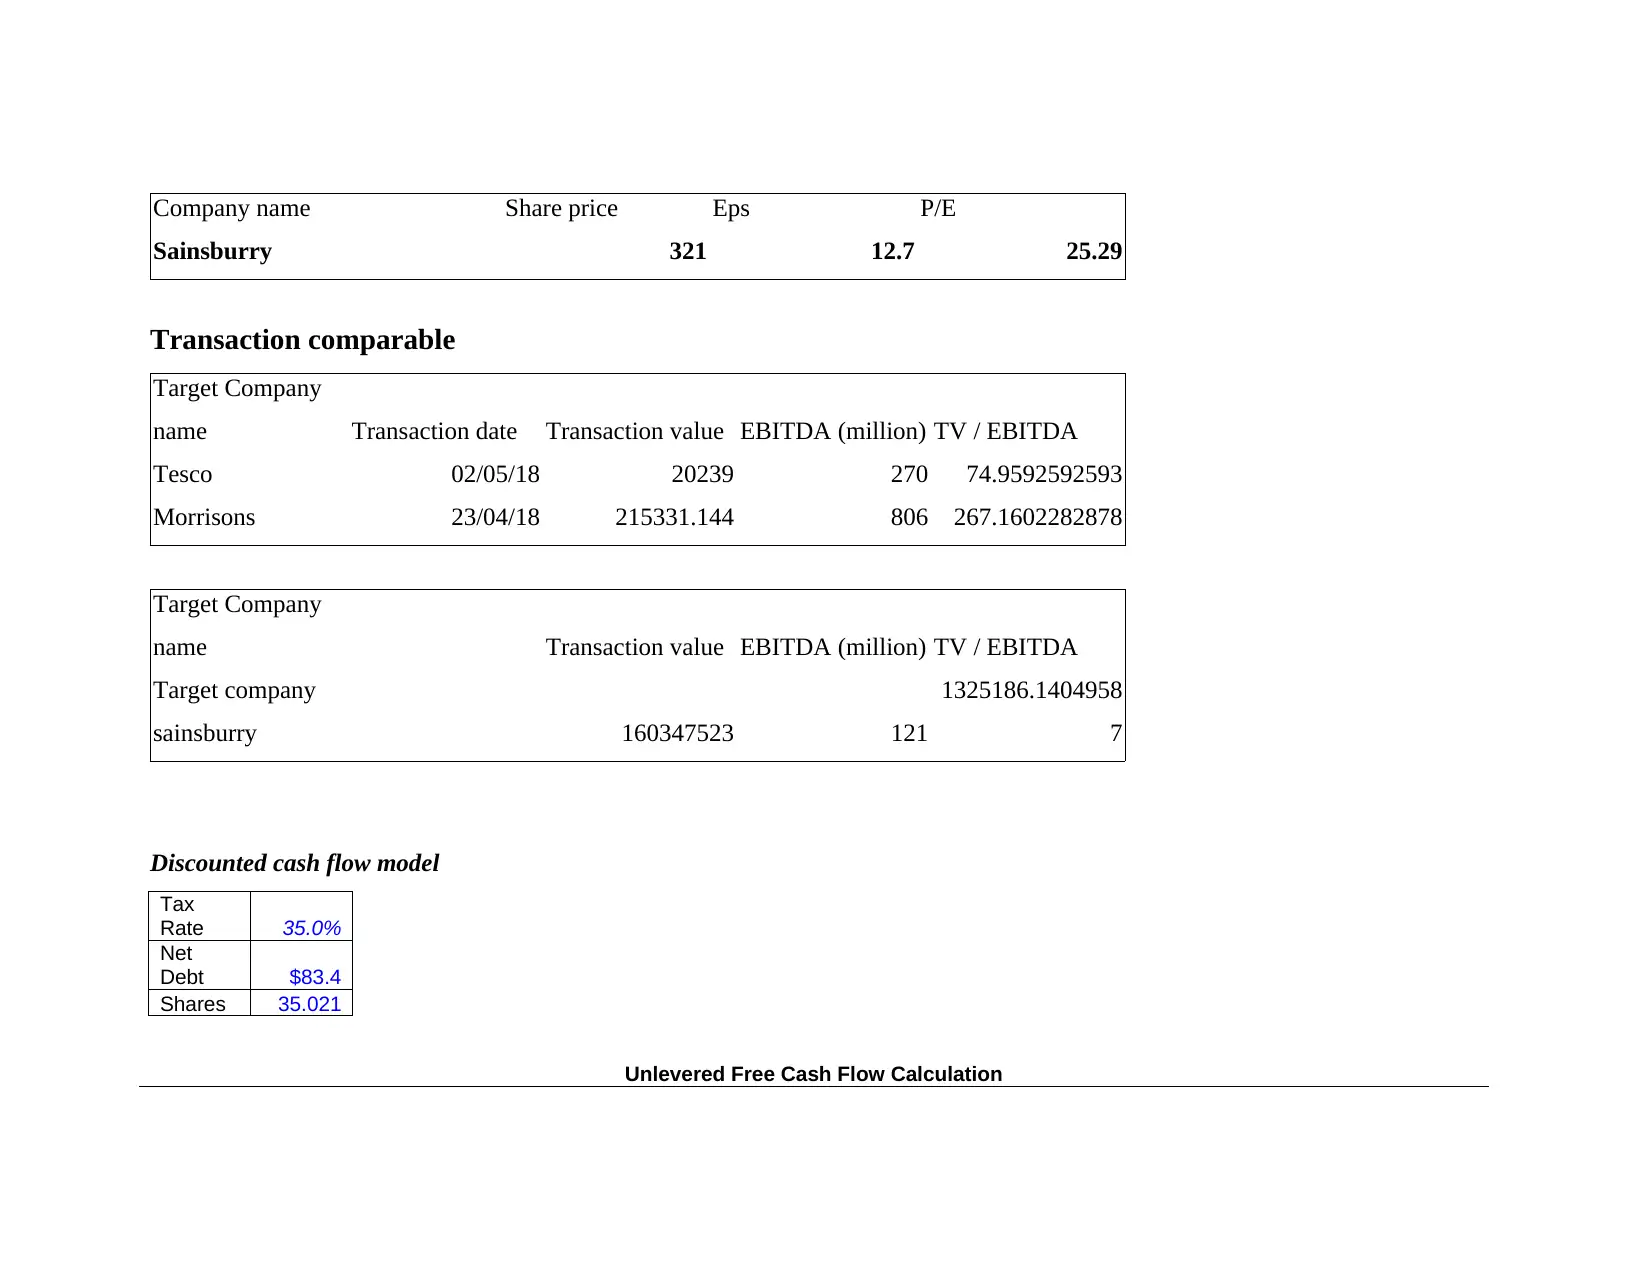
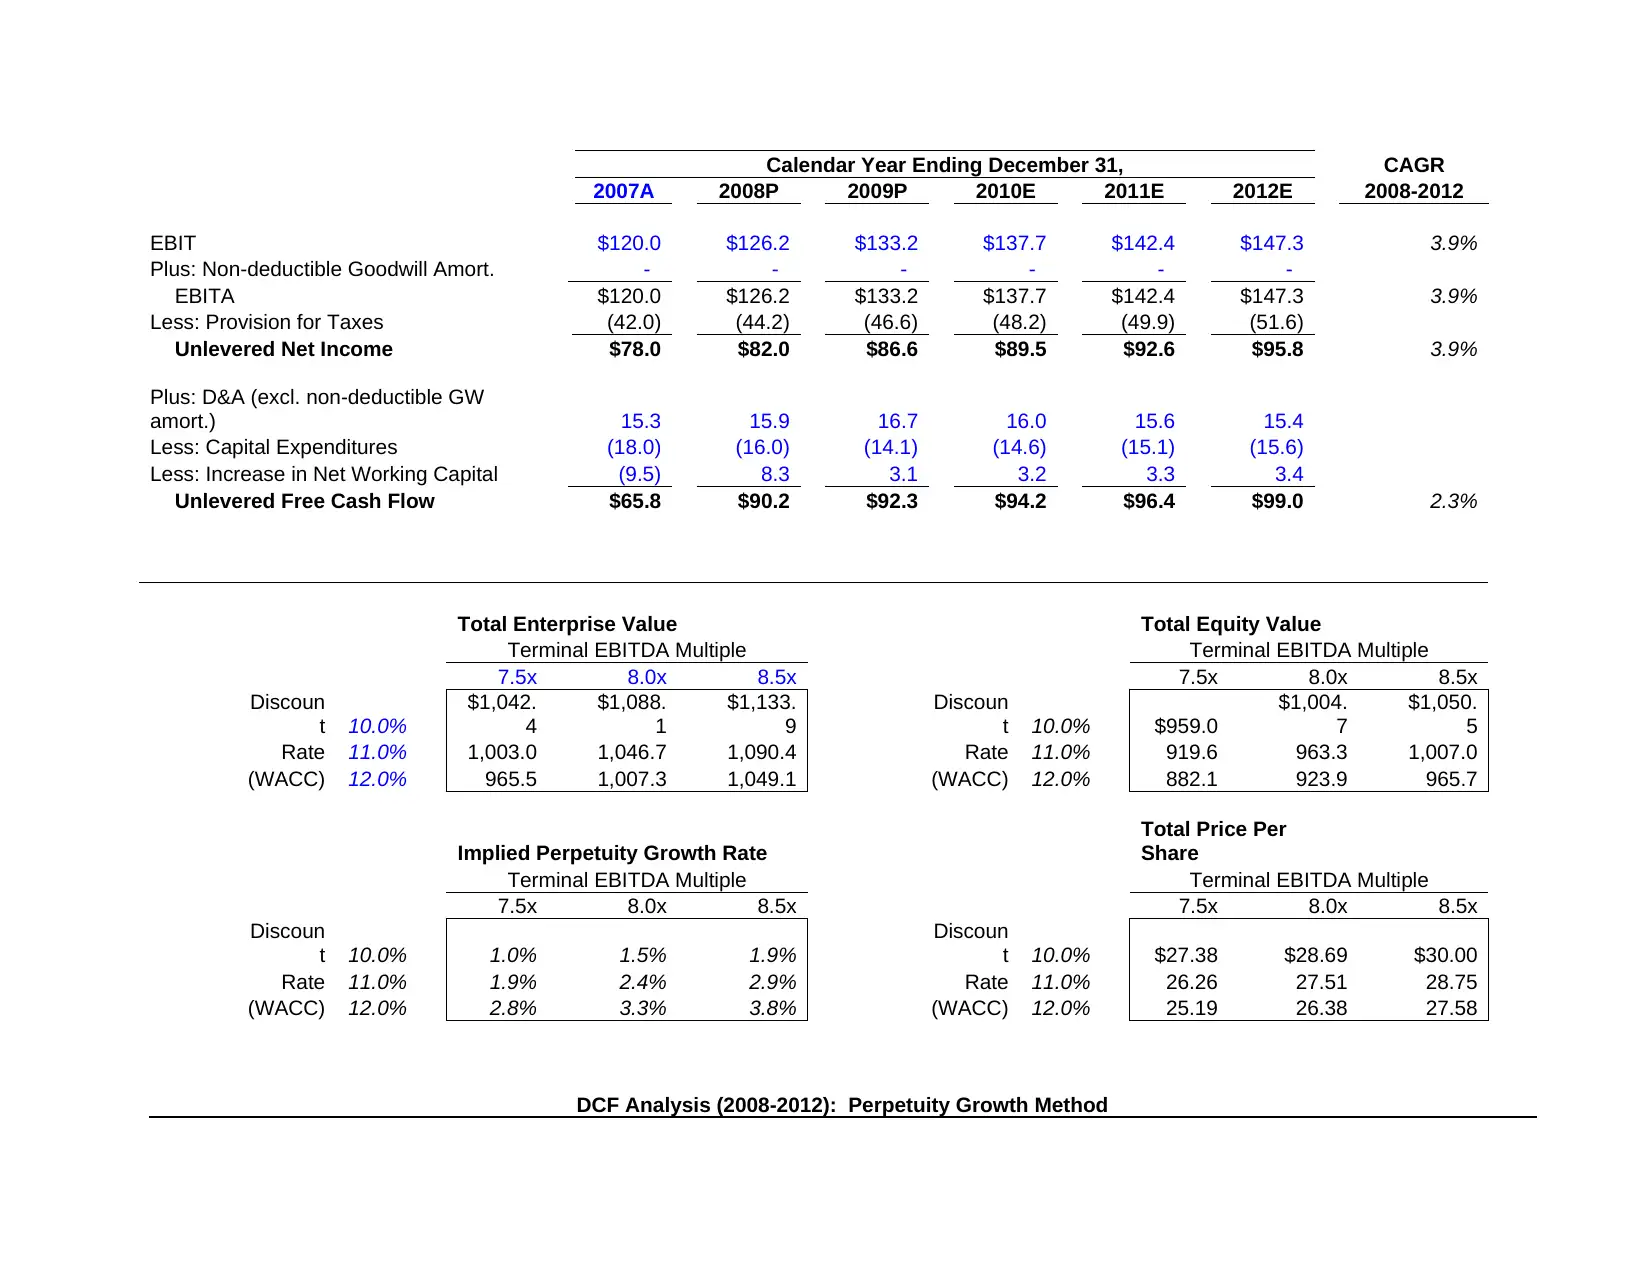
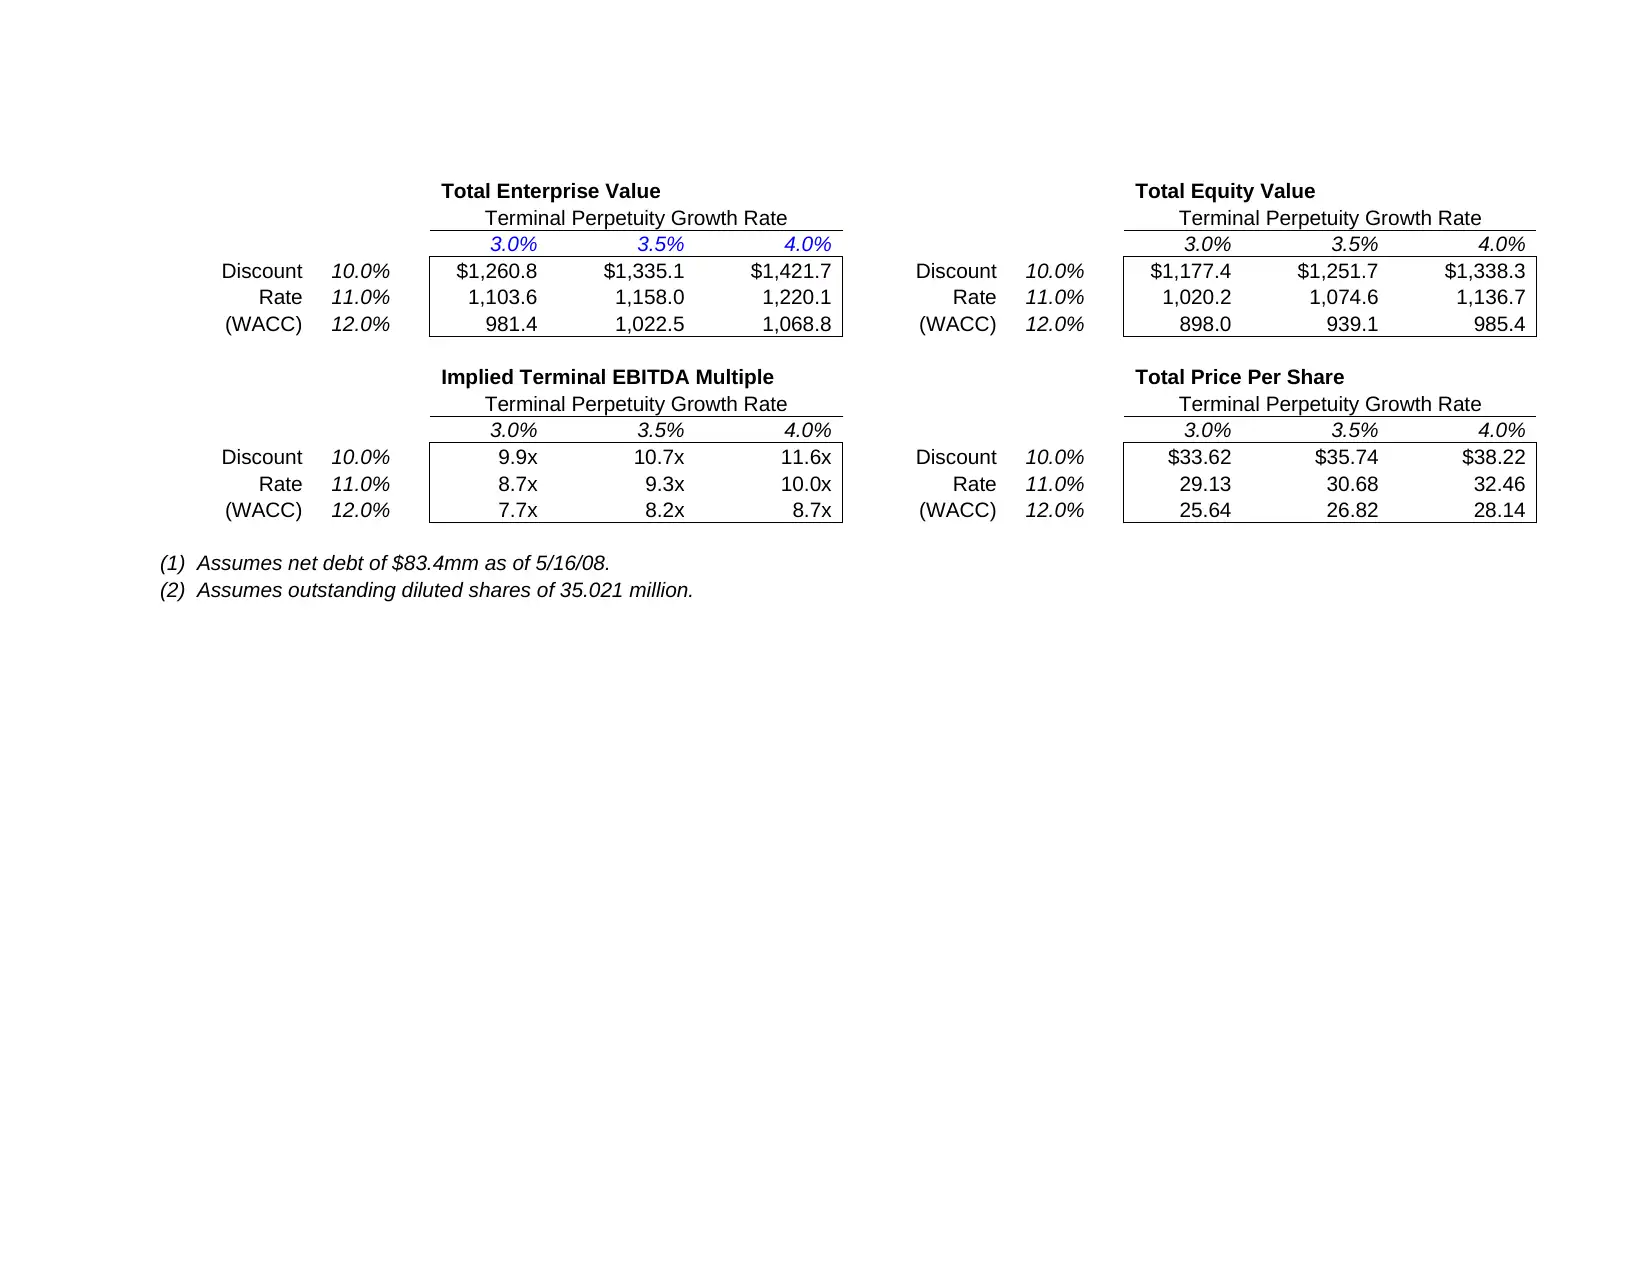
This project presents a comprehensive business valuation analysis, utilizing various financial modeling techniques. The analysis begins with an introduction and includes detailed tables for trading comparables, transaction comparables, and a discounted cash flow model. The trading comparable section compares share prices, EPS, and P/E ratios of companies like Tesco and Morrisons, calculating an average and deriving an implied share price. The transaction comparable section examines transaction values, EBITDA, and TV/EBITDA ratios. The discounted cash flow model provides a detailed analysis of the terminal perpetuity growth rate and discount rate, calculating total enterprise value, total equity value, and implied terminal EBITDA multiple. The project concludes with an implied share price based on the different valuation methods.
tabler-icon-diamond-filled.svg

Contribute Materials

Your contribution can guide someone’s learning journey. Share your documents today.
Document Page
Business Valuation
tabler-icon-diamond-filled.svg

Secure Best Marks with AI Grader

Need help grading? Try our AI Grader for instant feedback on your assignments.
Document Page
TABLE OF CONTENTS
INTRODUCTION...........................................................................................................................3
CONCLUSION................................................................................................................................3
REFERENCES................................................................................................................................4
Document Page
Trading Comparable
Company name Share price Eps P/E
Tesco 256.7 14.7 17.46
Morrisons 252 13 19.38
Average 254.35 13.85 18.42
Valuation
Target company EPS 12.7
Average competitors P/E 20.71
Implied share price 276.57
Current share price 321
Upside from current share price 66.65
Document Page
Company name Share price Eps P/E
Sainsburry 321 12.7 25.29
Transaction comparable
Target Company
name Transaction date Transaction value EBITDA (million) TV / EBITDA
Tesco 02/05/18 20239 270 74.9592592593
Morrisons 23/04/18 215331.144 806 267.1602282878
Target Company
name Transaction value EBITDA (million) TV / EBITDA
Target company
sainsburry 160347523 121
1325186.1404958
7
Discounted cash flow model
Tax
Rate 35.0%
Net
Debt $83.4
Shares 35.021
Unlevered Free Cash Flow Calculation
tabler-icon-diamond-filled.svg

Secure Best Marks with AI Grader

Need help grading? Try our AI Grader for instant feedback on your assignments.
Document Page
Calendar Year Ending December 31, CAGR
2007A 2008P 2009P 2010E 2011E 2012E 2008-2012
EBIT $120.0 $126.2 $133.2 $137.7 $142.4 $147.3 3.9%
Plus: Non-deductible Goodwill Amort. - - - - - -
EBITA $120.0 $126.2 $133.2 $137.7 $142.4 $147.3 3.9%
Less: Provision for Taxes (42.0) (44.2) (46.6) (48.2) (49.9) (51.6)
Unlevered Net Income $78.0 $82.0 $86.6 $89.5 $92.6 $95.8 3.9%
Plus: D&A (excl. non-deductible GW
amort.) 15.3 15.9 16.7 16.0 15.6 15.4
Less: Capital Expenditures (18.0) (16.0) (14.1) (14.6) (15.1) (15.6)
Less: Increase in Net Working Capital (9.5) 8.3 3.1 3.2 3.3 3.4
Unlevered Free Cash Flow $65.8 $90.2 $92.3 $94.2 $96.4 $99.0 2.3%
Total Enterprise Value Total Equity Value
Terminal EBITDA Multiple Terminal EBITDA Multiple
7.5x 8.0x 8.5x 7.5x 8.0x 8.5x
Discoun
t 10.0%
$1,042.
4
$1,088.
1
$1,133.
9
Discoun
t 10.0% $959.0
$1,004.
7
$1,050.
5
Rate 11.0% 1,003.0 1,046.7 1,090.4 Rate 11.0% 919.6 963.3 1,007.0
(WACC) 12.0% 965.5 1,007.3 1,049.1 (WACC) 12.0% 882.1 923.9 965.7
Implied Perpetuity Growth Rate
Total Price Per
Share
Terminal EBITDA Multiple Terminal EBITDA Multiple
7.5x 8.0x 8.5x 7.5x 8.0x 8.5x
Discoun
t 10.0% 1.0% 1.5% 1.9%
Discoun
t 10.0% $27.38 $28.69 $30.00
Rate 11.0% 1.9% 2.4% 2.9% Rate 11.0% 26.26 27.51 28.75
(WACC) 12.0% 2.8% 3.3% 3.8% (WACC) 12.0% 25.19 26.38 27.58
DCF Analysis (2008-2012): Perpetuity Growth Method
Document Page
Total Enterprise Value Total Equity Value
Terminal Perpetuity Growth Rate Terminal Perpetuity Growth Rate
3.0% 3.5% 4.0% 3.0% 3.5% 4.0%
Discount 10.0% $1,260.8 $1,335.1 $1,421.7 Discount 10.0% $1,177.4 $1,251.7 $1,338.3
Rate 11.0% 1,103.6 1,158.0 1,220.1 Rate 11.0% 1,020.2 1,074.6 1,136.7
(WACC) 12.0% 981.4 1,022.5 1,068.8 (WACC) 12.0% 898.0 939.1 985.4
Implied Terminal EBITDA Multiple Total Price Per Share
Terminal Perpetuity Growth Rate Terminal Perpetuity Growth Rate
3.0% 3.5% 4.0% 3.0% 3.5% 4.0%
Discount 10.0% 9.9x 10.7x 11.6x Discount 10.0% $33.62 $35.74 $38.22
Rate 11.0% 8.7x 9.3x 10.0x Rate 11.0% 29.13 30.68 32.46
(WACC) 12.0% 7.7x 8.2x 8.7x (WACC) 12.0% 25.64 26.82 28.14
(1) Assumes net debt of $83.4mm as of 5/16/08.
(2) Assumes outstanding diluted shares of 35.021 million.
chevron_up_icon
1 out of 6
circle_padding
hide_on_mobile
zoom_out_icon
logo.png

Your All-in-One AI-Powered Toolkit for Academic Success.

Available 24*7 on WhatsApp / Email

[object Object]