BUSM3243 - Economic Analysis: The Australian Wine Industry
VerifiedAdded on 2023/06/10
|19
|4194
|426
Report
AI Summary
This report provides a comprehensive economic analysis of the Australian wine industry, focusing on factors of production, market dynamics, and the impact of external factors like frost on Shiraz production. It explores concepts such as resource allocation, economic efficiency, substitute and complementary products, and elasticity. The report also examines market failure in the context of government regulations on food labeling, assessing the costs and benefits of such policies. Furthermore, it delves into different market structures, comparing perfect competition and monopoly, and their implications for the wine industry. The analysis utilizes cost curves, supply and demand diagrams, and relevant economic theories to provide a detailed understanding of the industry's challenges and opportunities. Desklib offers this and many other solved assignments to aid students in their studies.
Running head: BUSINESS AND ECONOMIC ANALYSIS
Business and Economic Analysis
Name of the student
name of the university
Author Note
Business and Economic Analysis
Name of the student
name of the university
Author Note
Paraphrase This Document
Need a fresh take? Get an instant paraphrase of this document with our AI Paraphraser
1BUSINESS AND ECONOMIC ANALYSIS
Table of Contents
Section A:...................................................................................................................................2
a).............................................................................................................................................2
b)............................................................................................................................................3
c).............................................................................................................................................4
d)............................................................................................................................................5
Section B:...................................................................................................................................8
Section C..................................................................................................................................10
Answer to Question A..........................................................................................................10
Answer to Question C..............................................................................................................13
References................................................................................................................................16
2BUSINESS AND ECONOMIC ANALYSIS
Section A:
a)
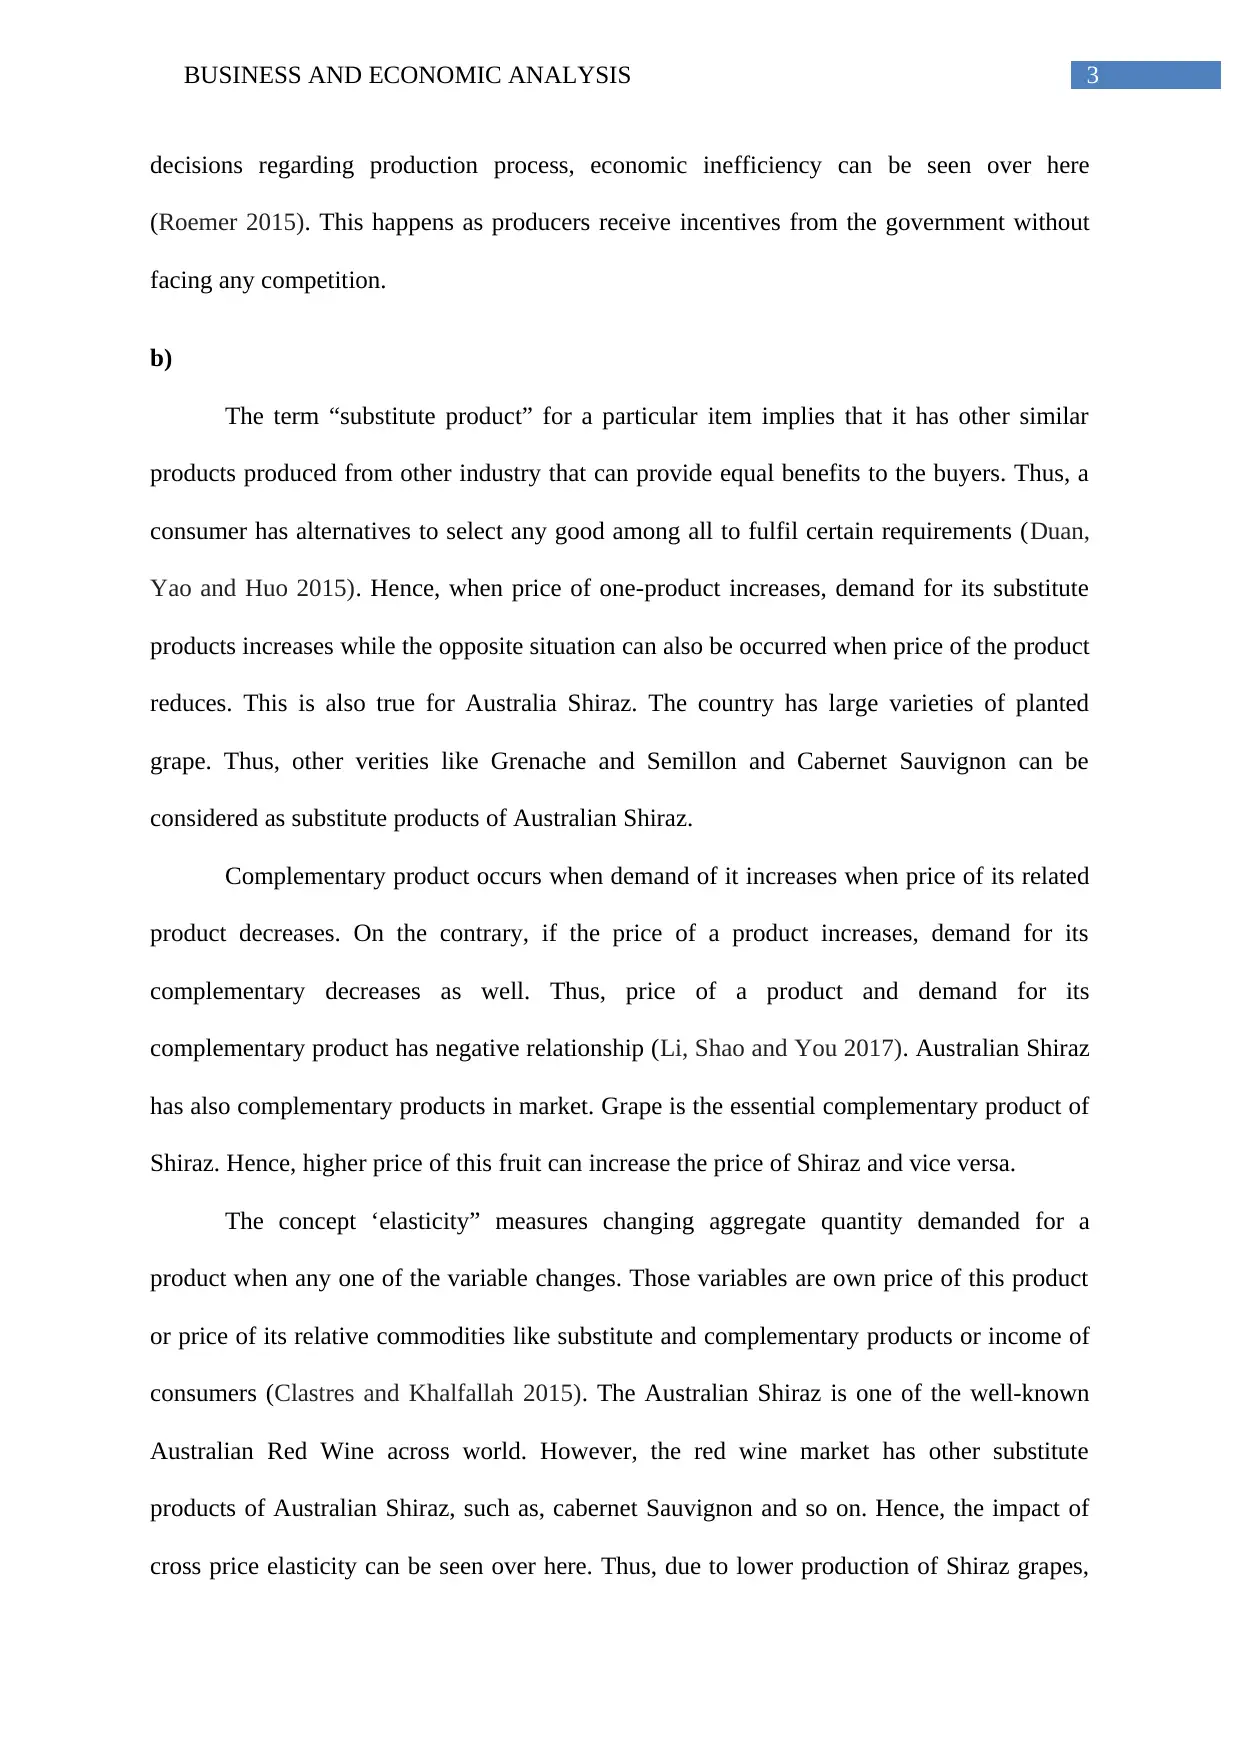
The term “factors of production” is an economic concept, which represents those
inputs that are required in the production process to earn economic profit (Nord-Larsen, Sevel
and Raulund-Rasmussen 2015). To produce wine, producers require some factors of
production as well. Those factors are weather, climate and soil.
In market based (capitalism) system, resources are allocated according to the
decisions of individual consumers and producers. Resource allocation is an important concept
of economics and can be determined with the help of three basic concepts that describe about
amount of products to be produced, process of production and purpose behind it (Xu, Tihanyi
and Hitt 2017). Market demand and market supply help producer to determine the amount of
product to be produced. The production process takes decision regarding input allocation.
The last concept deals with distribution of products related to money income distribution.
Money income depends on the quality, quantity and various forms of resources along with
product prices (Rosinger, Taylor, Coco and Slaughter 2016). Hence, the distribution of
finished products depends on ability and willingness of consumers for paying market price.
Economic efficiency can be differing between capitalist economy and command-and-
control system. In pure capitalism, individual firm owns productive resources and can be
arranged according to its requirement. This system chiefly concentrates on three Ps, which
are, profits, prices and private property (Rose-Ackerman 2017). The laissez-fair system can
be observed within capitalist economy where producers through producing products and
selling those at profitable prices can earn economic efficiency. This it can be said that this
system can earn economic efficiency along with output stability, economic growth and
employment. On the other side, in command economy community controls interest of
workers to work while their self-interest cannot play any role. As the government takes entire
Section A:
a)
The term “factors of production” is an economic concept, which represents those
inputs that are required in the production process to earn economic profit (Nord-Larsen, Sevel
and Raulund-Rasmussen 2015). To produce wine, producers require some factors of
production as well. Those factors are weather, climate and soil.
In market based (capitalism) system, resources are allocated according to the
decisions of individual consumers and producers. Resource allocation is an important concept
of economics and can be determined with the help of three basic concepts that describe about
amount of products to be produced, process of production and purpose behind it (Xu, Tihanyi
and Hitt 2017). Market demand and market supply help producer to determine the amount of
product to be produced. The production process takes decision regarding input allocation.
The last concept deals with distribution of products related to money income distribution.
Money income depends on the quality, quantity and various forms of resources along with
product prices (Rosinger, Taylor, Coco and Slaughter 2016). Hence, the distribution of
finished products depends on ability and willingness of consumers for paying market price.
Economic efficiency can be differing between capitalist economy and command-and-
control system. In pure capitalism, individual firm owns productive resources and can be
arranged according to its requirement. This system chiefly concentrates on three Ps, which
are, profits, prices and private property (Rose-Ackerman 2017). The laissez-fair system can
be observed within capitalist economy where producers through producing products and
selling those at profitable prices can earn economic efficiency. This it can be said that this
system can earn economic efficiency along with output stability, economic growth and
employment. On the other side, in command economy community controls interest of
workers to work while their self-interest cannot play any role. As the government takes entire
⊘ This is a preview!⊘
Do you want full access?
Subscribe today to unlock all pages.
Trusted by 1+ million students worldwide
3BUSINESS AND ECONOMIC ANALYSIS
decisions regarding production process, economic inefficiency can be seen over here
(Roemer 2015). This happens as producers receive incentives from the government without
facing any competition.
b)
The term “substitute product” for a particular item implies that it has other similar
products produced from other industry that can provide equal benefits to the buyers. Thus, a
consumer has alternatives to select any good among all to fulfil certain requirements (Duan,
Yao and Huo 2015). Hence, when price of one-product increases, demand for its substitute
products increases while the opposite situation can also be occurred when price of the product
reduces. This is also true for Australia Shiraz. The country has large varieties of planted
grape. Thus, other verities like Grenache and Semillon and Cabernet Sauvignon can be
considered as substitute products of Australian Shiraz.
Complementary product occurs when demand of it increases when price of its related
product decreases. On the contrary, if the price of a product increases, demand for its
complementary decreases as well. Thus, price of a product and demand for its
complementary product has negative relationship (Li, Shao and You 2017). Australian Shiraz
has also complementary products in market. Grape is the essential complementary product of
Shiraz. Hence, higher price of this fruit can increase the price of Shiraz and vice versa.
The concept ‘elasticity” measures changing aggregate quantity demanded for a
product when any one of the variable changes. Those variables are own price of this product
or price of its relative commodities like substitute and complementary products or income of
consumers (Clastres and Khalfallah 2015). The Australian Shiraz is one of the well-known
Australian Red Wine across world. However, the red wine market has other substitute
products of Australian Shiraz, such as, cabernet Sauvignon and so on. Hence, the impact of
cross price elasticity can be seen over here. Thus, due to lower production of Shiraz grapes,
Paraphrase This Document
Need a fresh take? Get an instant paraphrase of this document with our AI Paraphraser
4BUSINESS AND ECONOMIC ANALYSIS
price of Australian Shiraz can be increased in market and this can further increase the
demand for other Australian red wines.
c)
The frost has influenced winery production of Australian Shiraz by large extend
through changing is cost pattern. Hence, this situation can be analysed with the help of
various cost curves under perfectly competitive market. Due to lower production of grapes,
price of raw product has increased and this in turn can increase total production cost of
Australian Shiraz (Azevedo and Gottlieb 2017). Moreover, number of total output can also be
decreased further due to lack of raw materials. Thus, average total cost (ATC) of this product
is going to increase further. On the other side, raw materials are considered as variable
products, its costs are referred as average variable cost (AVC) and consequently it increases
further. As the rate of changing total cost can increase for per unit of production of Shiraz,
marginal cost (MC) can be increased as well. Thus, all curves shift upward compare to
before. On the other side, marginal revenue curve can shift upward as well. This is because,
the wine company is going to charge hiring price for Shiraz due to its higher cost of
production (Cullen and Mansur 2017). Consequently, the company can earn comparatively
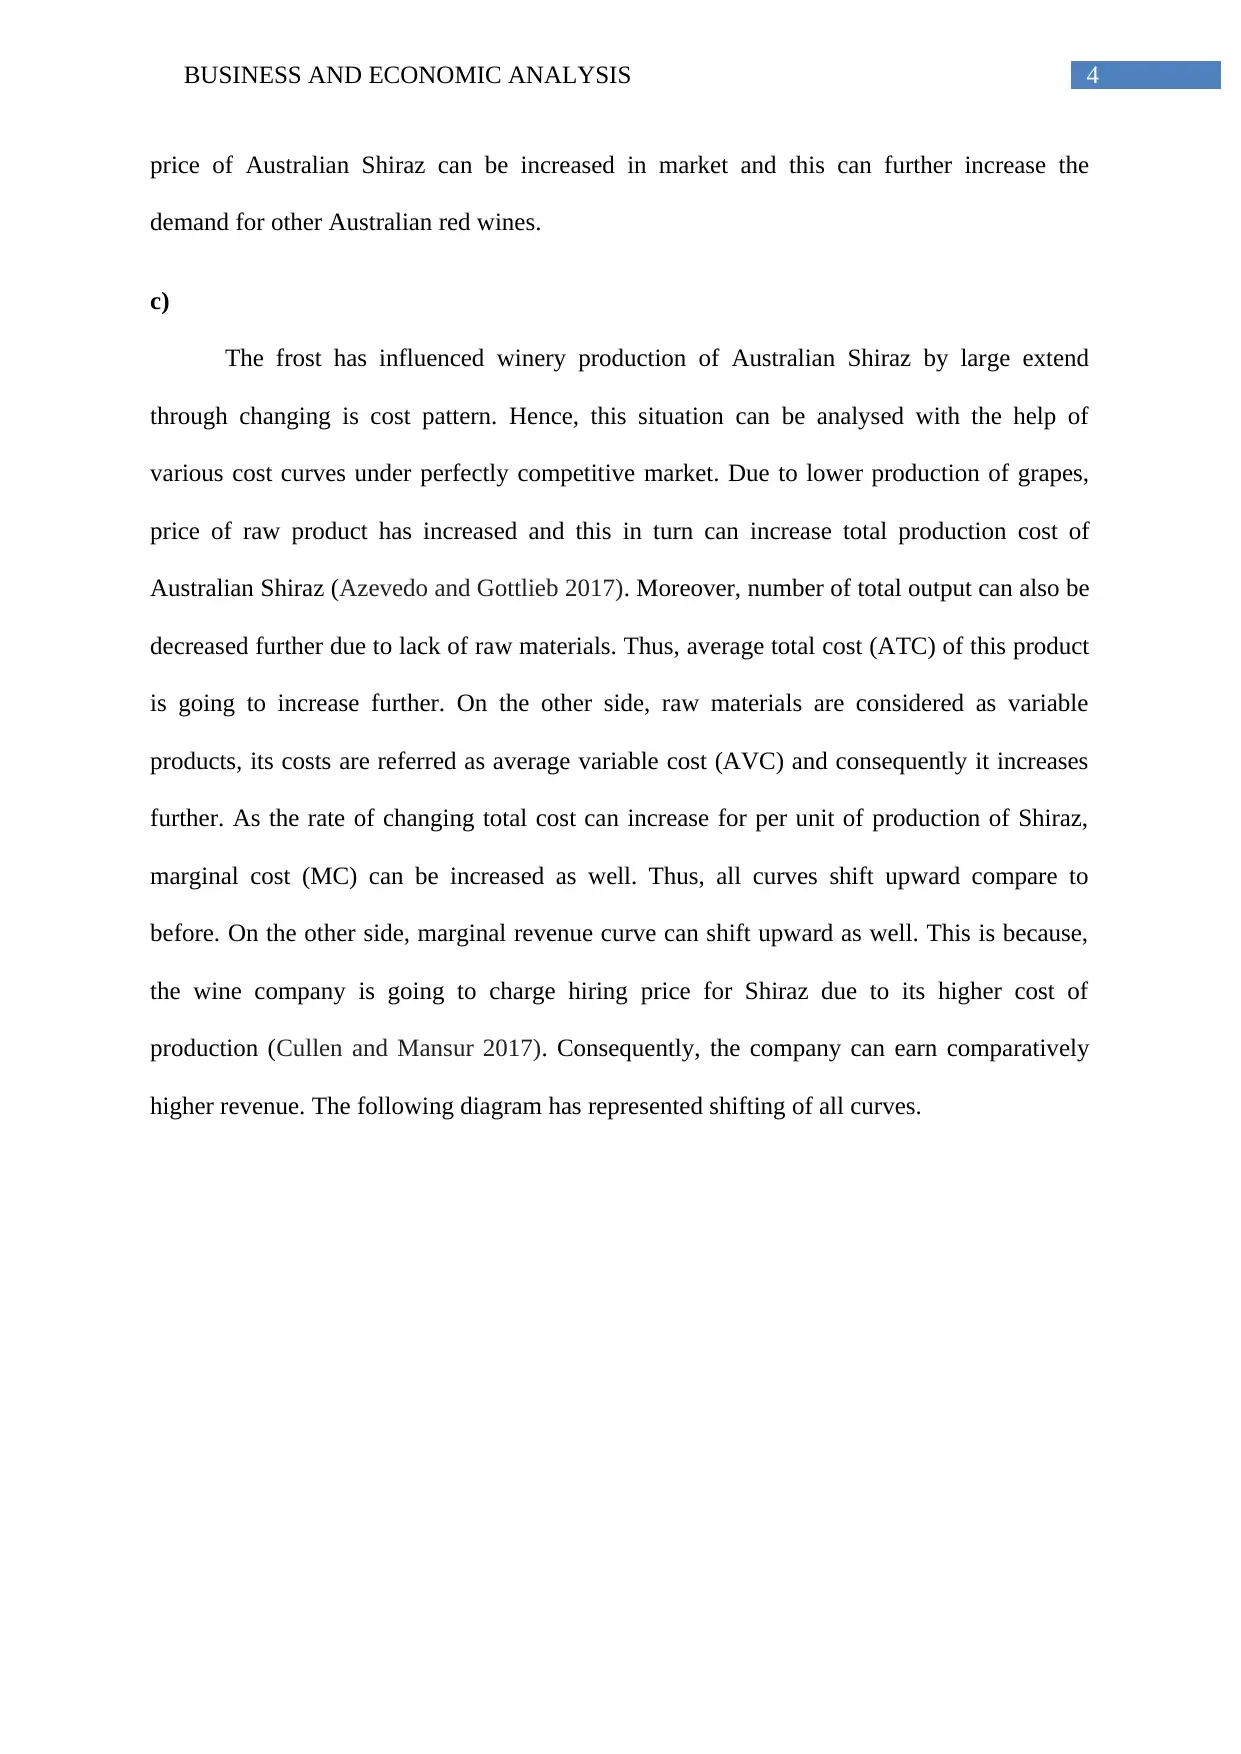
higher revenue. The following diagram has represented shifting of all curves.
price of Australian Shiraz can be increased in market and this can further increase the
demand for other Australian red wines.
c)
The frost has influenced winery production of Australian Shiraz by large extend
through changing is cost pattern. Hence, this situation can be analysed with the help of
various cost curves under perfectly competitive market. Due to lower production of grapes,
price of raw product has increased and this in turn can increase total production cost of
Australian Shiraz (Azevedo and Gottlieb 2017). Moreover, number of total output can also be
decreased further due to lack of raw materials. Thus, average total cost (ATC) of this product
is going to increase further. On the other side, raw materials are considered as variable
products, its costs are referred as average variable cost (AVC) and consequently it increases
further. As the rate of changing total cost can increase for per unit of production of Shiraz,
marginal cost (MC) can be increased as well. Thus, all curves shift upward compare to
before. On the other side, marginal revenue curve can shift upward as well. This is because,
the wine company is going to charge hiring price for Shiraz due to its higher cost of
production (Cullen and Mansur 2017). Consequently, the company can earn comparatively
higher revenue. The following diagram has represented shifting of all curves.
5BUSINESS AND ECONOMIC ANALYSIS
AC1
AC2MC1MC2
AVC1
AVC2
Output
Cost and revenue
O
MR1
MR2
Figure 1: Shift in cost curves
Source: (created by author)
In above figure costs curves are shifted in the upward direction, which are represented
by diagrams drawn with red colours. The initial average total cost curve is shown as AC1
while initial average variable cost curve and marginal cost curve are represented by AVC1
and MC1 curve. In addition to this, initial marginal revenue curve is shown by MR1 curve.
However, after increase in costs, the new ATC curve becomes ATC2. Moreover, new AVC,
MC and MR curves are represented as AVC2, MC2 and MR2, respectively.
d)
According to figure 1, entire cost curves and revenue curve for a firm of Australian
Shiraz have increased and consequently have shifted towards upward. Under perfect
competition, an industry consists with large number of firms. Due to huge fall in production
of grapes, almost all Shiraz producing firms are affecting adversely and this in turn has
⊘ This is a preview!⊘
Do you want full access?
Subscribe today to unlock all pages.
Trusted by 1+ million students worldwide
6BUSINESS AND ECONOMIC ANALYSIS
AS1
AS2
AD1
Y2 Y1
P0
P1
Price
O Output
affected market supply curve (Borenstein, Bushnell and Wolak 2017). Thus, from this
phenomenon it can be said that frost has adversely affected the market of Australian Shiraz
through changing market supply curve and demand curve. Due to lower production of grapes,
production of Shiraz hampers and this further shifts market supply curve of this red wine to
the left. On the other side, producers charge higher price as cost of production increases.
However, based on law of demand, consumers can intend to buy comparatively less amount
of Shiraz as the market has other substitute products. Thus, higher price of Shiraz forces its
market demand to reduce further (Jadidzadeh and Serletis 2017). This can change equilibrium
price and output of the market for Australian Shiraz. This phenomenon can be seen with the
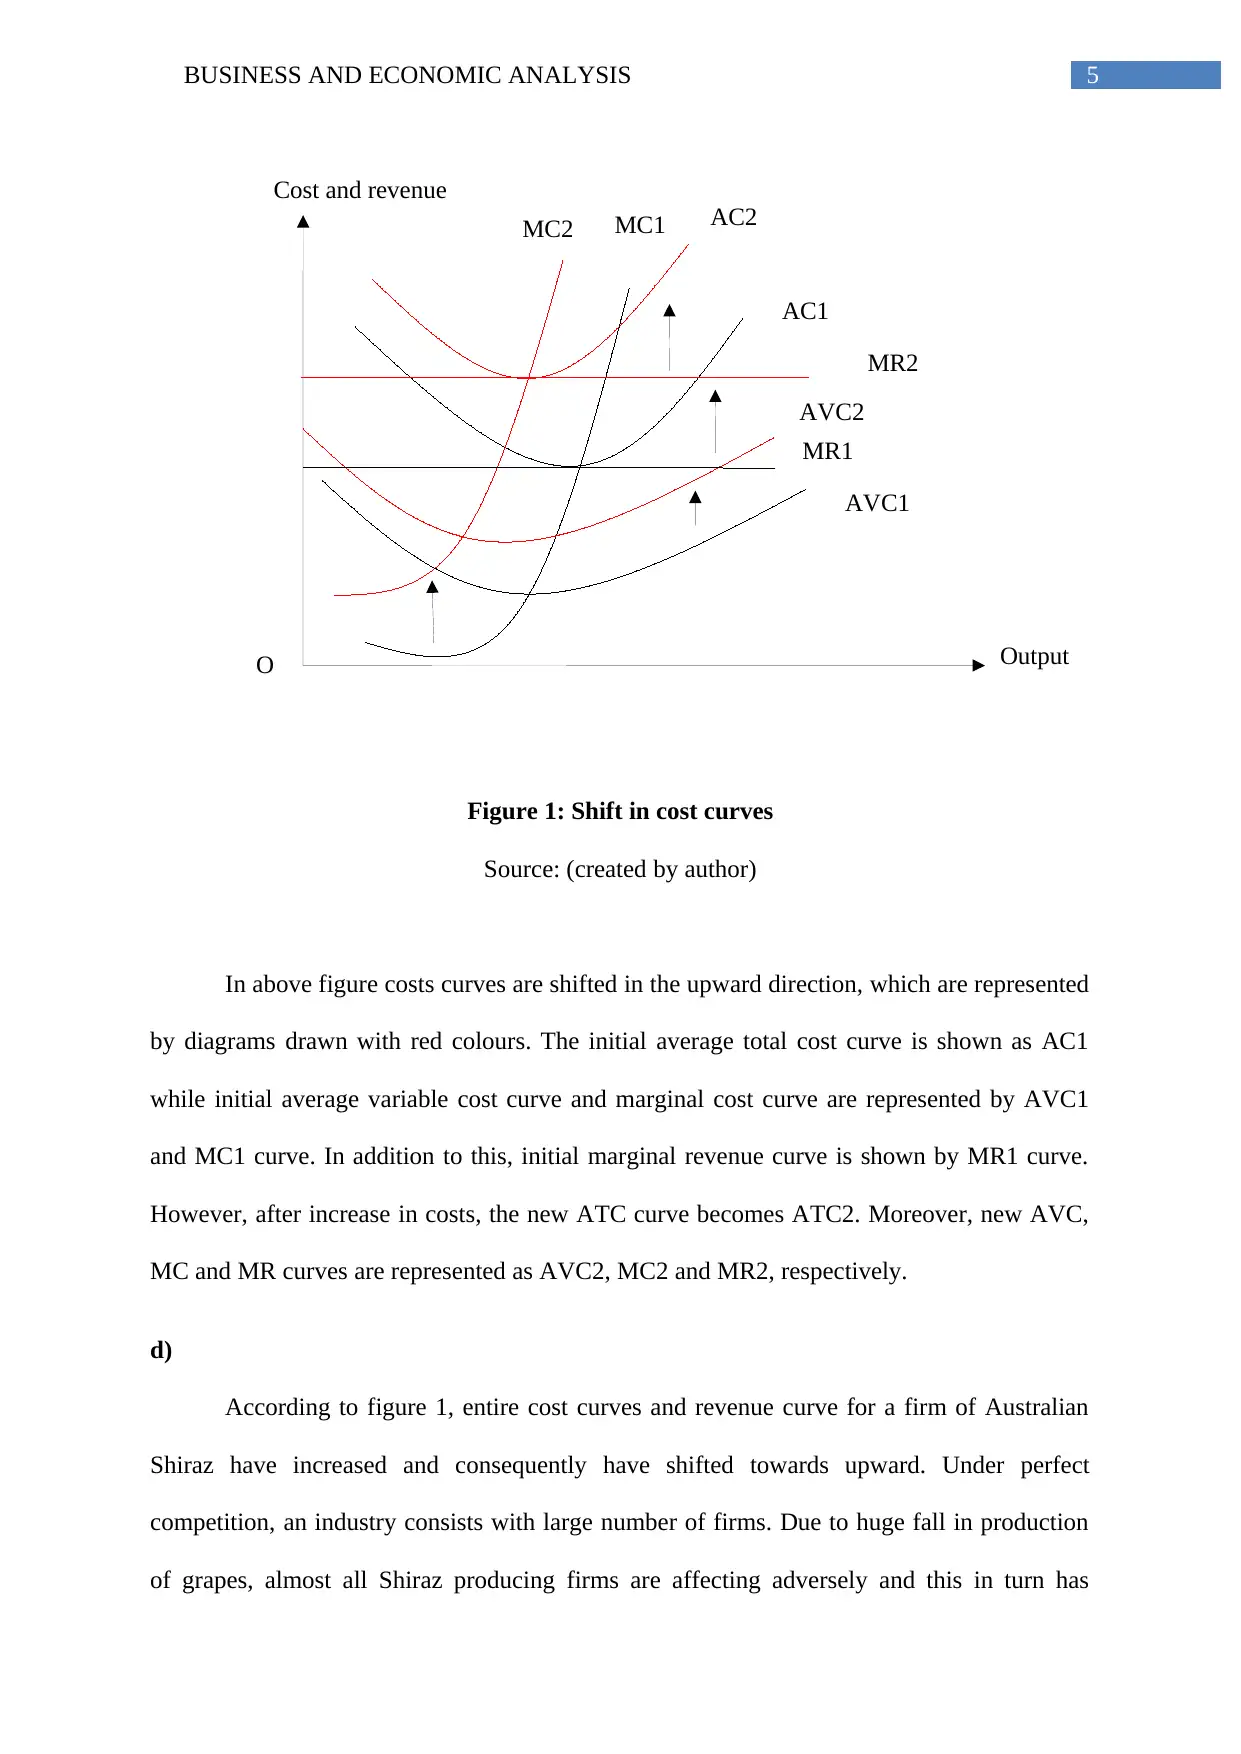
help of following diagram.
Figure 2: Shift in market supply curve
Source: (created by author)
In figure 2, aggregate supply curve has shifted towards left representing lower amount
of supply. Thus, in market of Shiraz, price increases from P0 to P1 while equilibrium output
decreases from Y2 to Y1.
AS1
AS2
AD1
Y2 Y1
P0
P1
Price
O Output
affected market supply curve (Borenstein, Bushnell and Wolak 2017). Thus, from this
phenomenon it can be said that frost has adversely affected the market of Australian Shiraz
through changing market supply curve and demand curve. Due to lower production of grapes,
production of Shiraz hampers and this further shifts market supply curve of this red wine to
the left. On the other side, producers charge higher price as cost of production increases.
However, based on law of demand, consumers can intend to buy comparatively less amount
of Shiraz as the market has other substitute products. Thus, higher price of Shiraz forces its
market demand to reduce further (Jadidzadeh and Serletis 2017). This can change equilibrium
price and output of the market for Australian Shiraz. This phenomenon can be seen with the
help of following diagram.
Figure 2: Shift in market supply curve
Source: (created by author)
In figure 2, aggregate supply curve has shifted towards left representing lower amount
of supply. Thus, in market of Shiraz, price increases from P0 to P1 while equilibrium output
decreases from Y2 to Y1.
Paraphrase This Document
Need a fresh take? Get an instant paraphrase of this document with our AI Paraphraser
7BUSINESS AND ECONOMIC ANALYSIS
AS1
AS2
AD1
Y2 Y1
P0
P1
Price
O Output
AD2
Y3
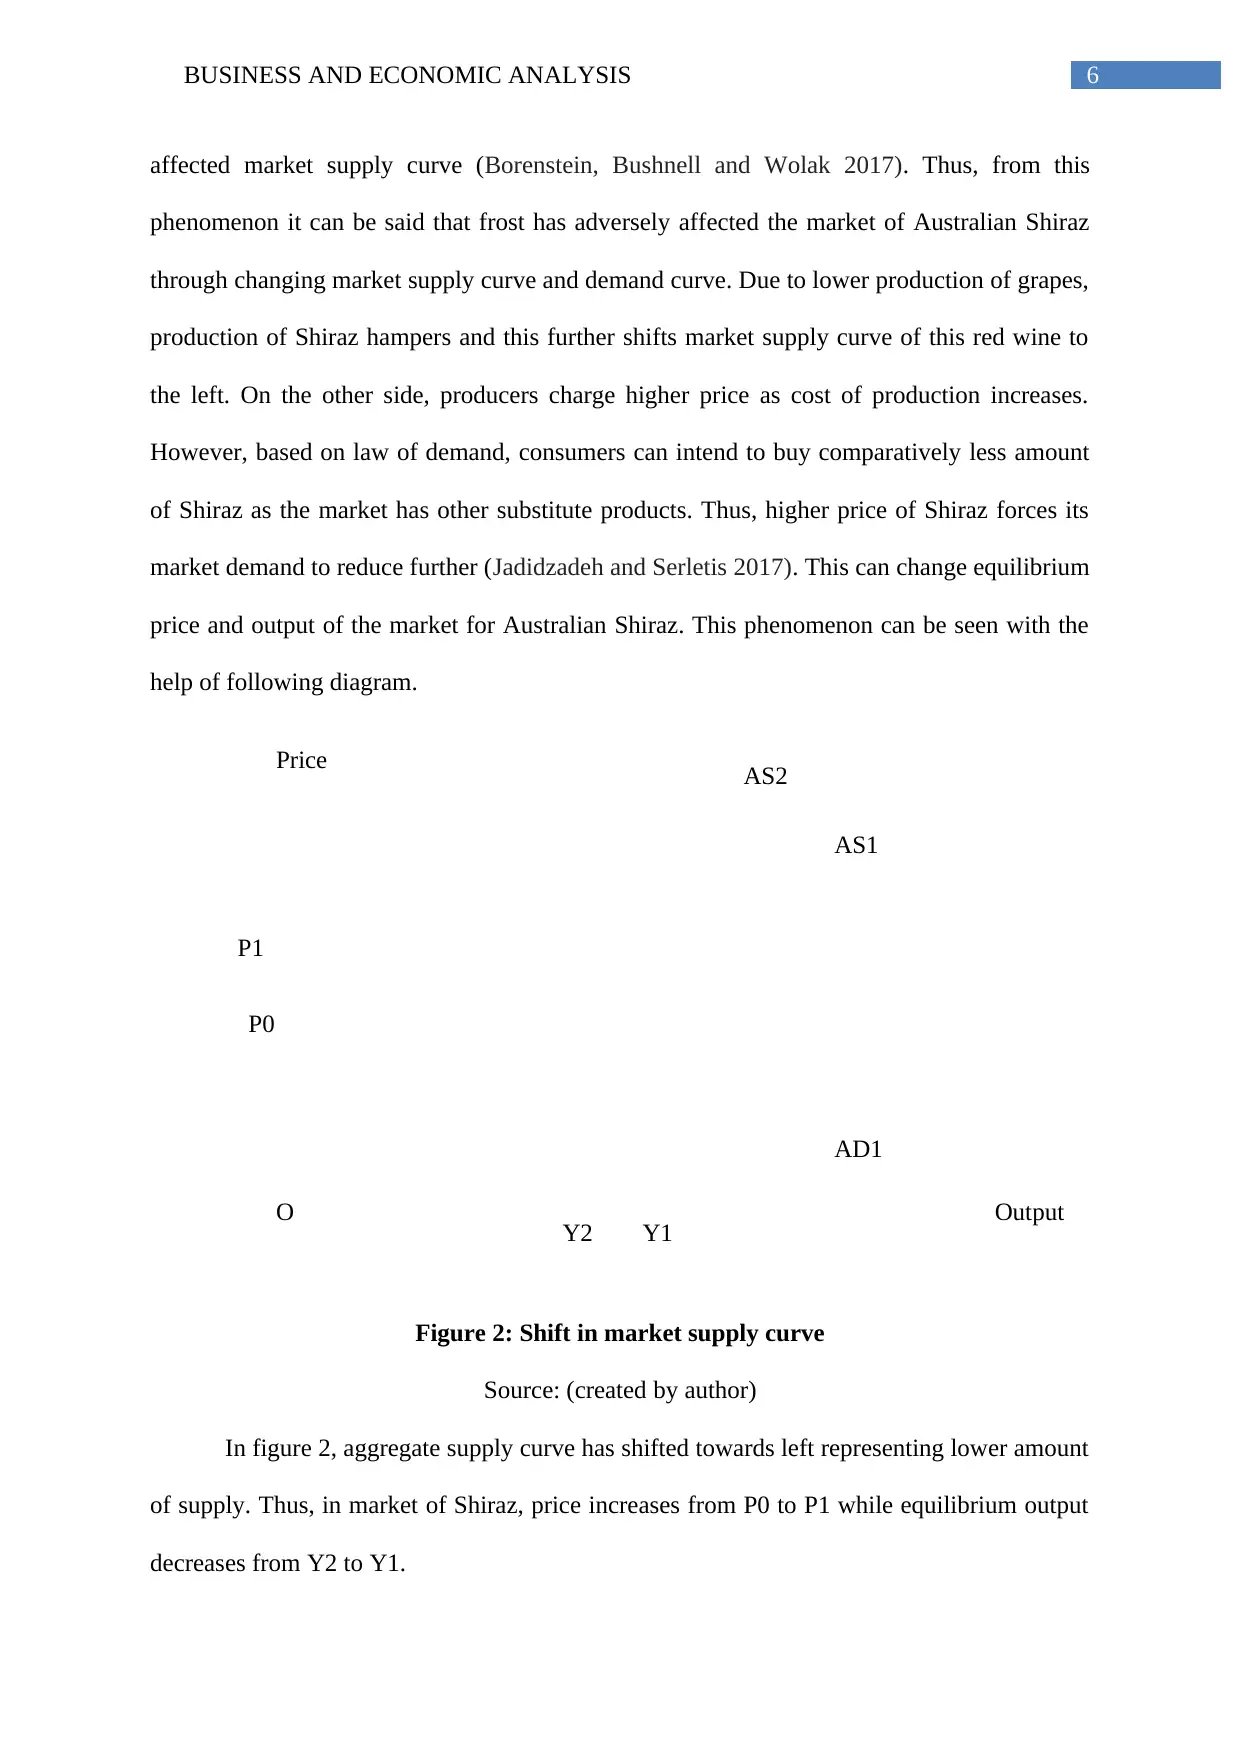
Figure 3: Shift in market demand curve
Source: (created by author)
In figure 3, aggregate demand curve decreases and this further shifts the AD curve
from AD1 to AD2. Consequently, equilibrium price decreases and comes to its initial level
while equilibrium level of output decreases more, that is, from Y2 to Y3.
AS1
AS2
AD1
Y2 Y1
P0
P1
Price
O Output
AD2
Y3
Figure 3: Shift in market demand curve
Source: (created by author)
In figure 3, aggregate demand curve decreases and this further shifts the AD curve
from AD1 to AD2. Consequently, equilibrium price decreases and comes to its initial level
while equilibrium level of output decreases more, that is, from Y2 to Y3.
8BUSINESS AND ECONOMIC ANALYSIS
Section B:
Market failure within an economy occurs when it cannot allocate its products
efficiently and freely. As a result, the economy experiences a net loss related to social welfare
(Dunning 2015). In given article, market failure is also seen where the government has
implemented labelling laws on food businesses. Due to this, each company bears excess costs
for creating and changing packaging systems of their products. However, according to this
article, the government has implemented those policies based on some economic justification.
The chief focus of the government of any country is to spread social welfare among citizens.
This also happens in Australia when a hepatitis A spread in 2015 due to imports of frozen
berries (Insch and Jackson 2014). Thus, the Australian government tried to make it clear to its
citizens regarding source of importing production into this country. Thus, according to them,
new labelling can provide better to consumers about the product details. As a result,
consumers can decide that whether they can use those products or not.
Those policies have increased costs for every Australian company, as those
companies are required to change their labelling. Thus further makes food business
organisations unhappy. According to the Food South Australia, the entire business cost within
this country can increase by large amounts while those firms cannot pass these costs to their
consumers through charging higher prices. Thus, only food business organisations will only
bear those costs. There are many entities, which produce and sell large wide range of
products. Thus, they make various types of packages for their different types of foods.
However, After changing this labelling law, those companies require to change huge number
of labelling and that can be very costly for them. As, most of the food organisations operate
under small and medium size scales, it can be very difficult for them to follow these policies
within certain time period.
⊘ This is a preview!⊘
Do you want full access?
Subscribe today to unlock all pages.
Trusted by 1+ million students worldwide
9BUSINESS AND ECONOMIC ANALYSIS
However, with implementing those policies, the government cannot prevent any
negative consequences within the economy. According to the Health experts of Australia,
these new level cannot provide proper information to consumers of this country. Those labels
only state that whether those foods are producing within Australia or not (Newman, Turri,
Howlett and Stokes 2014). However, it becomes difficult consumers to guess about sources
of remaining ingredients from where they are coming from. Hence, without receiving proper
information, consumers cannot take proper decisions that whether they can buy those or not.
As a result, negative impacts can rise within economy like before.
The government can take alternative approaches that can be implemented to reduce
negative impacts from importing foods items within economy. For instance, the government
can implement proper health guide to their citizens through conducting various campaigning.
On the other side, the government can restrict food imports from various foreign countries
from where health diseases occur (Cichero et al. 2017). Moreover, the Australian government
can adopt various research and developments to observe that whether the country can
produce those foods within the country or not. If the country can adopt modern technology
during production process then it can be easier for the government to reduce imports of foods
from other countries.
Paraphrase This Document
Need a fresh take? Get an instant paraphrase of this document with our AI Paraphraser
10BUSINESS AND ECONOMIC ANALYSIS
Section C
Answer to Question A
In economic framework, there exist different market forms like that of monopoly,
perfect competition, monopolistic competition, oligopoly, each varying in the aspects of
number of sellers, buyers, market power distribution, nature of the product or service and also
the barriers present in entry and exit aspects of the concerned market (Dixon et al. 2012).
In this context, the perfectly competitive market and the monopoly market are the two
most prominent ones. In the competitive market, there exists many buyers and sellers, which
in turn indicates towards the presence of equal distribution of market power, knowledge and
other attributes and in this market both the buyers and the sellers are price takers.
According to the “Invisible Hand” theory of the Classical Economist, Adam Smith,
the competitive forces in the market act in bring the demand and supply forces at par with
each other and the presence of this competitive environment helps in reducing the self-
interest of all economic agents, which in turn, is a socially desirable attribute
(Wetzstein2013). In this context, in a perfectly competitive market, due to the presence of
free entry and exit, the presence of excess profit in the market attracts new firms, thereby
increasing the supply and reducing the price and vice versa. The products sold being perfectly
homogenous, leaves no scope of individual bias of the buyers. Thus, any super-normal or
sub-normal profit in the market is eradicated in the long run, and the equilibrium for the firms
occur at the point:
P = MC (P being the price of one unit of the product and MC being the marginal cost
of production of additional unit of the concerned product).
11BUSINESS AND ECONOMIC ANALYSIS
E
P*
Q*
Price
O Quantity
Supply curve
Demand curve
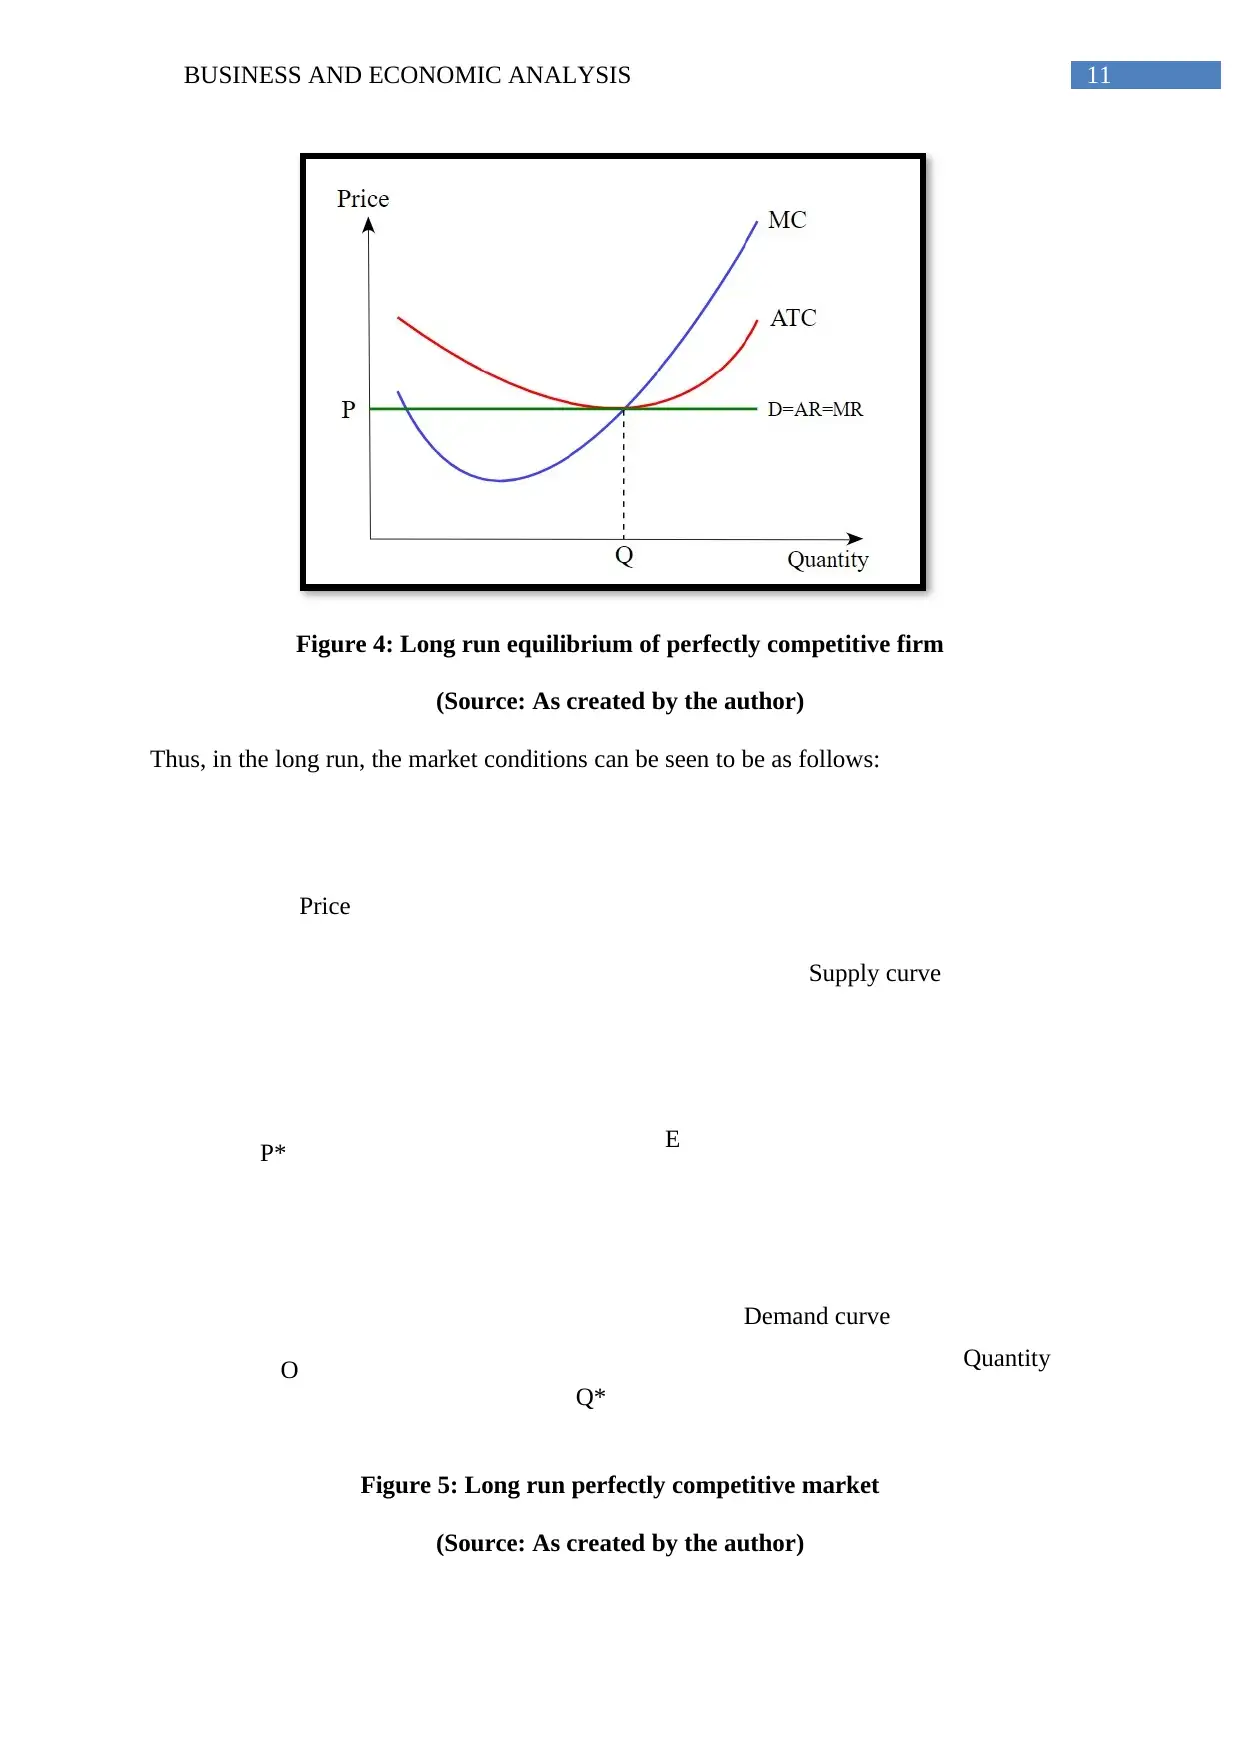
Figure 4: Long run equilibrium of perfectly competitive firm
(Source: As created by the author)
Thus, in the long run, the market conditions can be seen to be as follows:
Figure 5: Long run perfectly competitive market
(Source: As created by the author)
E
P*
Q*
Price
O Quantity
Supply curve
Demand curve
Figure 4: Long run equilibrium of perfectly competitive firm
(Source: As created by the author)
Thus, in the long run, the market conditions can be seen to be as follows:
Figure 5: Long run perfectly competitive market
(Source: As created by the author)
⊘ This is a preview!⊘
Do you want full access?
Subscribe today to unlock all pages.
Trusted by 1+ million students worldwide
1 out of 19
Related Documents


Your All-in-One AI-Powered Toolkit for Academic Success.
+13062052269
info@desklib.com
Available 24*7 on WhatsApp / Email
![[object Object]](/_next/static/media/star-bottom.7253800d.svg)
Unlock your academic potential
Copyright © 2020–2026 A2Z Services. All Rights Reserved. Developed and managed by ZUCOL.