Report: Data Analysis of Caergwrle Train Station Usage and Forecasting
VerifiedAdded on 2020/10/22
|8
|1160
|151
Report
AI Summary
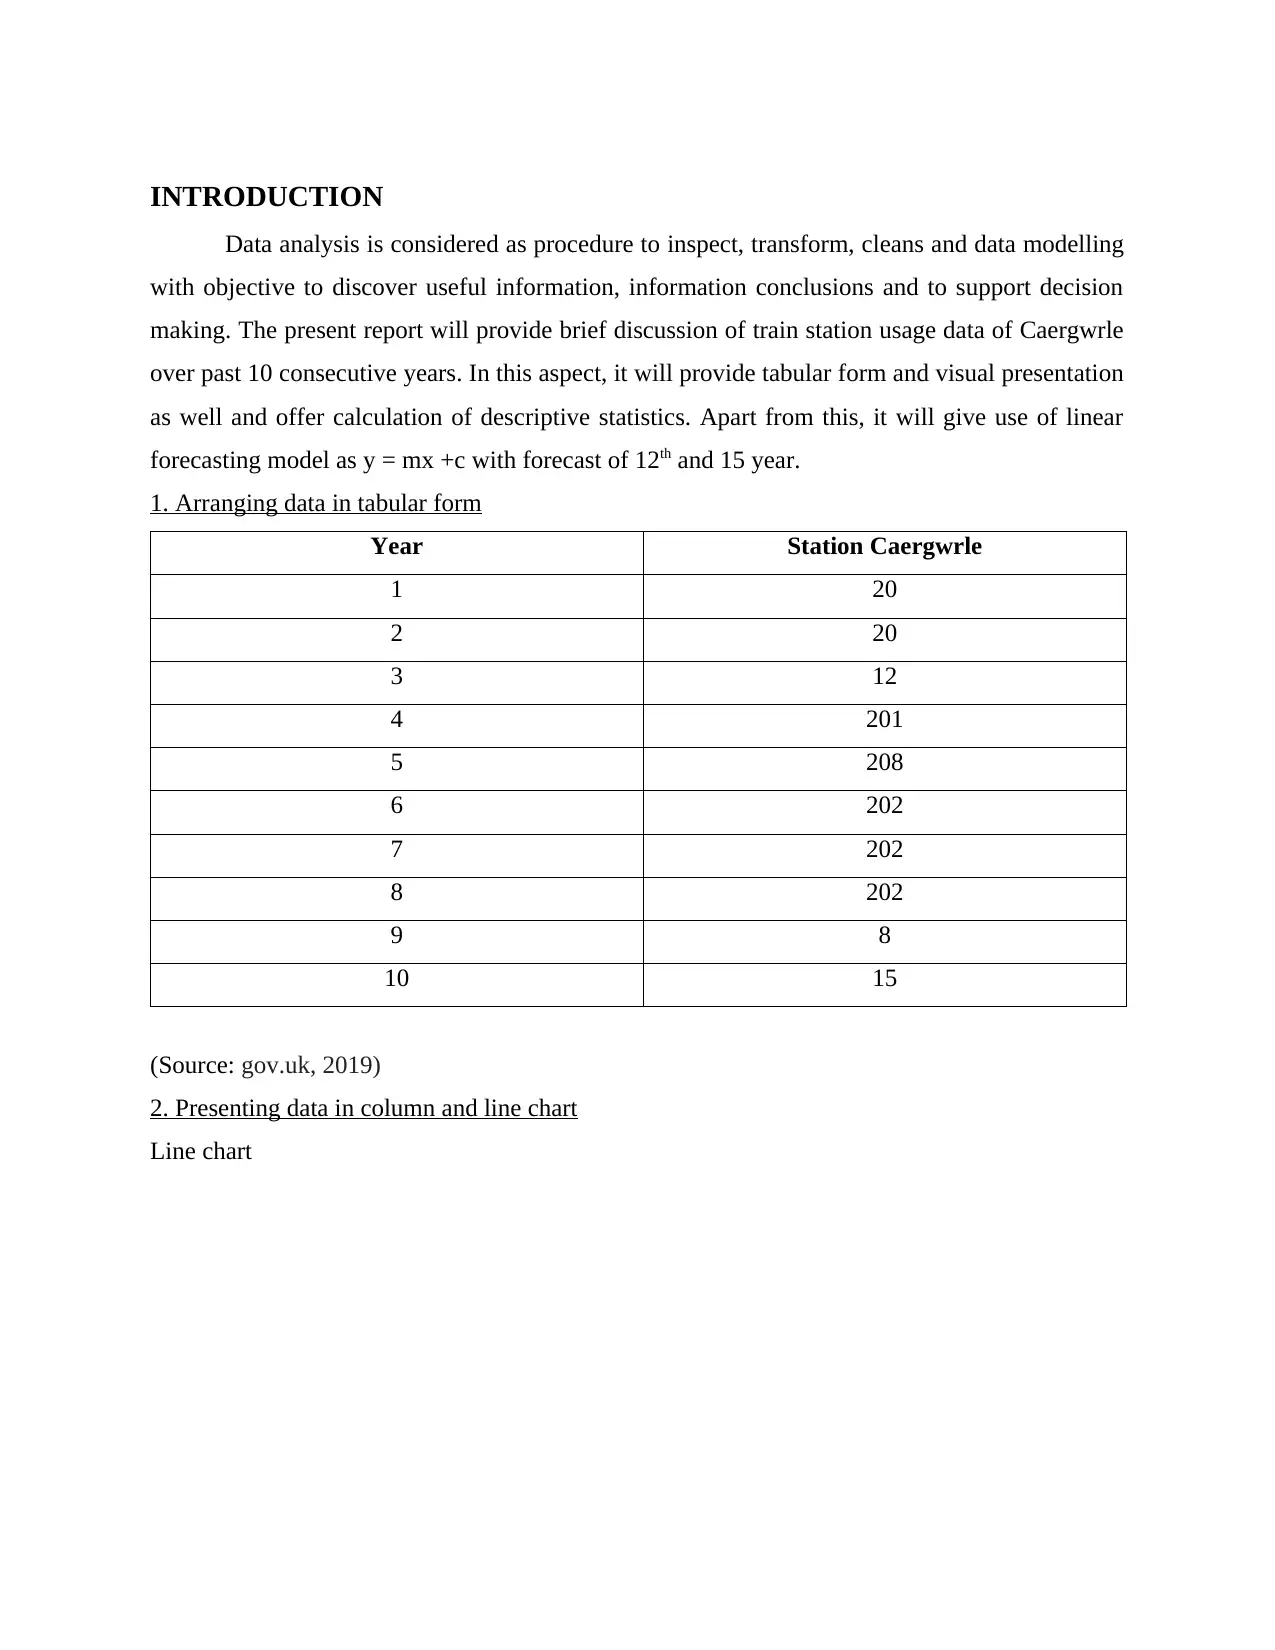
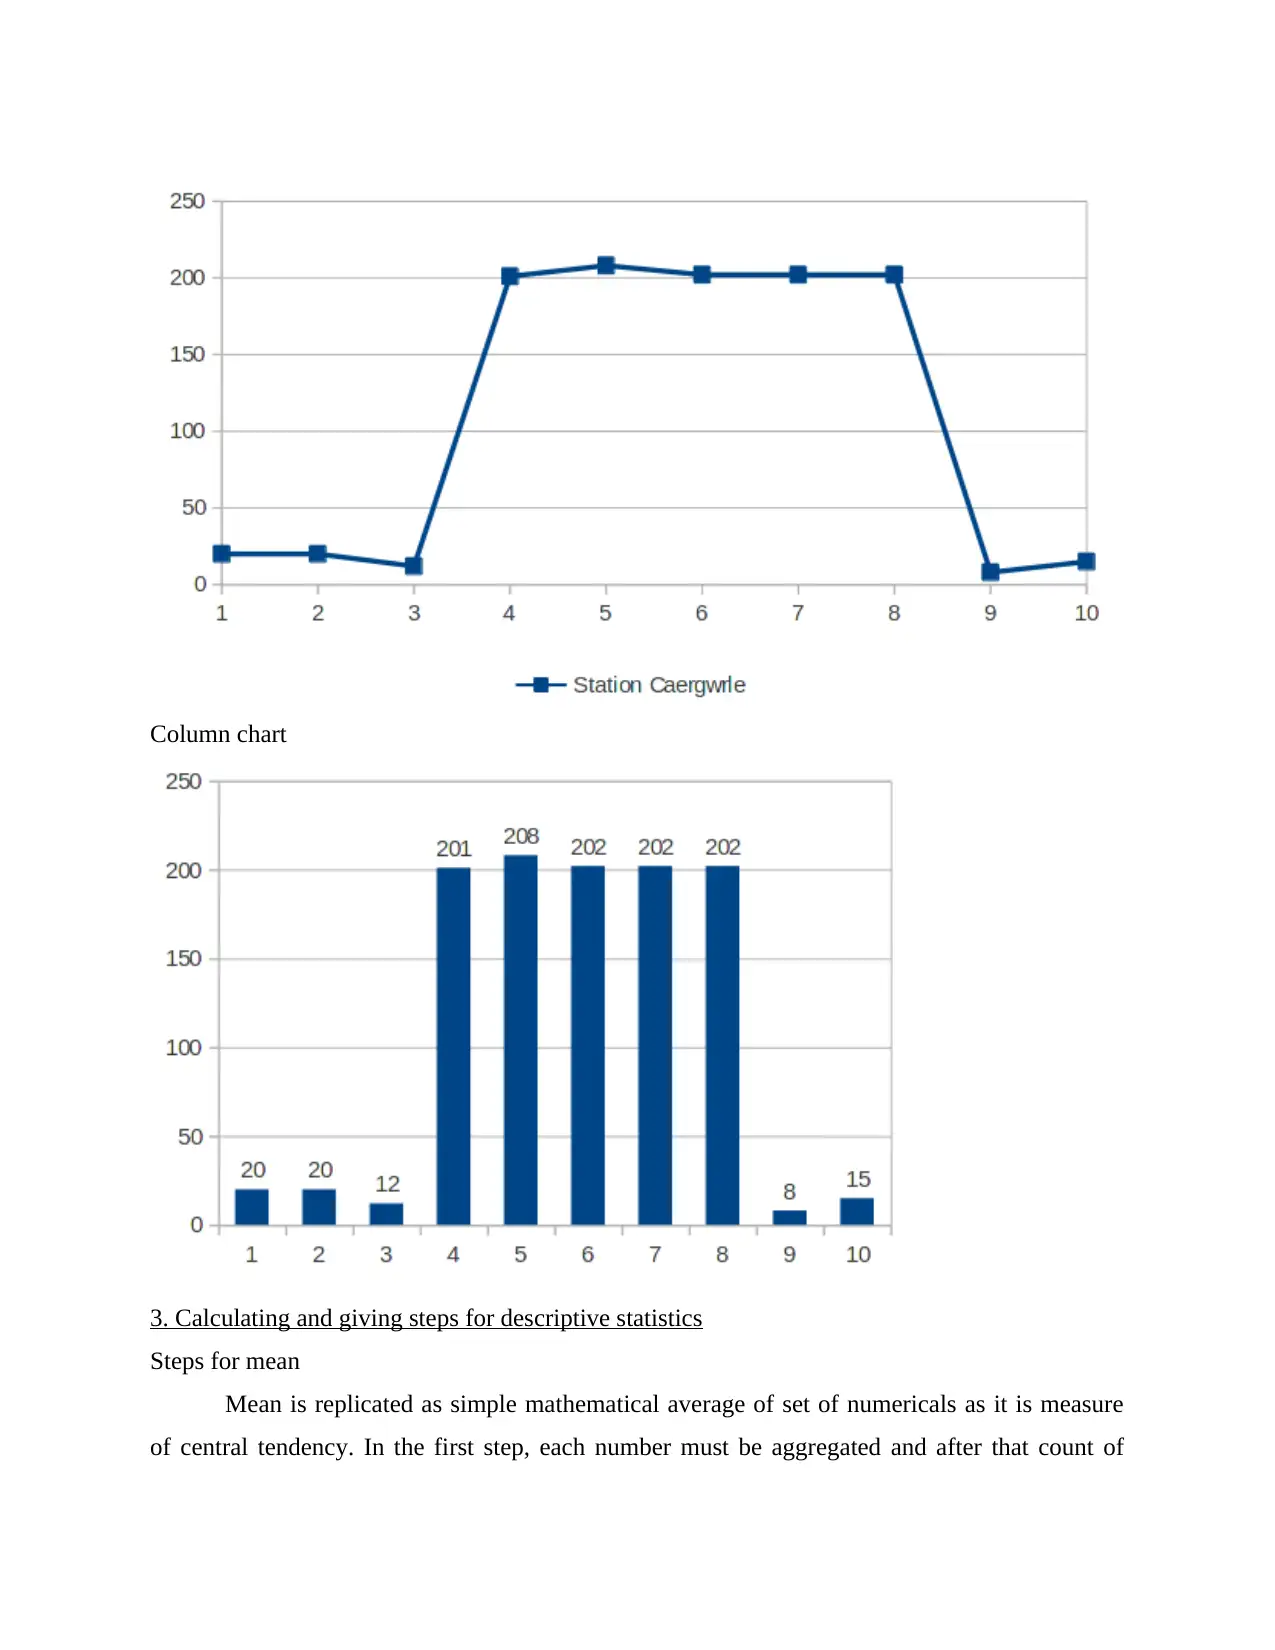
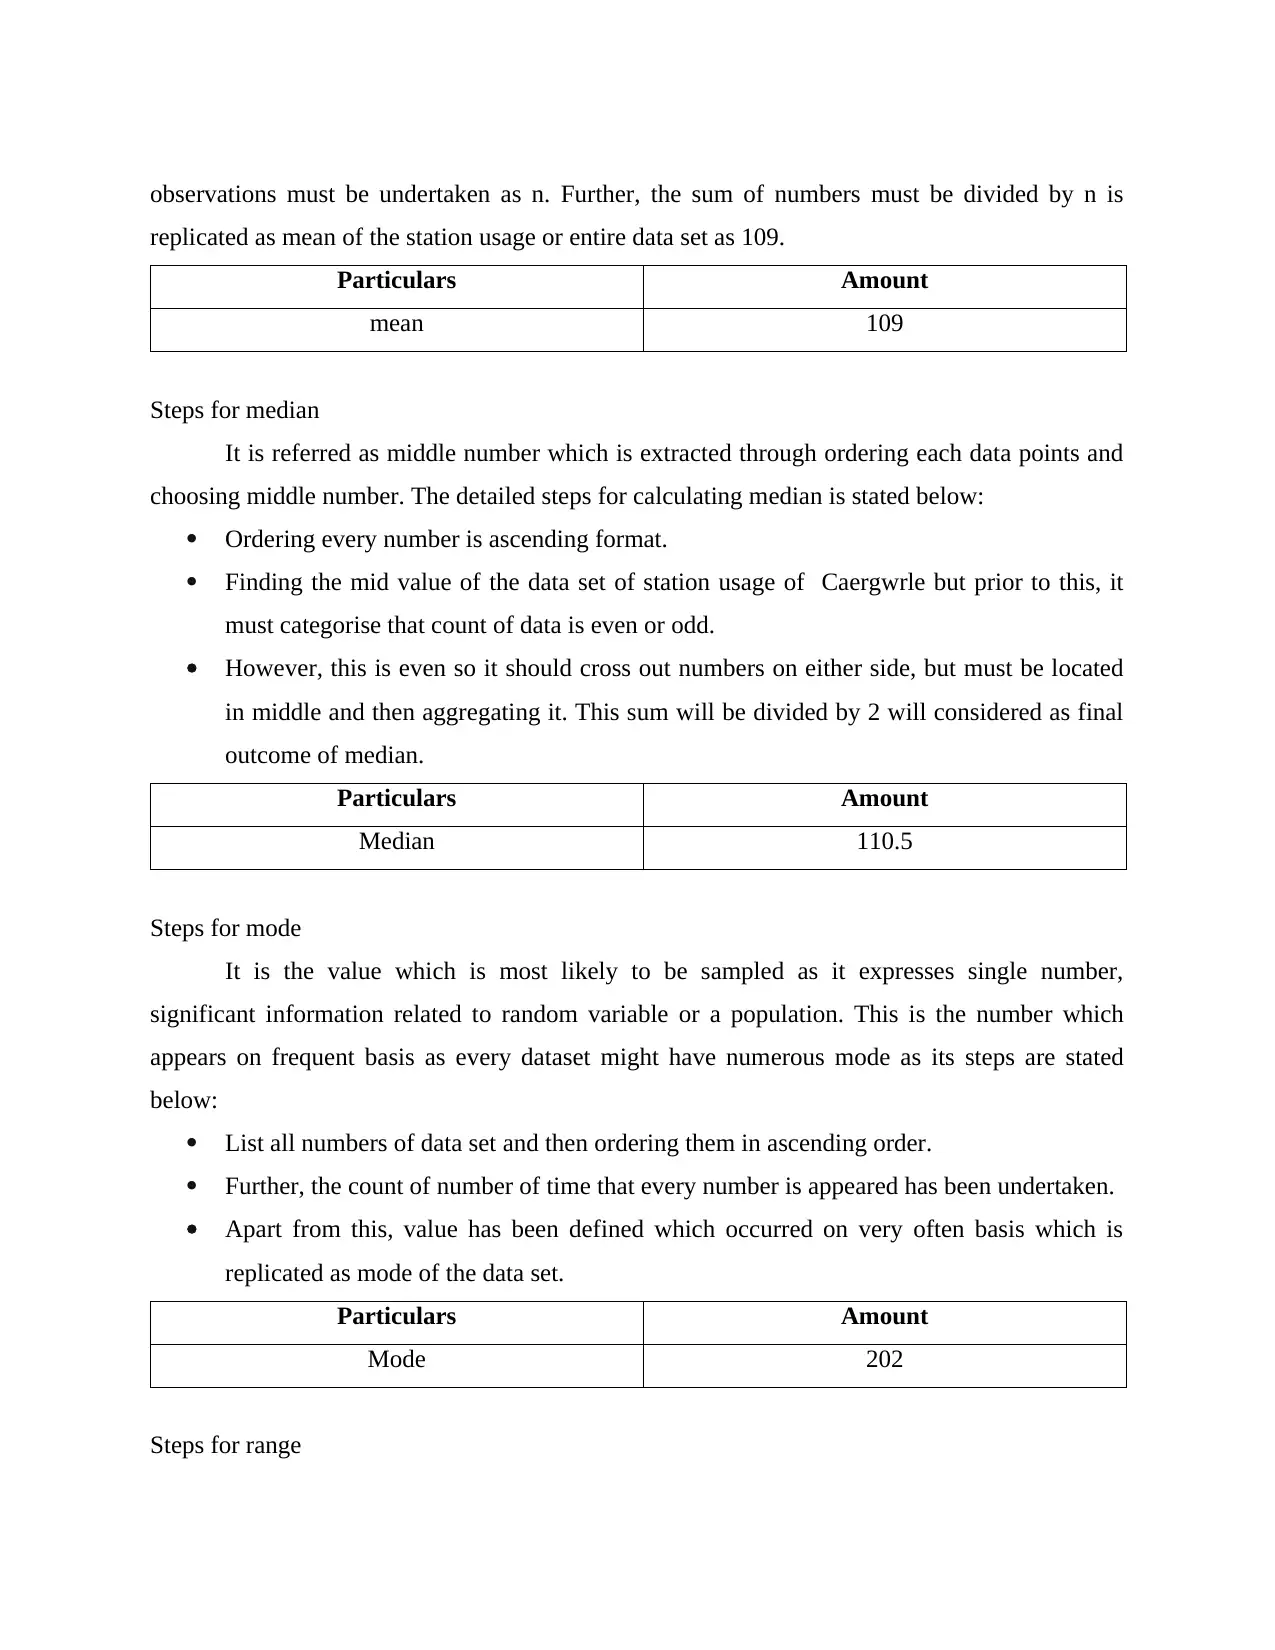
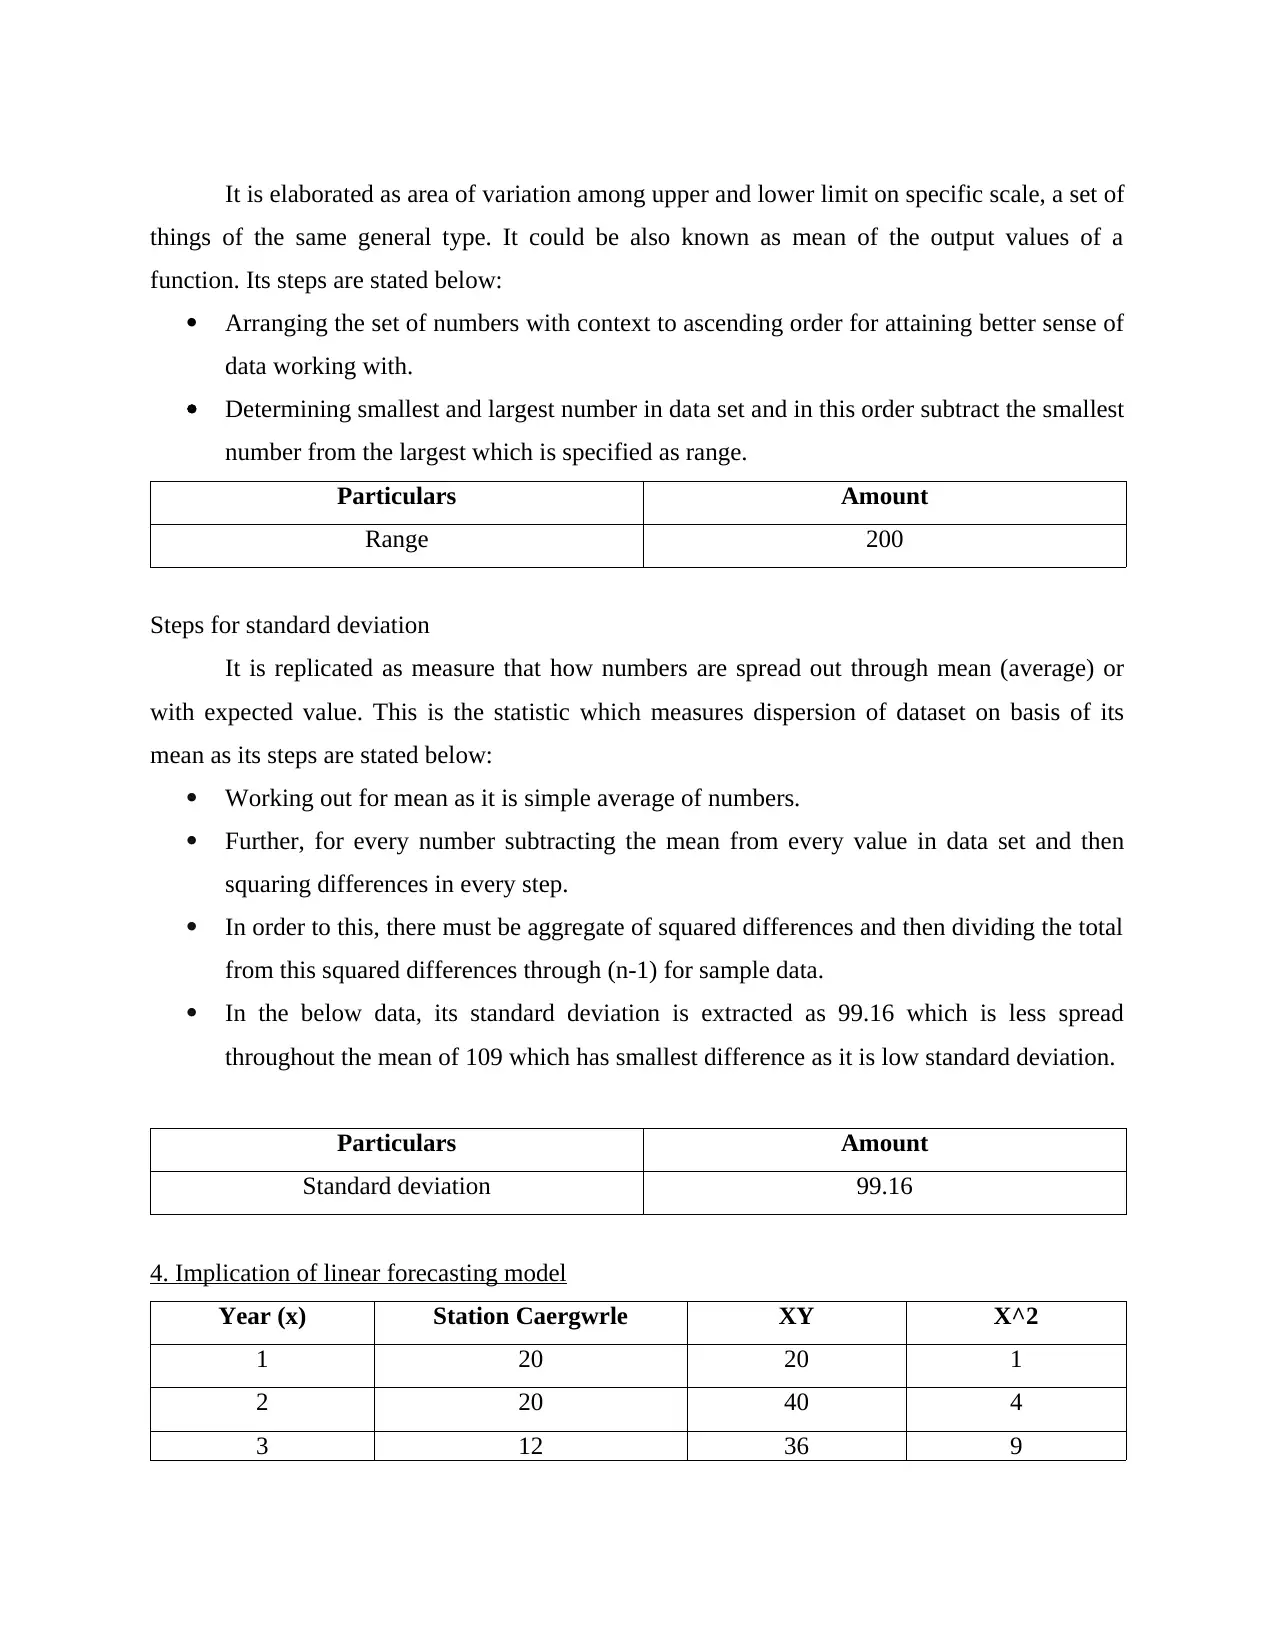
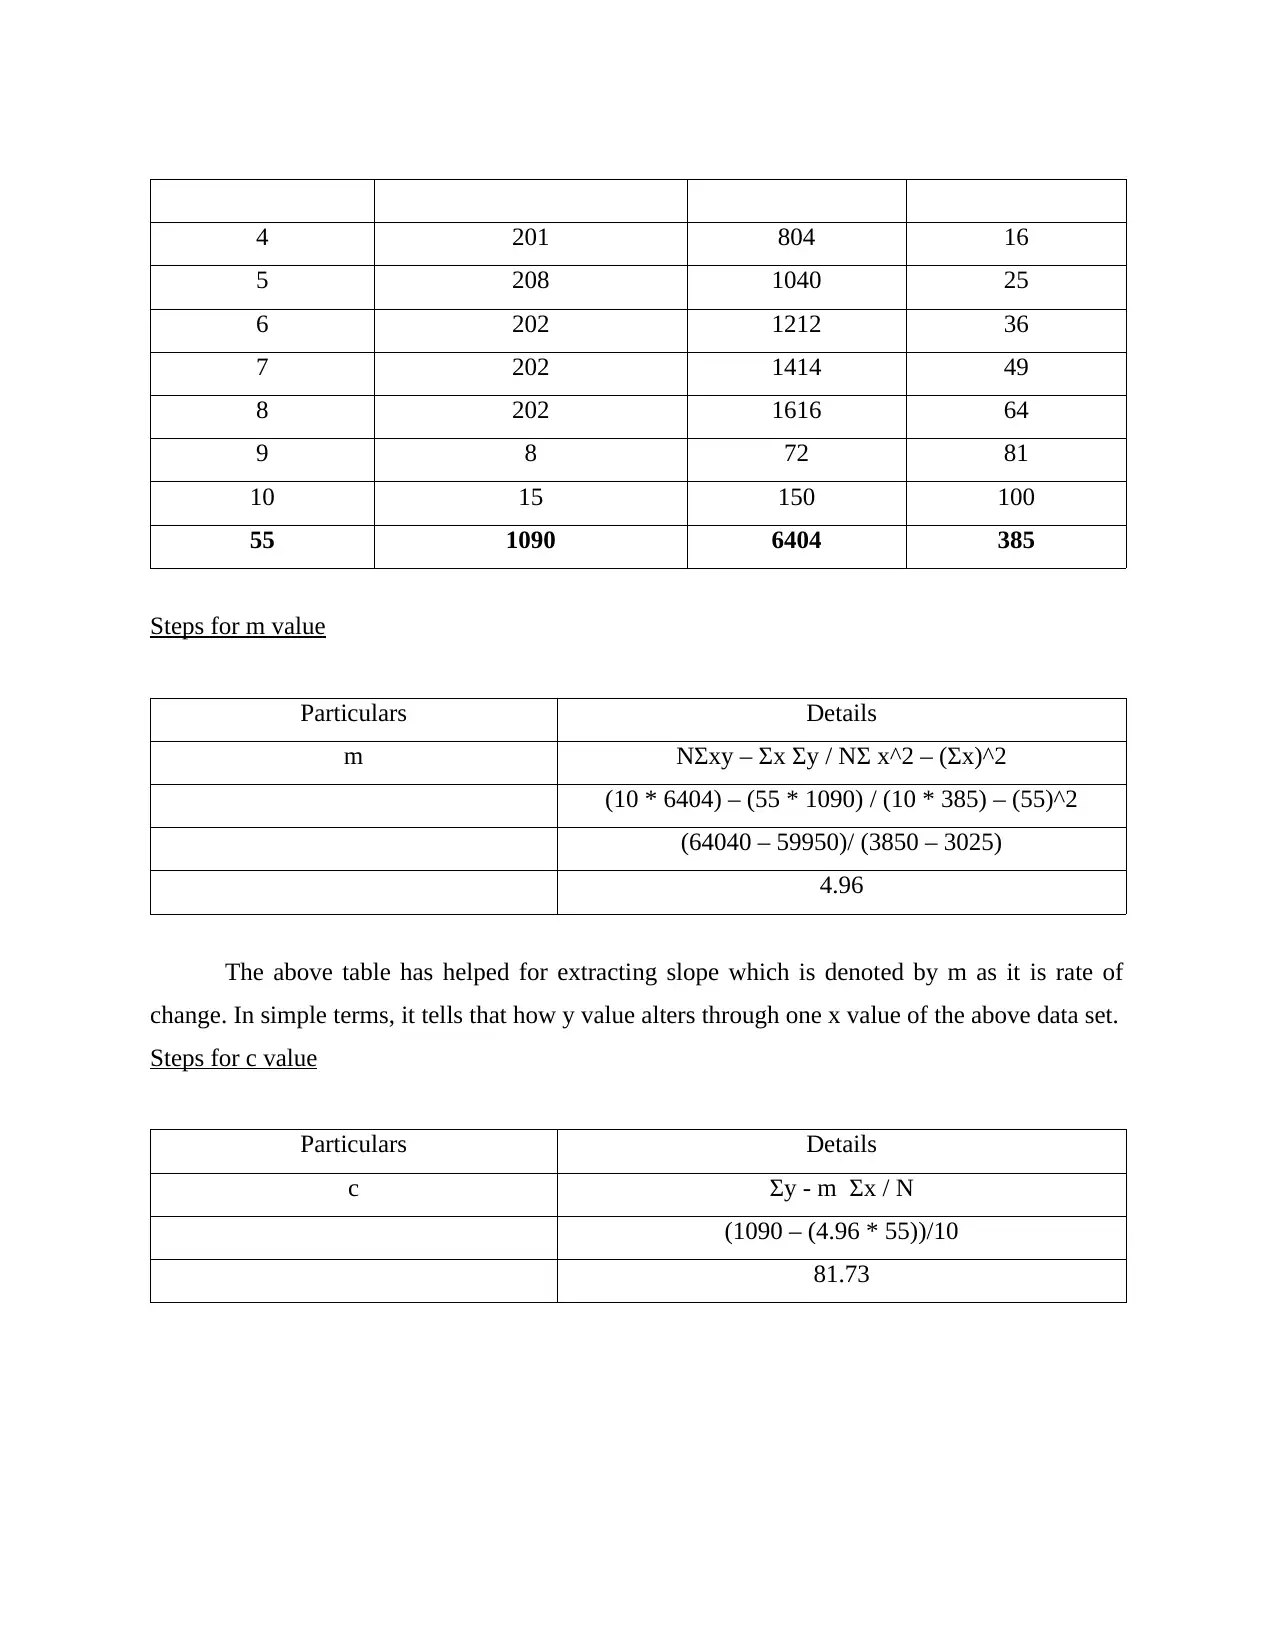
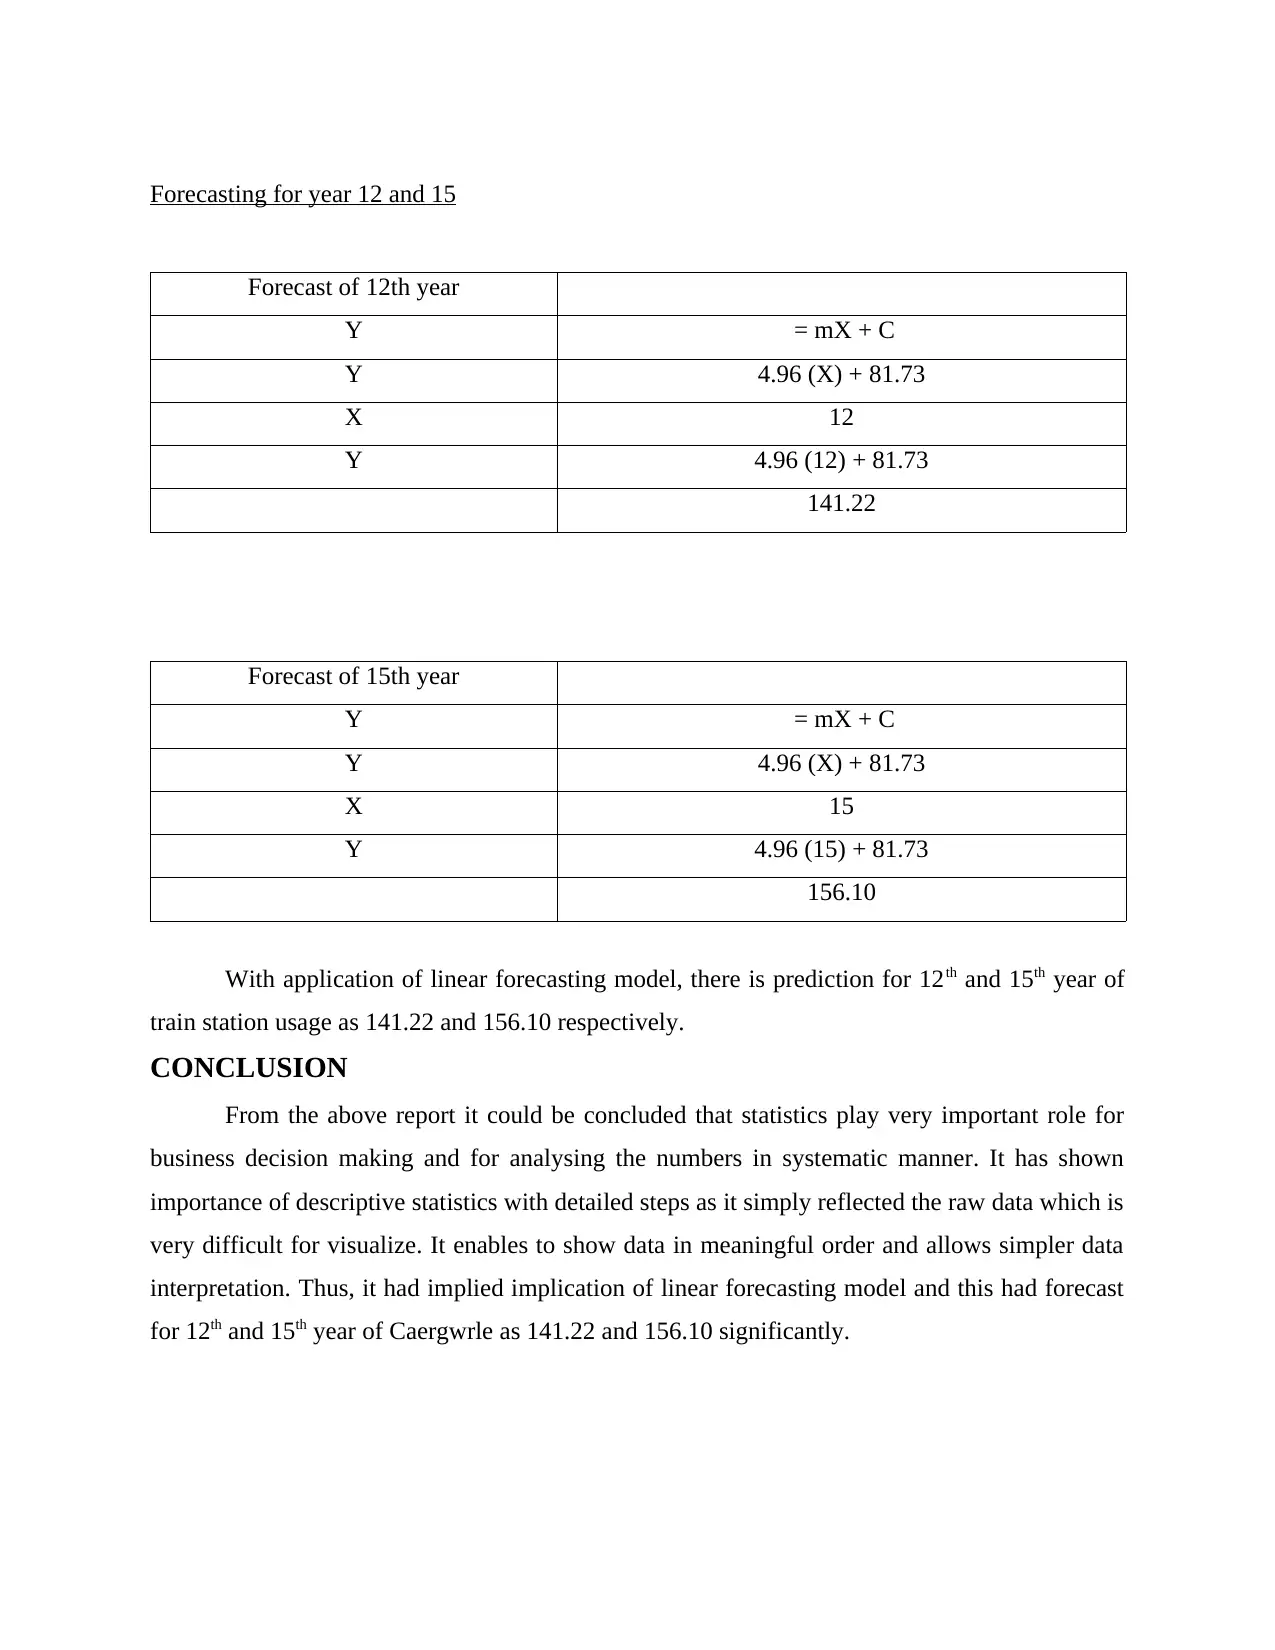
This report presents a data analysis of Caergwrle train station usage over a 10-year period. It begins by organizing the data in tabular and visual formats, including column and line charts for easy understanding. The report then delves into descriptive statistics, calculating and explaining the mean, median, mode, range, and standard deviation. Detailed steps are provided for each calculation. Furthermore, a linear forecasting model (y = mx + c) is applied to predict station usage for the 12th and 15th years. The report concludes with the forecast values and emphasizes the importance of statistics in business decision-making, highlighting how it transforms raw data into meaningful insights and facilitates simpler data interpretation.
1 out of 8
Related Documents


Your All-in-One AI-Powered Toolkit for Academic Success.
+13062052269
info@desklib.com
Available 24*7 on WhatsApp / Email
![[object Object]](/_next/static/media/star-bottom.7253800d.svg)
Copyright © 2020–2026 A2Z Services. All Rights Reserved. Developed and managed by ZUCOL.