Statistical Analysis: Comprehensive Sample Size Calculation Report

Verified

Added on  2023/01/12

|6
|881
|55
Homework Assignment
AI Summary
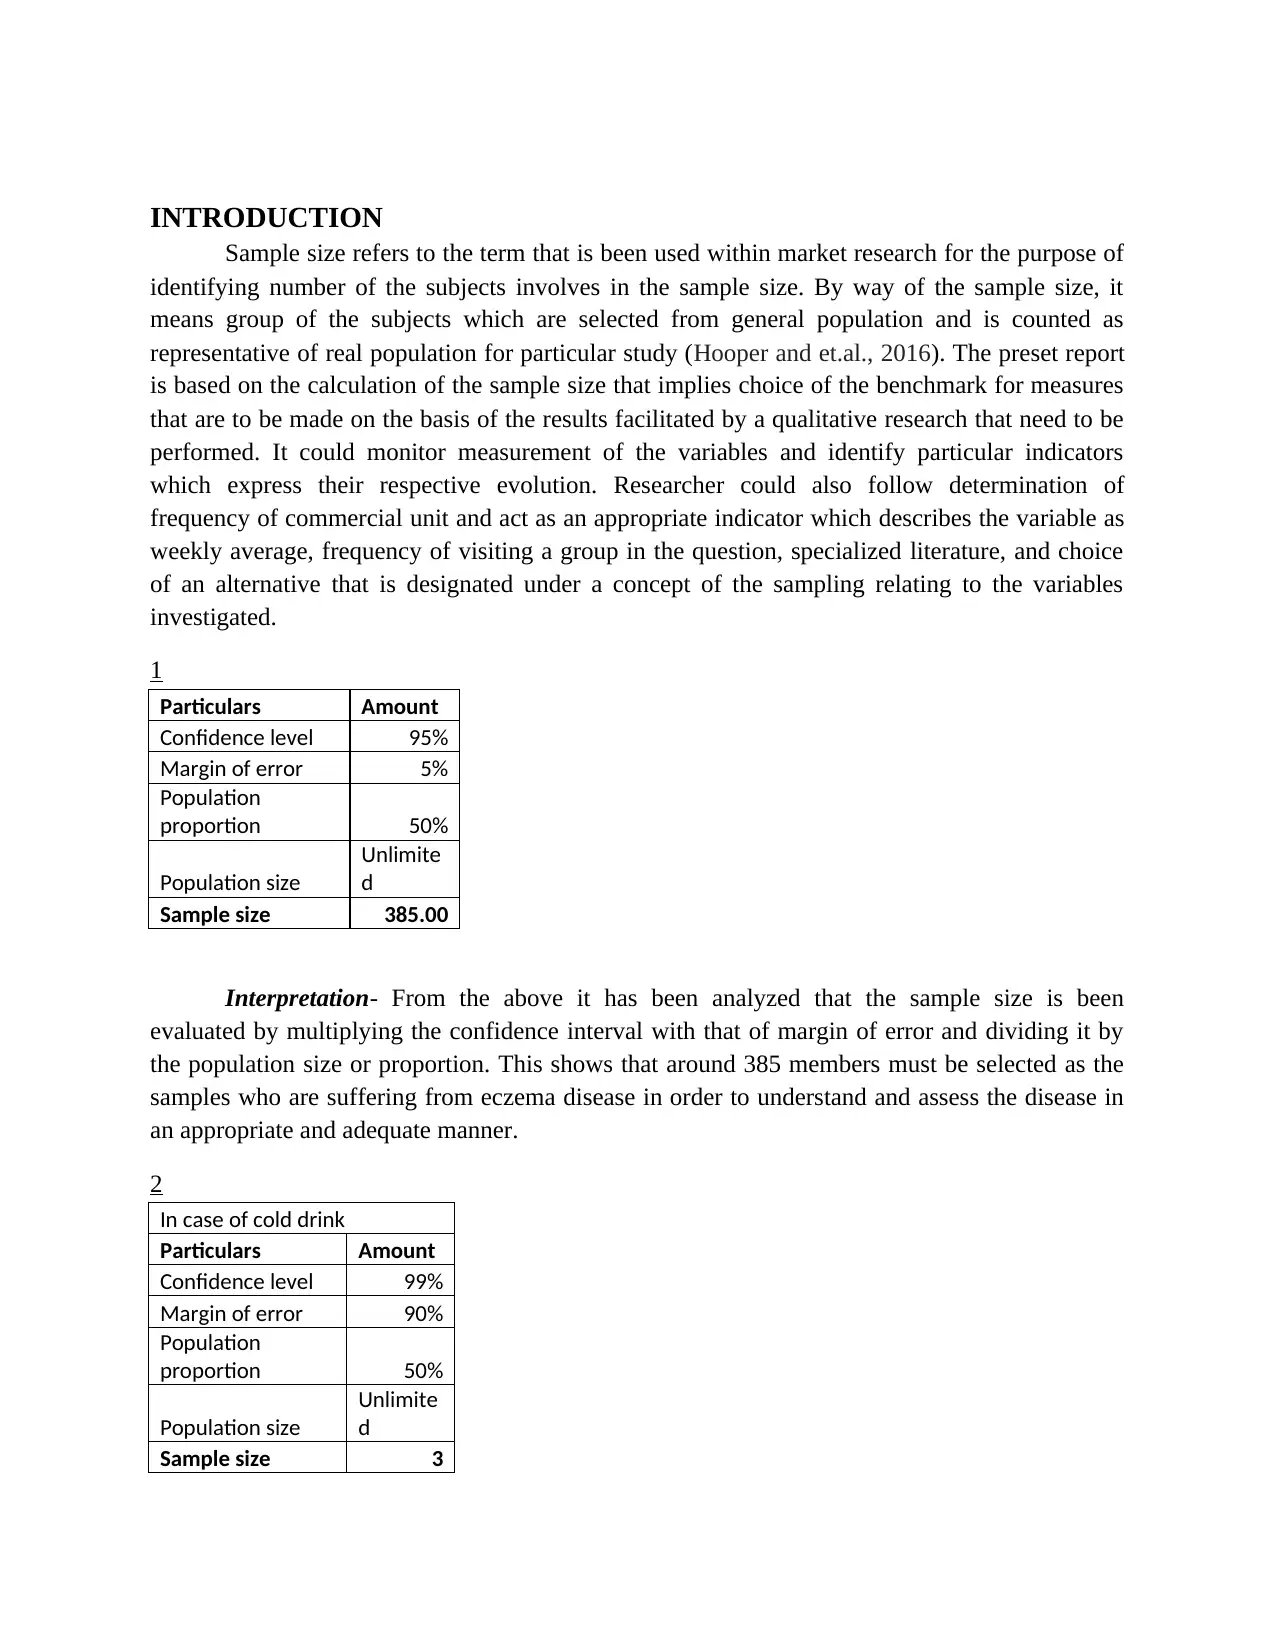
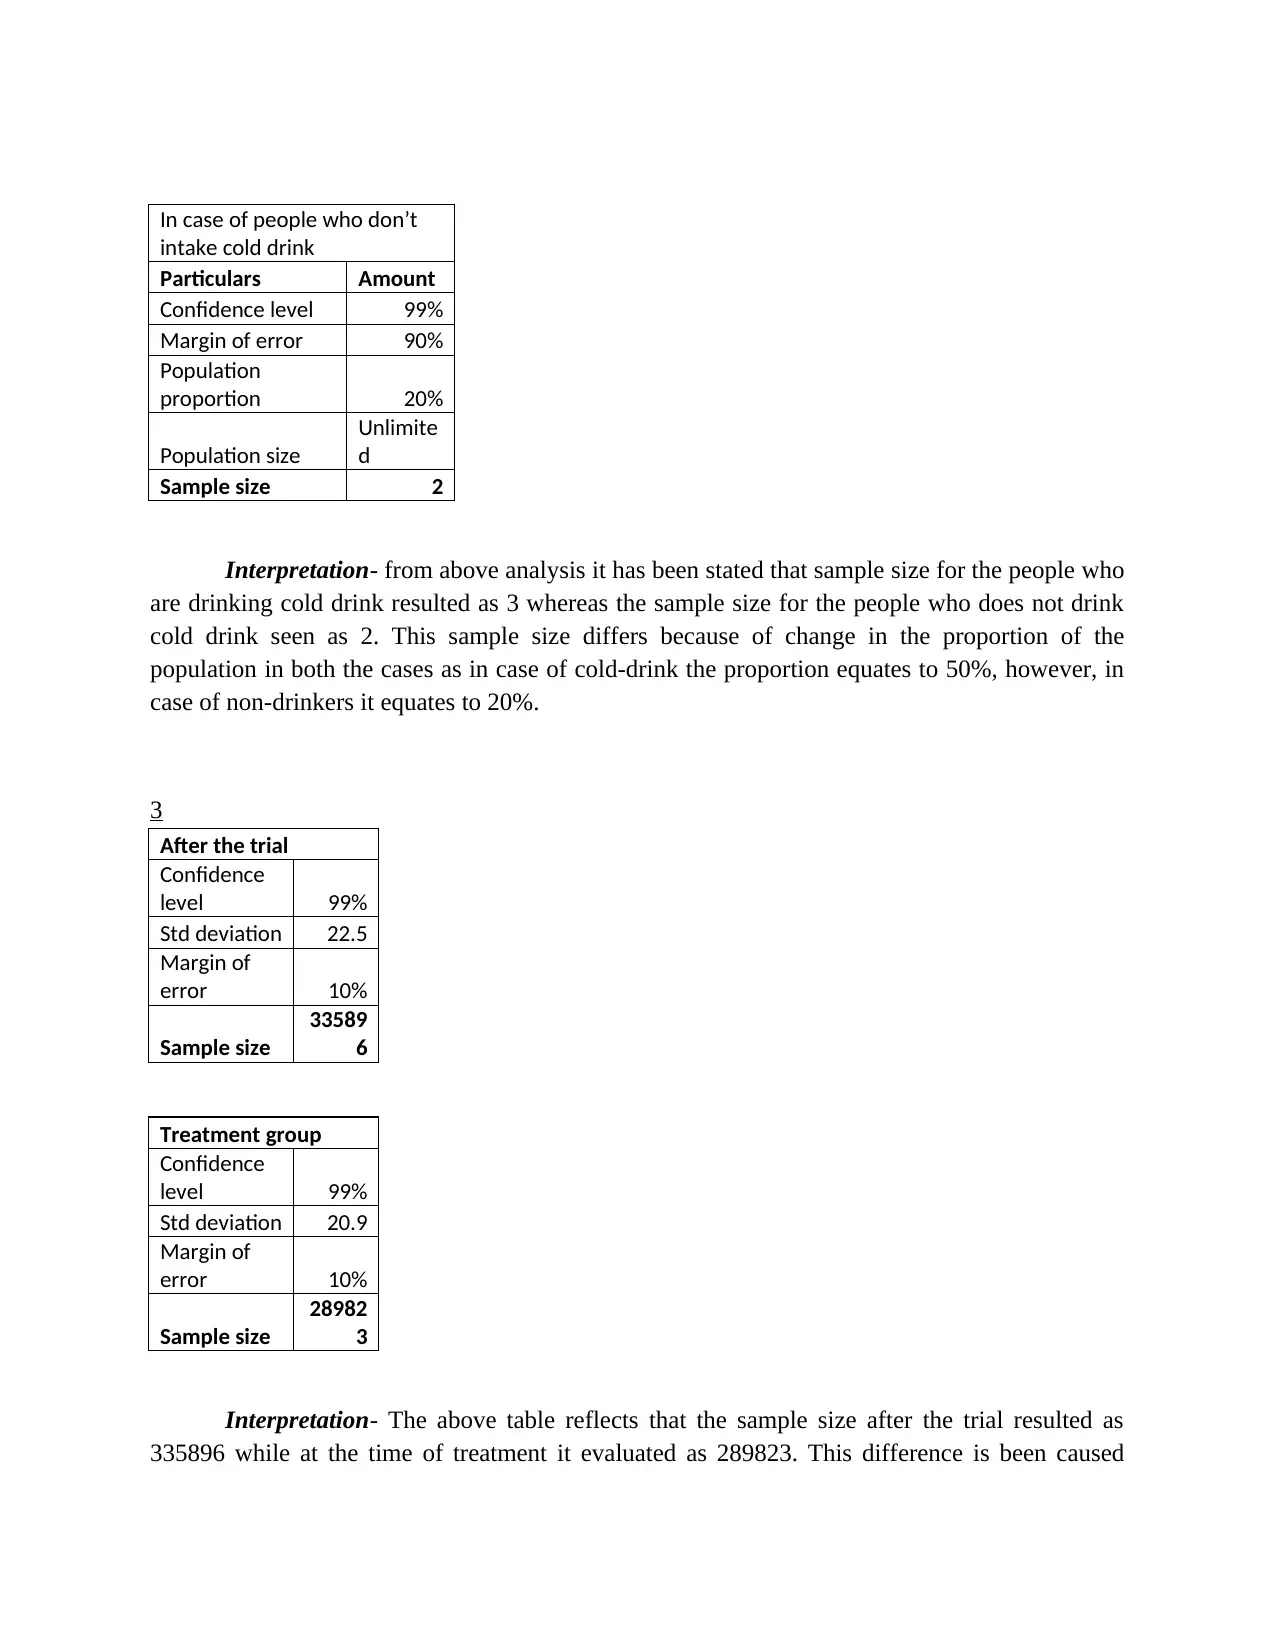
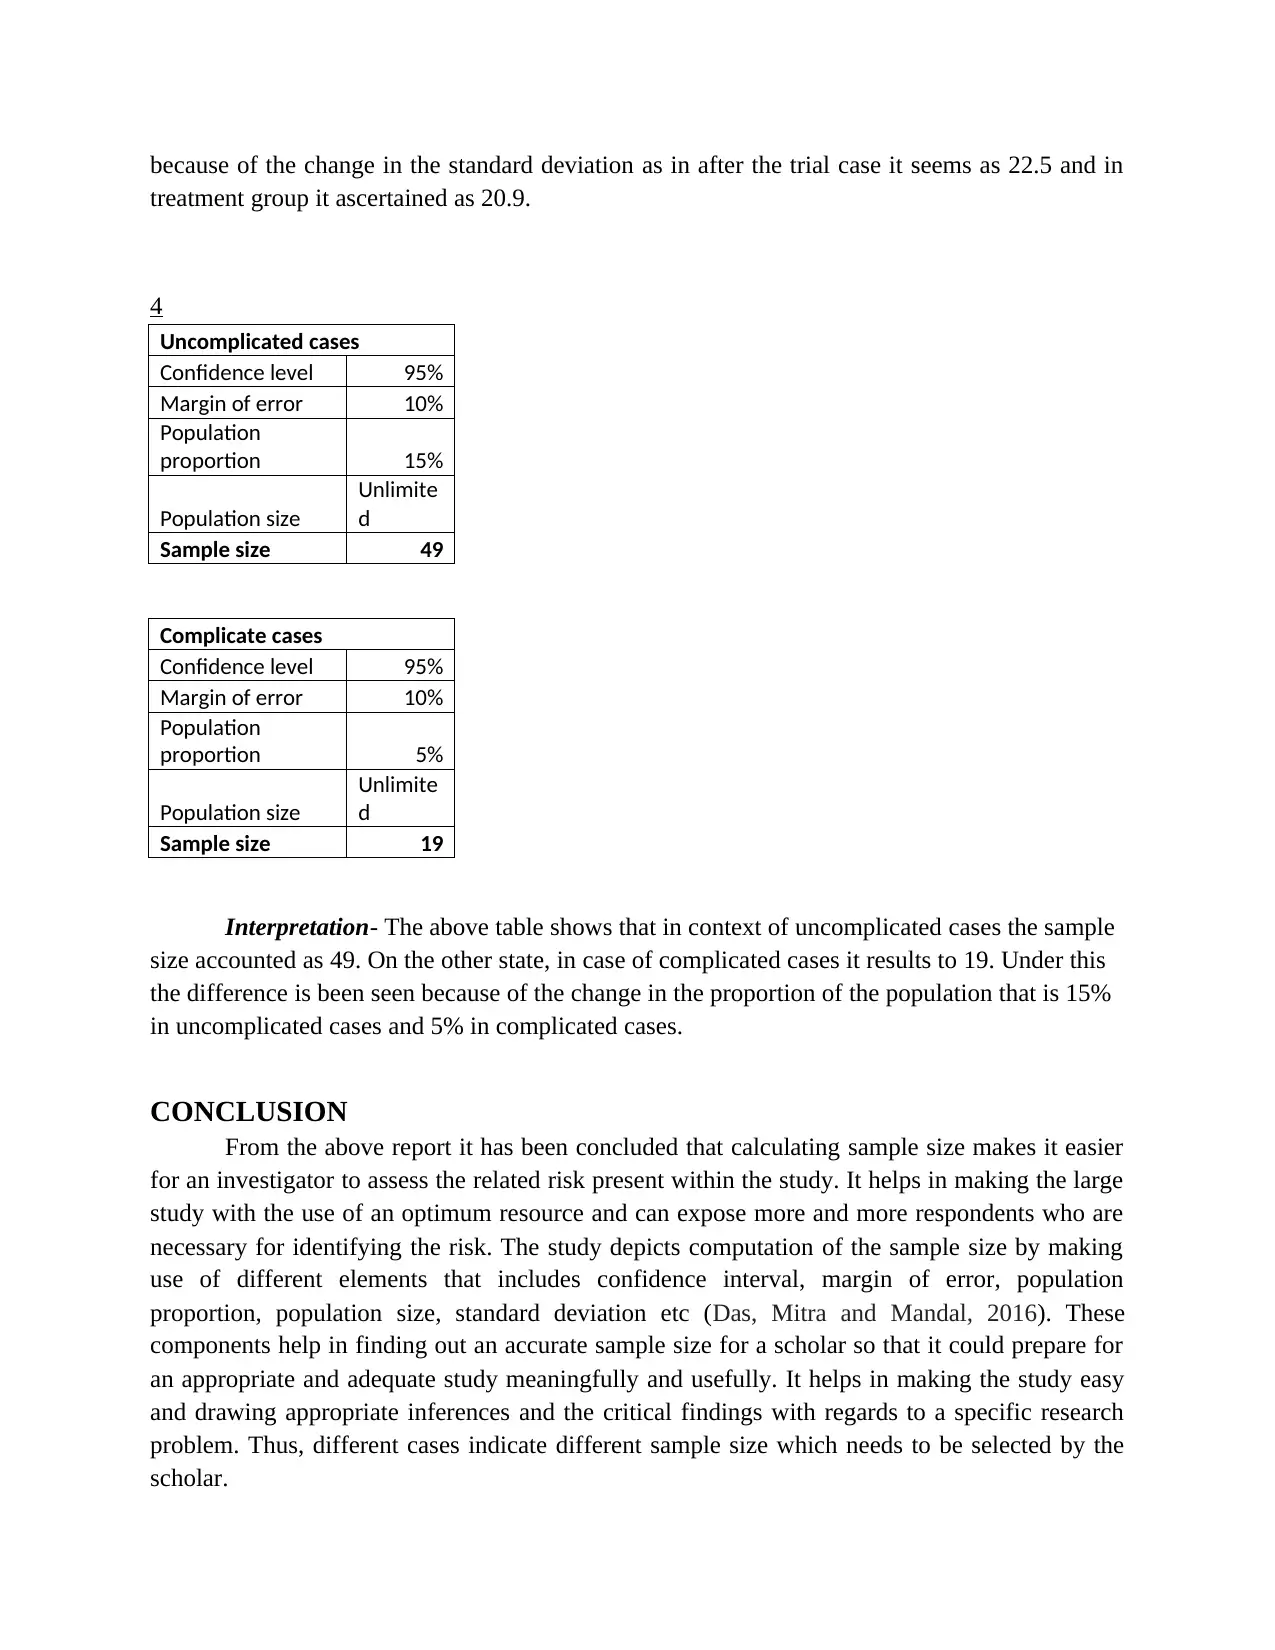
This report focuses on sample size calculation, a crucial aspect of statistical research. It explores the concept of sample size and its importance in representing a population accurately. The report provides examples of how to calculate sample size using various elements, including confidence levels, margin of error, population proportion, population size, and standard deviation. It presents calculations for different scenarios, such as eczema disease, cold drink consumption, and treatment trials, illustrating how variations in these elements affect the required sample size. The report concludes that accurate sample size calculation enables researchers to assess risks, optimize resource allocation, and draw meaningful conclusions, emphasizing the need for selecting appropriate sample sizes based on specific research problems. References to relevant journals and books are also provided.
Document Page
Sample size calculation
INTRODUCTION...........................................................................................................................3
1...................................................................................................................................................3
2...................................................................................................................................................3
3...................................................................................................................................................4
4...................................................................................................................................................5
CONCLUSION................................................................................................................................5
REFERENCES................................................................................................................................6
tabler-icon-diamond-filled.svg

Paraphrase This Document

Need a fresh take? Get an instant paraphrase of this document with our AI Paraphraser
Document Page
INTRODUCTION
Sample size refers to the term that is been used within market research for the purpose of
identifying number of the subjects involves in the sample size. By way of the sample size, it
means group of the subjects which are selected from general population and is counted as
representative of real population for particular study (Hooper and et.al., 2016). The preset report
is based on the calculation of the sample size that implies choice of the benchmark for measures
that are to be made on the basis of the results facilitated by a qualitative research that need to be
performed. It could monitor measurement of the variables and identify particular indicators
which express their respective evolution. Researcher could also follow determination of
frequency of commercial unit and act as an appropriate indicator which describes the variable as
weekly average, frequency of visiting a group in the question, specialized literature, and choice
of an alternative that is designated under a concept of the sampling relating to the variables
investigated.
1
Particulars Amount
Confidence level 95%
Margin of error 5%
Population
proportion 50%
Population size
Unlimite
d
Sample size 385.00
Interpretation- From the above it has been analyzed that the sample size is been
evaluated by multiplying the confidence interval with that of margin of error and dividing it by
the population size or proportion. This shows that around 385 members must be selected as the
samples who are suffering from eczema disease in order to understand and assess the disease in
an appropriate and adequate manner.
2
In case of cold drink
Particulars Amount
Confidence level 99%
Margin of error 90%
Population
proportion 50%
Population size
Unlimite
d
Sample size 3
Document Page
In case of people who don’t
intake cold drink
Particulars Amount
Confidence level 99%
Margin of error 90%
Population
proportion 20%
Population size
Unlimite
d
Sample size 2
Interpretation- from above analysis it has been stated that sample size for the people who
are drinking cold drink resulted as 3 whereas the sample size for the people who does not drink
cold drink seen as 2. This sample size differs because of change in the proportion of the
population in both the cases as in case of cold-drink the proportion equates to 50%, however, in
case of non-drinkers it equates to 20%.
3
After the trial
Confidence
level 99%
Std deviation 22.5
Margin of
error 10%
Sample size
33589
6
Treatment group
Confidence
level 99%
Std deviation 20.9
Margin of
error 10%
Sample size
28982
3
Interpretation- The above table reflects that the sample size after the trial resulted as
335896 while at the time of treatment it evaluated as 289823. This difference is been caused
Document Page
because of the change in the standard deviation as in after the trial case it seems as 22.5 and in
treatment group it ascertained as 20.9.
4
Uncomplicated cases
Confidence level 95%
Margin of error 10%
Population
proportion 15%
Population size
Unlimite
d
Sample size 49
Complicate cases
Confidence level 95%
Margin of error 10%
Population
proportion 5%
Population size
Unlimite
d
Sample size 19
Interpretation- The above table shows that in context of uncomplicated cases the sample
size accounted as 49. On the other state, in case of complicated cases it results to 19. Under this
the difference is been seen because of the change in the proportion of the population that is 15%
in uncomplicated cases and 5% in complicated cases.
CONCLUSION
From the above report it has been concluded that calculating sample size makes it easier
for an investigator to assess the related risk present within the study. It helps in making the large
study with the use of an optimum resource and can expose more and more respondents who are
necessary for identifying the risk. The study depicts computation of the sample size by making
use of different elements that includes confidence interval, margin of error, population
proportion, population size, standard deviation etc (Das, Mitra and Mandal, 2016). These
components help in finding out an accurate sample size for a scholar so that it could prepare for
an appropriate and adequate study meaningfully and usefully. It helps in making the study easy
and drawing appropriate inferences and the critical findings with regards to a specific research
problem. Thus, different cases indicate different sample size which needs to be selected by the
scholar.
tabler-icon-diamond-filled.svg

Paraphrase This Document

Need a fresh take? Get an instant paraphrase of this document with our AI Paraphraser
Document Page
Document Page
REFERENCES
Books and journals
Das, S., Mitra, K. and Mandal, M., 2016. Sample size calculation: Basic principles. Indian
journal of anaesthesia. 60(9). p.652.
Hooper, R. and et.al., 2016. Sample size calculation for stepped wedge and other longitudinal
cluster randomised trials. Statistics in medicine. 35(26). pp.4718-4728.
chevron_up_icon
1 out of 6
circle_padding
hide_on_mobile
zoom_out_icon
[object Object]