Capstone Research Presentation: Calculator Use in Math Class

Verified

Added on  2021/04/16

|20
|1258
|103
Project
AI Summary
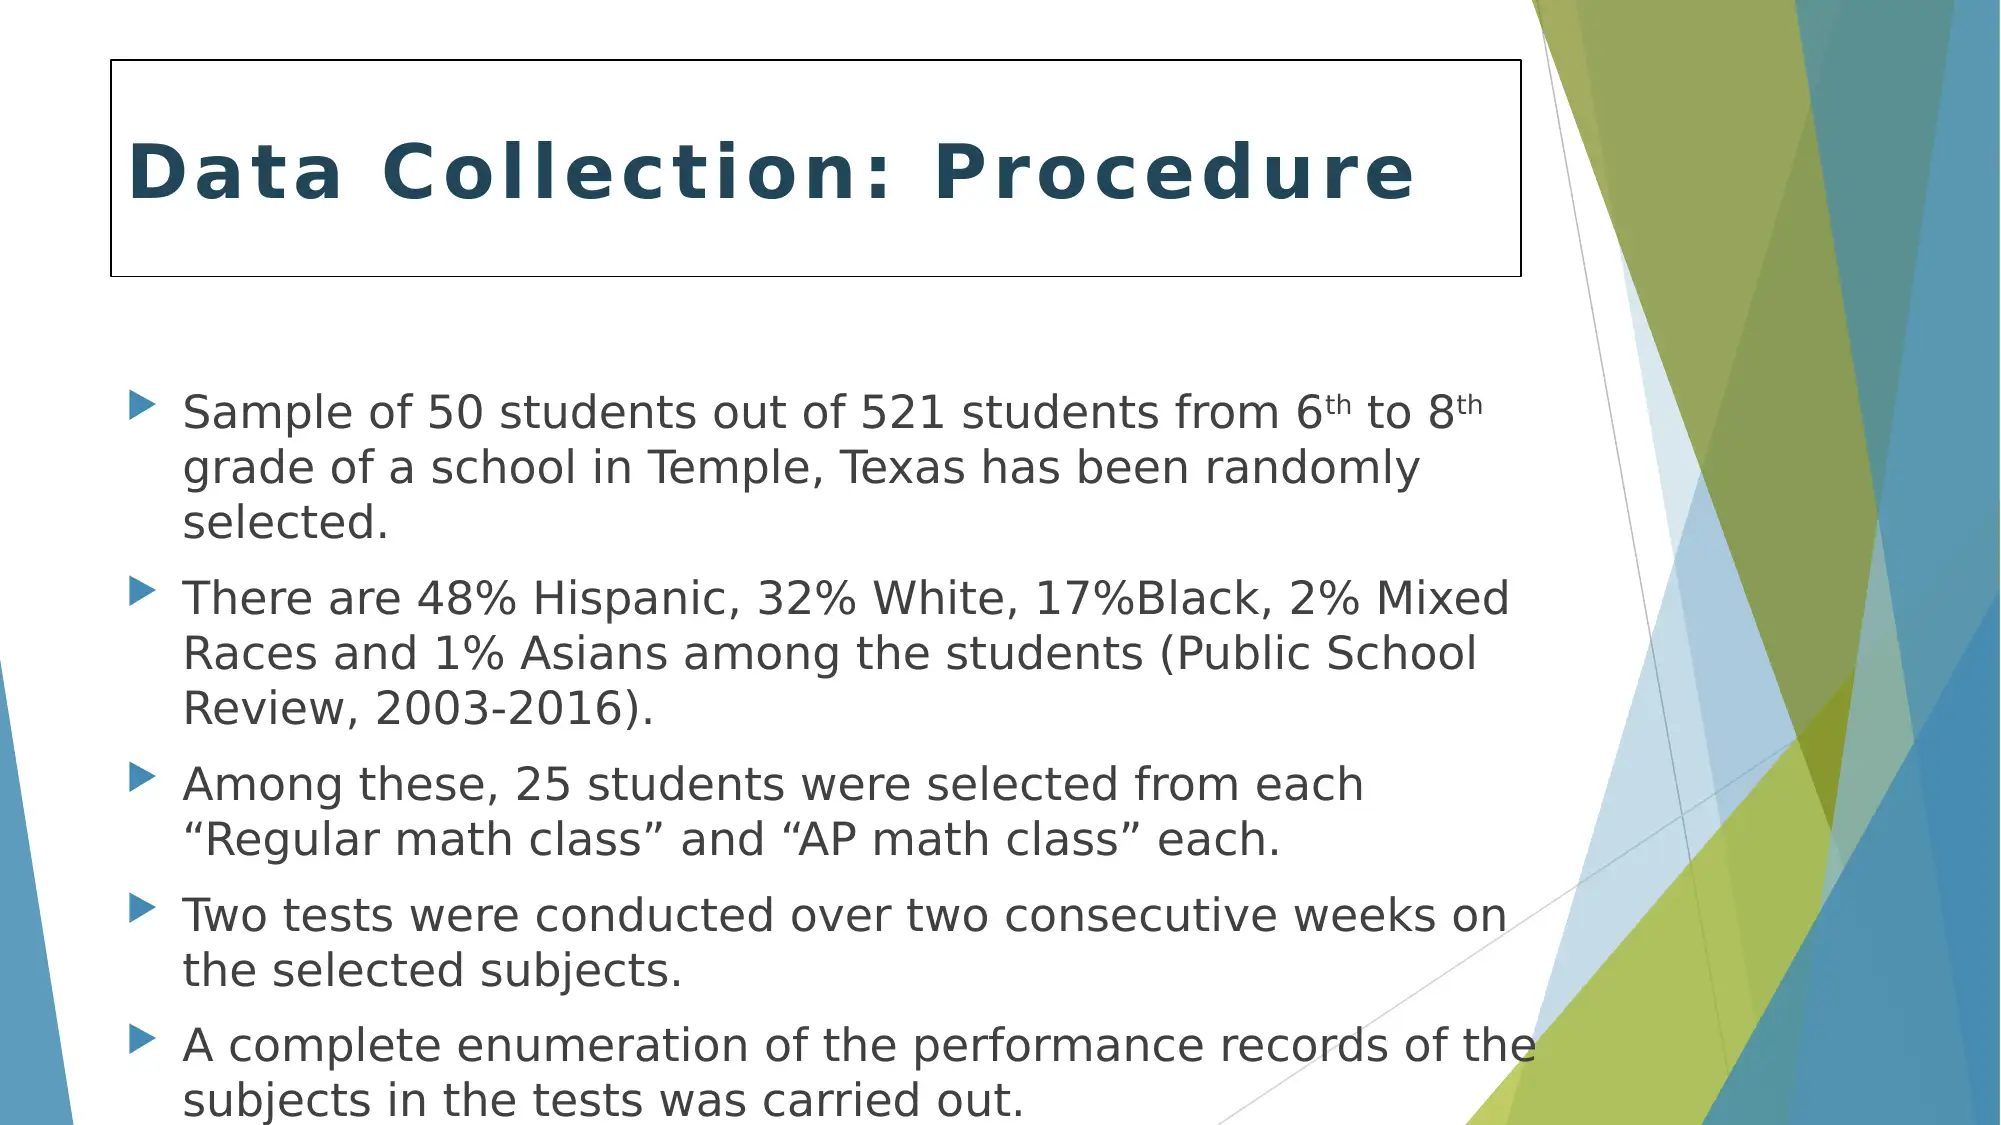
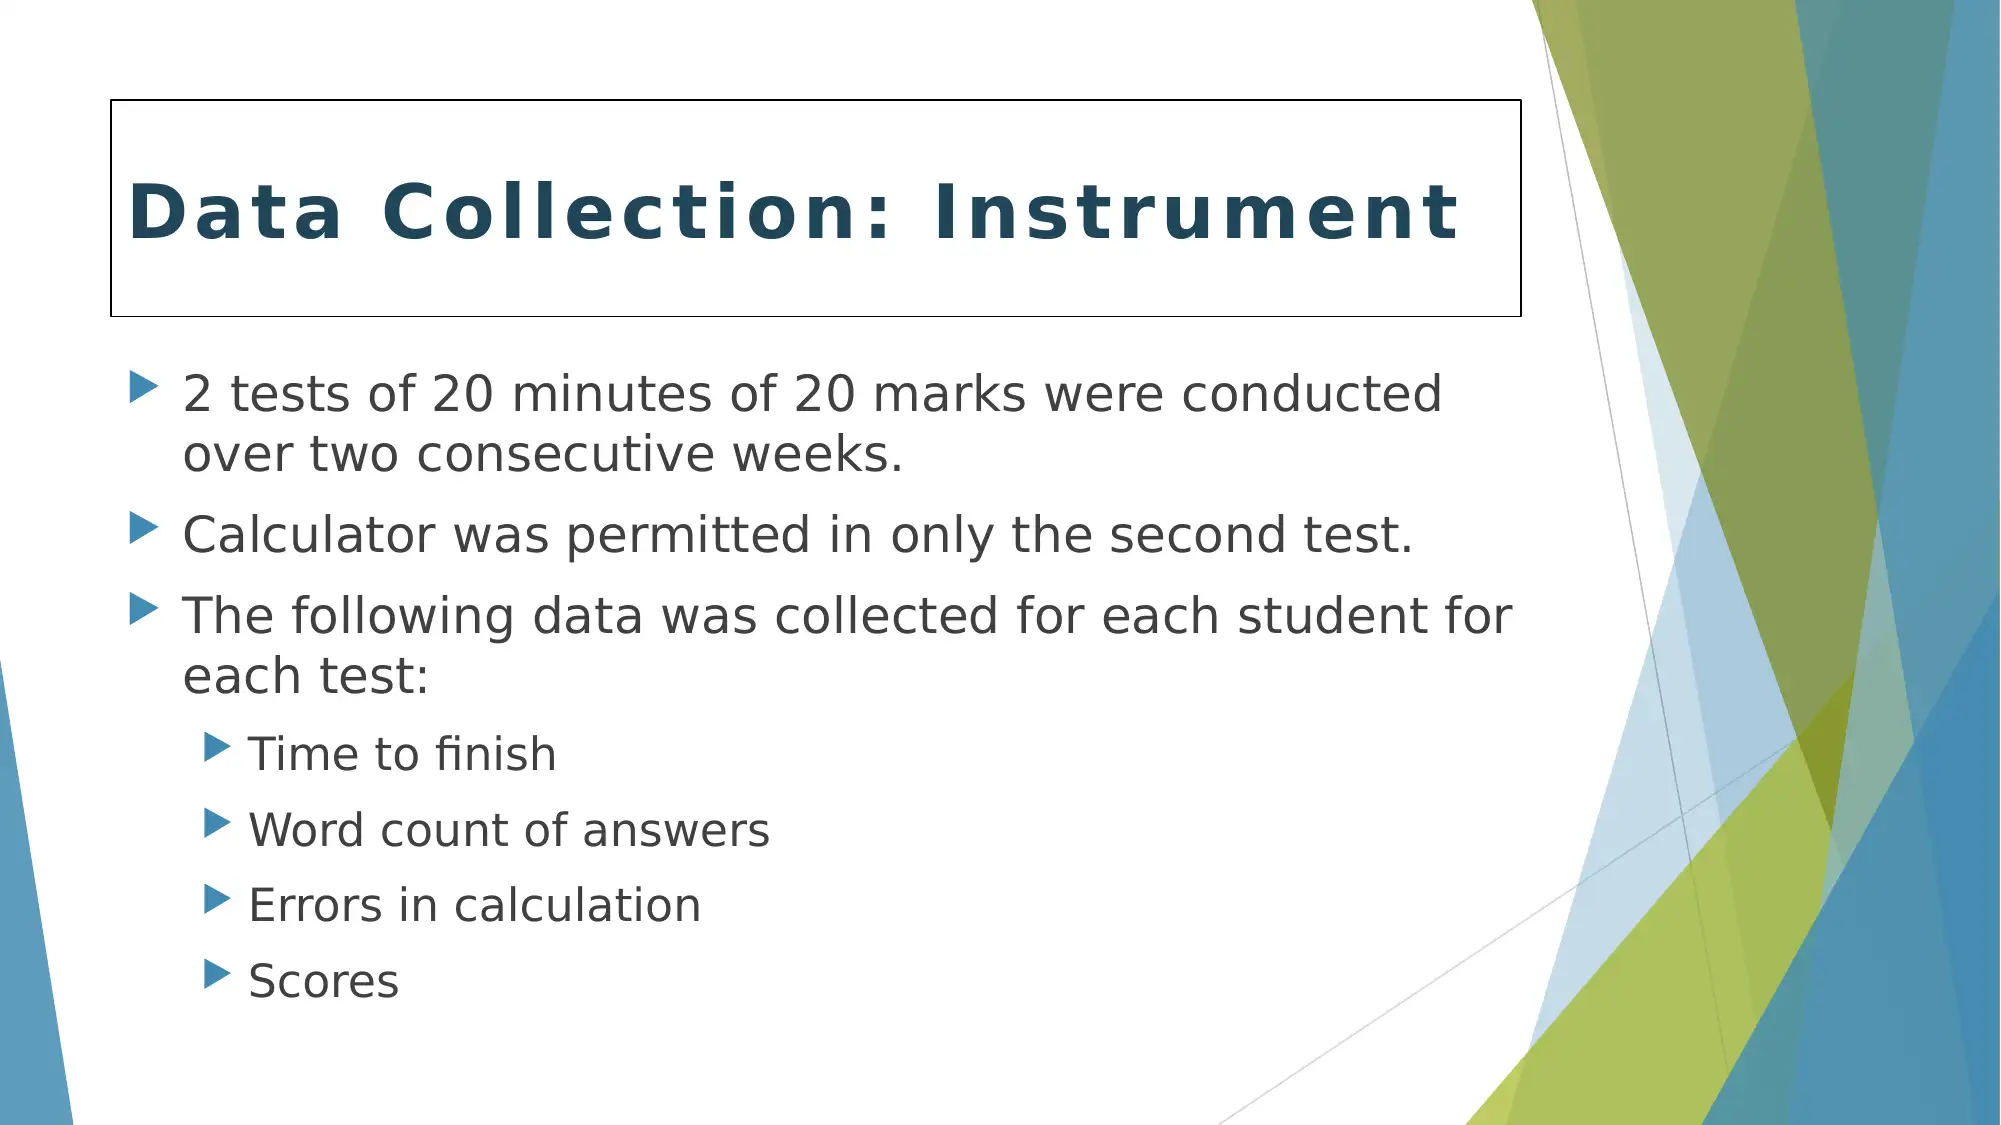
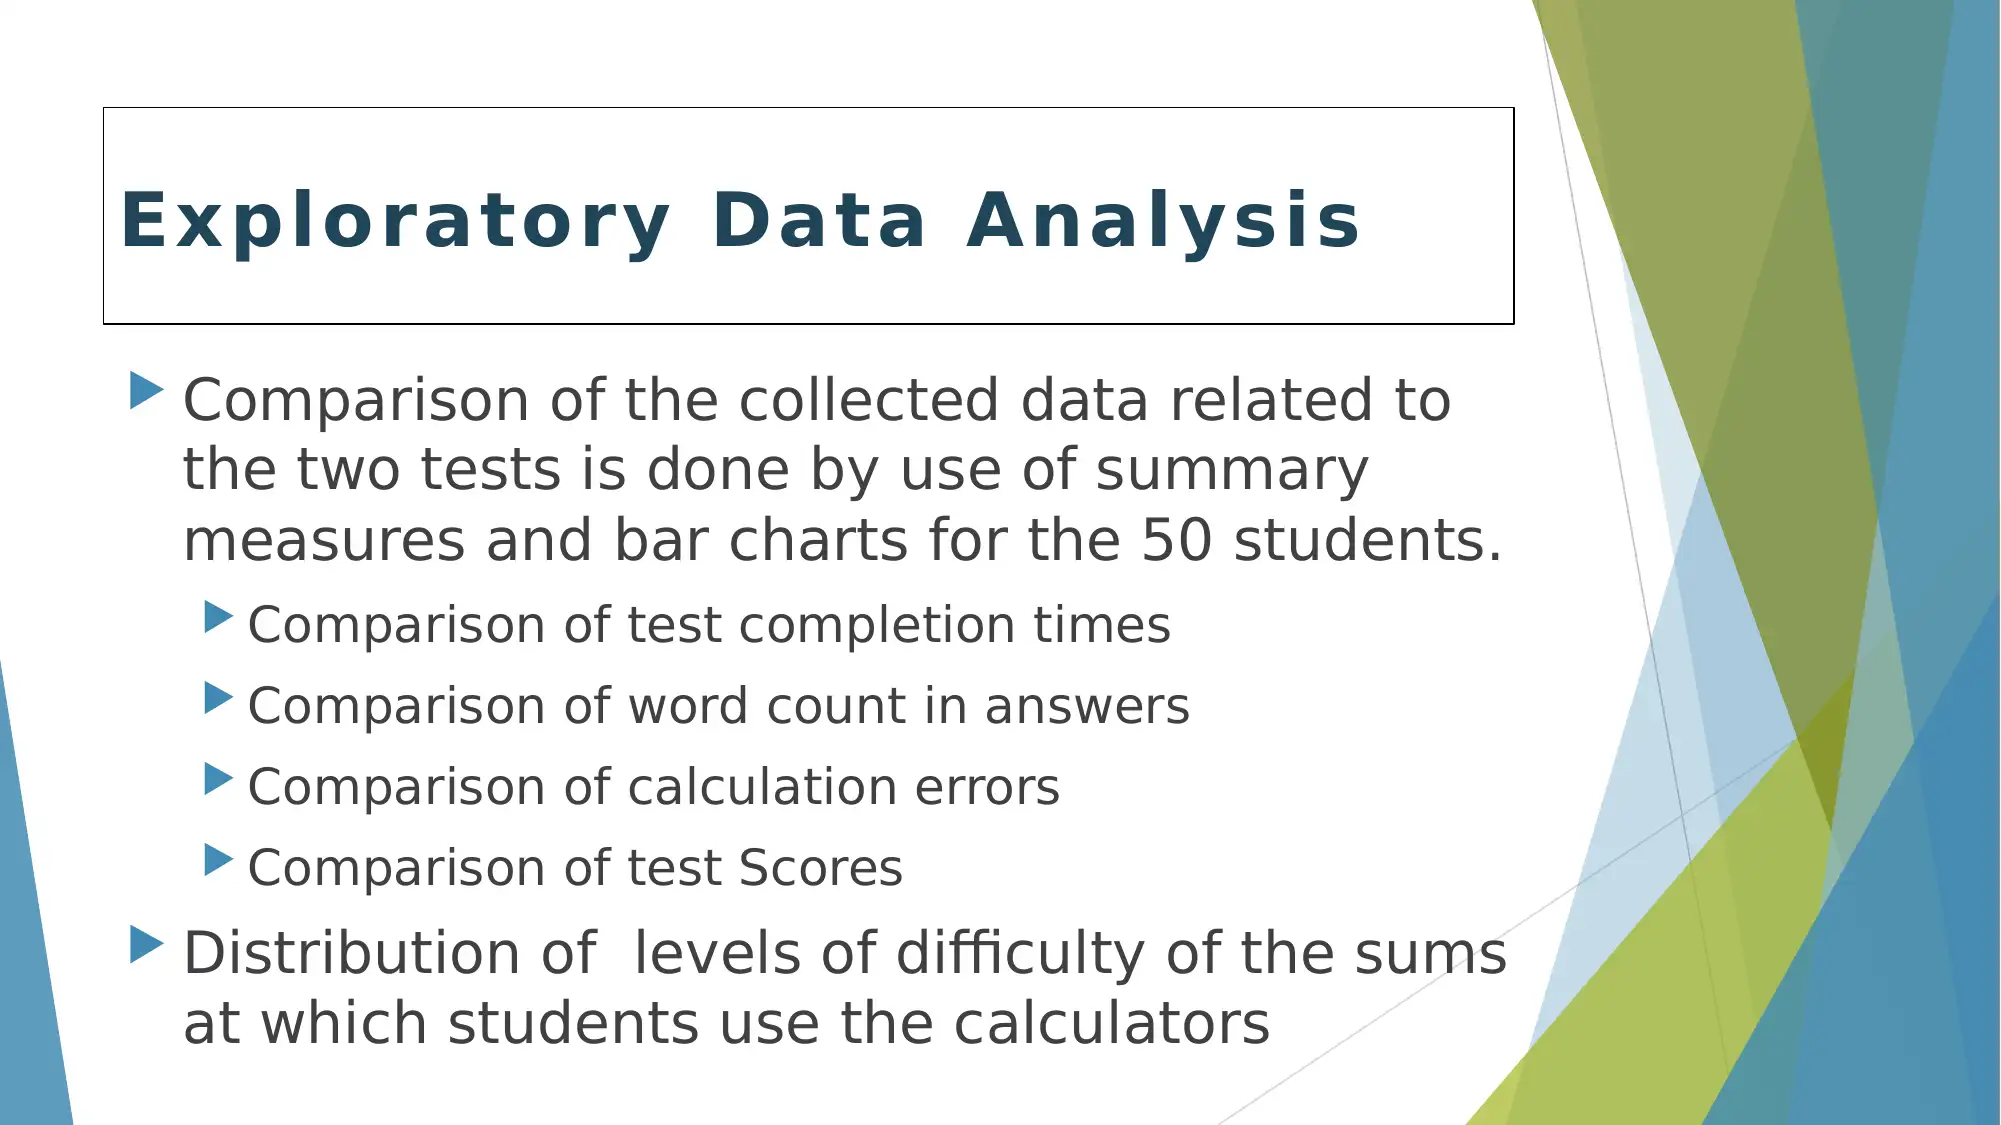
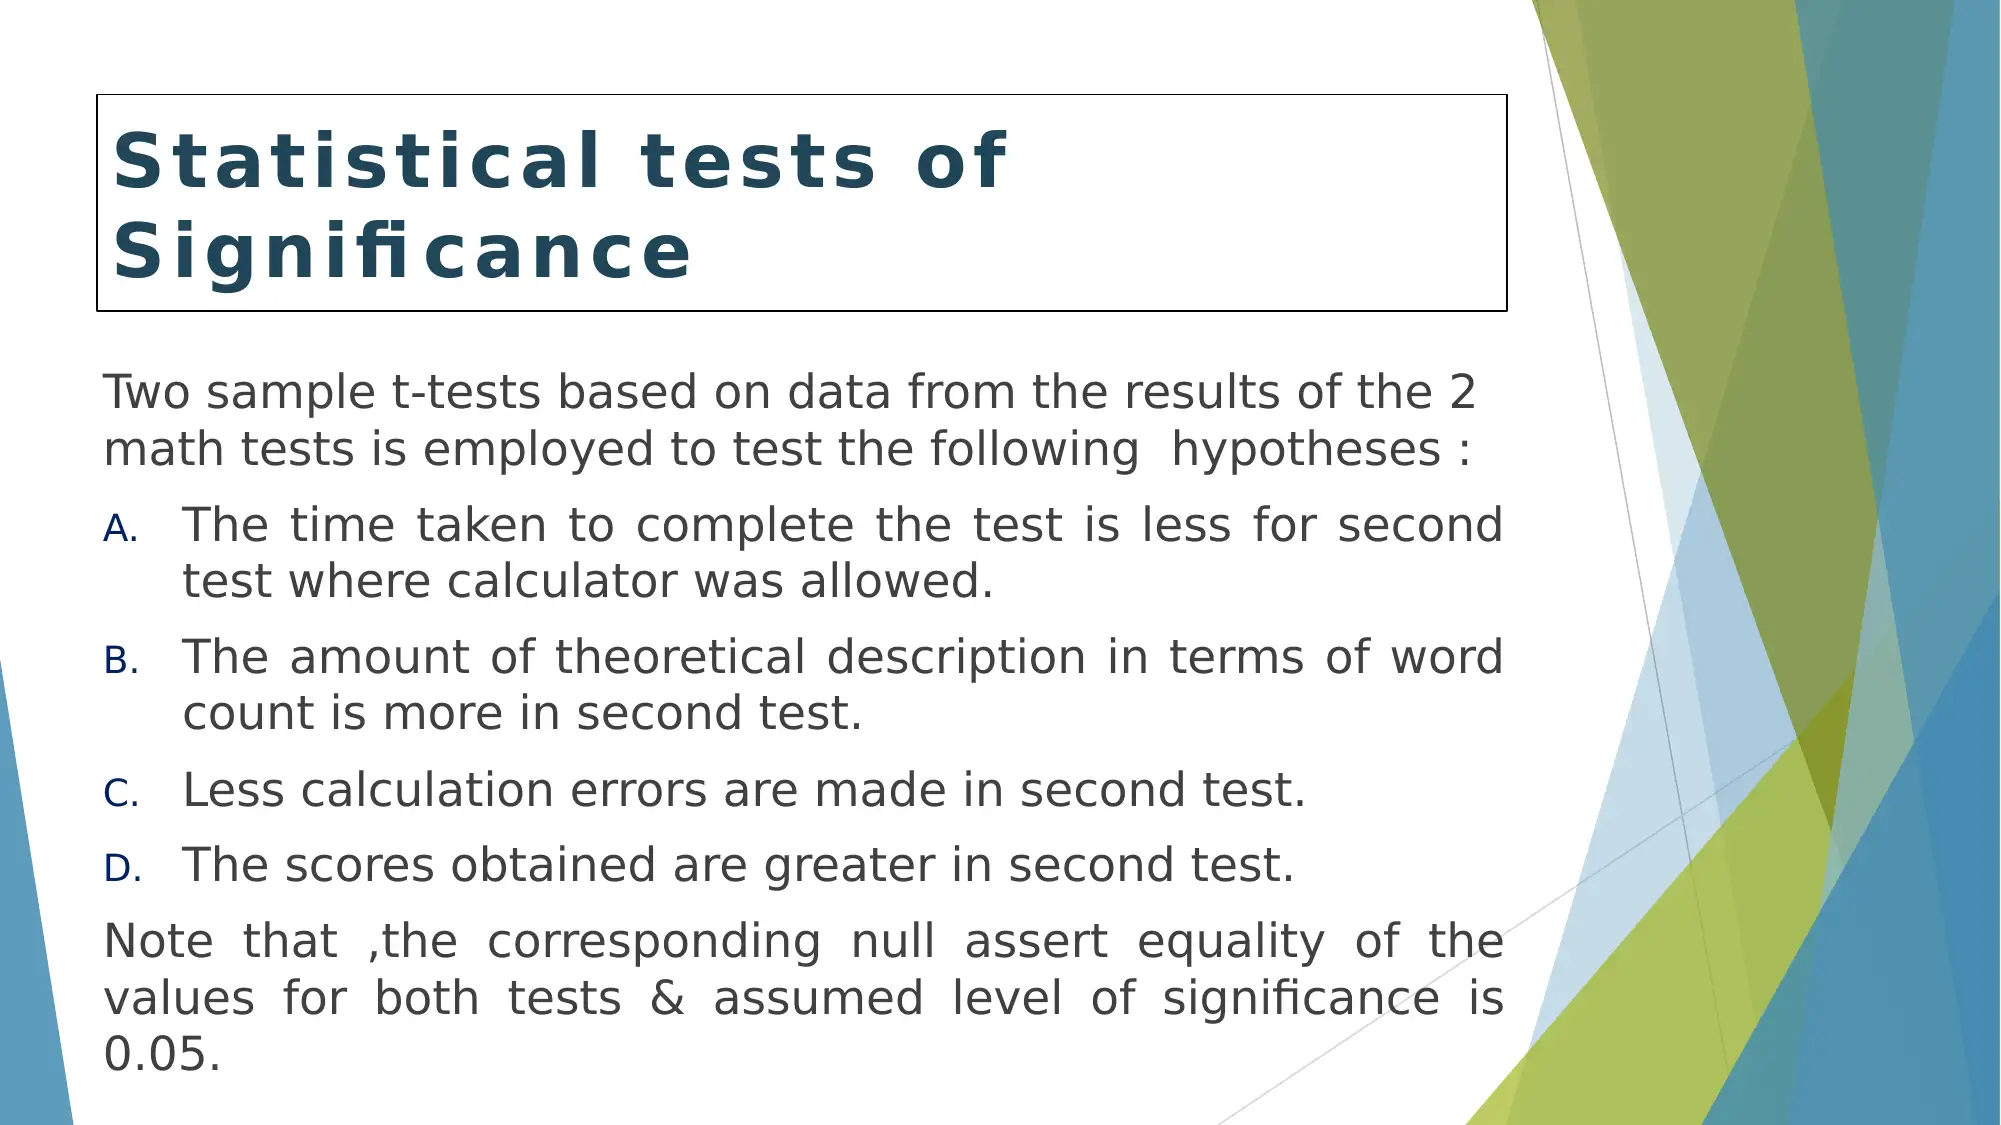
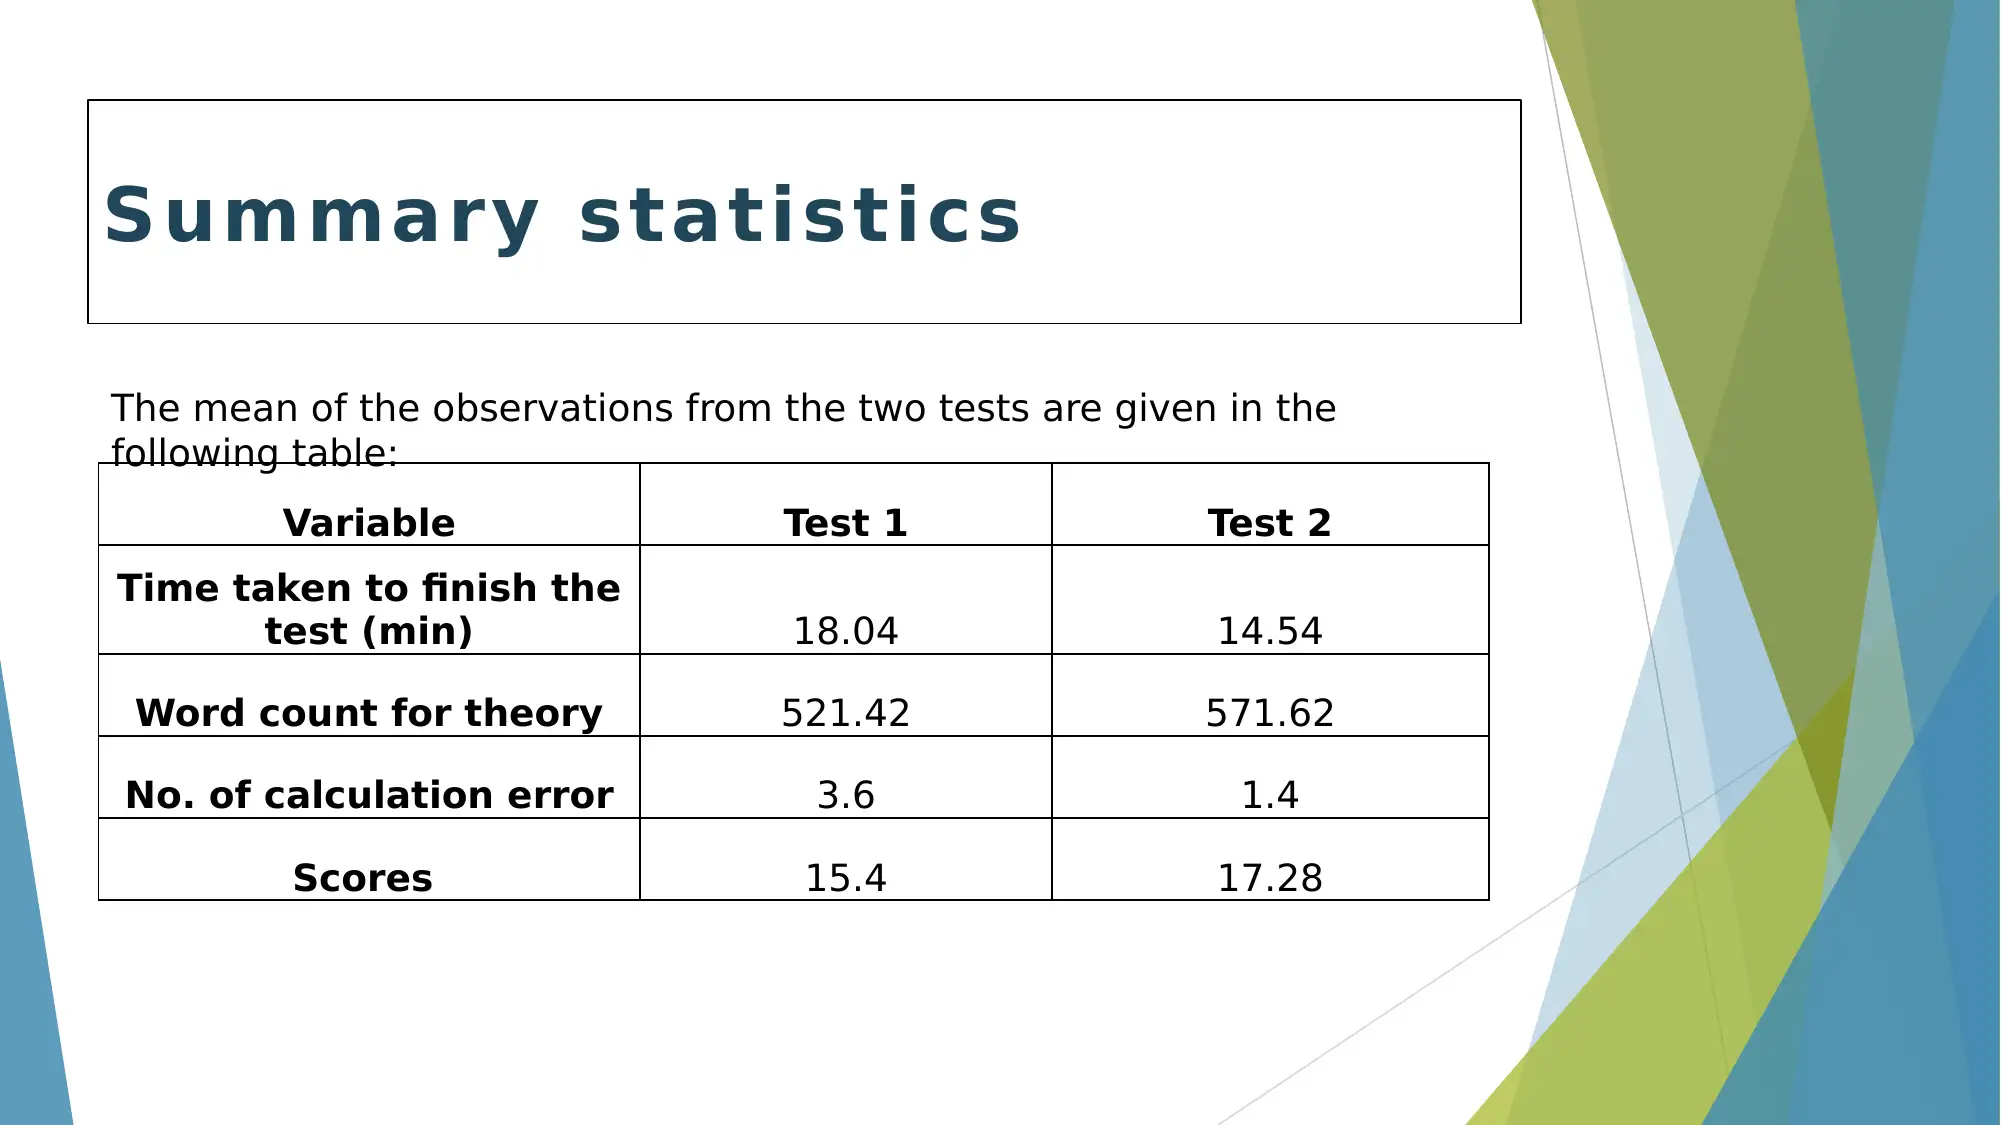
This capstone research presentation from the University of Texas at Arlington investigates the impact of calculators on middle school students' performance in mathematics. The study, conducted with a sample of students in Temple, Texas, employs a statistical approach to analyze the effects of calculator use on test scores, time taken to complete tests, word count in answers, and the frequency of calculation errors. The research compares data from tests where calculators were and were not permitted, using t-tests to evaluate hypotheses related to these factors. The findings suggest that calculators can significantly improve test scores, reduce the time needed to complete tests, and enable students to focus on conceptual understanding. The study concludes that calculators can be a beneficial tool in mathematics education, especially when used appropriately based on the difficulty level of the problems.
Document Page
Use of Calculator
in Mathematics
Class
Assignment 7:Capstone Research
Presentation
Melissa Crosswhite
University of Texas of Arlington
tabler-icon-diamond-filled.svg

Secure Best Marks with AI Grader

Need help grading? Try our AI Grader for instant feedback on your assignments.
Document Page
Abstract
The research aims to study the effect of
calculators by students in a mathematics
class. The study has been conducted using a
statistical approach on the basis of a class
of middle school students in Texas. It has been
found that use of calculators improves test
scores and reduces time in taking the
test.
Document Page
Introduction
Calculators save a lot of time spent in computing tedious
calculations.
Enables teachers and students to focus on the more
conceptual side and real world implication of mathematics
rather than the monotonous techniques of number
crunching.
Problem statement :Due to the use of calculators , students
and teachers can expend more time increasing mathematical
perception, reasoning, sense of numbers and its applicability.
This study helps understand the need of the theoretical basis
and process of calculators which makes it easy to have a
better understanding of the subject.
Document Page
Background
There are a lot of literature available on the negatives and
positives of using calculators in mathematics class.
The works by Dye (1981), Lloyd (1991) and Lawrance &
Dorans (1994), investigated and revealed that use of
calculator enhanced computational performance. It is
discussed how graphing calculators are linked with higher
scores despite its little influence on the speed with which
students accomplished the test.
Hembree and Dessart (1986) analysed and compared the
calculative and problem solving capabilities of groups who
have used calculators and those who have not used
calculators.They found that using calculators resulted in
superior results.
Milou (1999) discusses how use of calculators by middle
school students had reduced their aversion towards complex
multiplications and divisions.
Pearson (2010) argues that if calculators are permitted in a
test, then examinees should be made to be tested on their
skills of imputing arithmetic and geometric problems in the
calculator for answering the items properly.
Wu et al., (2012) discusses in general the patterns of
research in use of mobile computing devices in education.
Chen and Lai(2016) performed an analysis to reveal the role
of the calculator in the development of attitude of students
towards mathematics.
tabler-icon-diamond-filled.svg

Secure Best Marks with AI Grader

Need help grading? Try our AI Grader for instant feedback on your assignments.
Document Page
M e t h o d o l o g y
Document Page
Data Collection: Procedure
Sample of 50 students out of 521 students from 6th to 8th
grade of a school in Temple, Texas has been randomly
selected.
There are 48% Hispanic, 32% White, 17%Black, 2% Mixed
Races and 1% Asians among the students (Public School
Review, 2003-2016).
Among these, 25 students were selected from each
“Regular math class” and “AP math class” each.
Two tests were conducted over two consecutive weeks on
the selected subjects.
A complete enumeration of the performance records of the
subjects in the tests was carried out.
Document Page
Data Collection: Instrument
2 tests of 20 minutes of 20 marks were conducted
over two consecutive weeks.
Calculator was permitted in only the second test.
The following data was collected for each student for
each test:
Time to finish
Word count of answers
Errors in calculation
Scores
tabler-icon-diamond-filled.svg

Paraphrase This Document

Need a fresh take? Get an instant paraphrase of this document with our AI Paraphraser
Document Page
Comparison of the collected data related to
the two tests is done by use of summary
measures and bar charts for the 50 students.
Comparison of test completion times
Comparison of word count in answers
Comparison of calculation errors
Comparison of test Scores
Distribution of levels of difficulty of the sums
at which students use the calculators
Exploratory Data Analysis
Document Page
Two sample t-tests based on data from the results of the 2
math tests is employed to test the following hypotheses :
A. The time taken to complete the test is less for second
test where calculator was allowed.
B. The amount of theoretical description in terms of word
count is more in second test.
C. Less calculation errors are made in second test.
D. The scores obtained are greater in second test.
Note that ,the corresponding null assert equality of the
values for both tests & assumed level of significance is
0.05.
Statistical tests of
Signifi cance
Document Page
R e s u l t s
tabler-icon-diamond-filled.svg

Secure Best Marks with AI Grader

Need help grading? Try our AI Grader for instant feedback on your assignments.
Document Page
Summary statistics
Variable Test 1 Test 2
Time taken to finish the
test (min) 18.04 14.54
Word count for theory 521.42 571.62
No. of calculation error 3.6 1.4
Scores 15.4 17.28
The mean of the observations from the two tests are given in the
following table:
Document Page
1
3
5
7
9
11
13
15
17
19
21
23
25
27
29
31
33
35
37
39
41
43
45
47
49
0
5
10
15
20
25
Frequency distribution of time to finish the tests
Test 1
Test 2
Assigned Student Number
Time taken to finish the tests
1 2 3 4 5 6 7 8 9 1011121314151617181920212223242526272829303132333435363738394041424344454647484950
0
100
200
300
400
500
600
700
800
Frequency distribution of word count of answer sheets
Test 1
Test 2
Assigned Student Number
Word Count of each of the answer sheets
1 2 3 4 5 6 7 8 9 1011121314151617181920212223242526272829303132333435363738394041424344454647484950
0
1
2
3
4
5
6
Frequency distribution of number of errors
Test 1
Test 2
Assigned Student Number
Number of errors
1 2 3 4 5 6 7 8 9 1011121314151617181920212223242526272829303132333435363738394041424344454647484950
0
5
10
15
20
25
Frequency distribution of overall scores received by the
students
Test 1
Test 2
Assigned Student Number
Over all Scores Received by the Students
(Weissgerber et al., 2015)
Easy Moderate Hard
0
5
10
15
20
25
10
22
18
Frequency distribution of difficulty level of calculation
Difficulty levels of calculation
Frequency
Document Page
Results of the T-tests
Conjecture A was accepted as null rejected at 5% level of
significance.
Conjecture B was accepted as null rejected at 5% level of
significance.
Conjecture C was accepted as null rejected at 5% level of
significance.
Conjecture D was accepted as null rejected at 5% level of
tabler-icon-diamond-filled.svg

Paraphrase This Document

Need a fresh take? Get an instant paraphrase of this document with our AI Paraphraser
Document Page
D i s c u s s i o n
Document Page
Significant decrease in time taken to complete the tests when
calculator is used . This suggests more time for student to focus and
think about the problem.
Significant improvement in word count for answering when calculator
is used. This suggests that student could spend more time on the
theoretical and conceptual aspects of the problem.
Significant decrease in calculation errors when calculator is used . This
suggests that student could avail more precision in tackling
complicated computations.
Significant increase in test scores when calculator is used . This
suggests improved over all result for the student.
Use of calculator by students for “easy” problems is found to be less.
Document Page
Conclusion
Calculators can serve aid in the math learning
process by lessening the time spent on
monotonous calculations ,thus allowing students
and teachers to focus on the more real world
associations of mathematical theory and
developing problem solving skills.
Requirement based provision of calculators based
on difficulty level of the problem can effectively
tabler-icon-diamond-filled.svg

Secure Best Marks with AI Grader

Need help grading? Try our AI Grader for instant feedback on your assignments.
Document Page
Recommendation
Calculators should be allowed based upon the
difficulty level and nature of the problems
It should be introduced when the conceptual and
application based theories of math become relevant.
It could be used for complex problems with
complicated large calculations as a means of
validation of the answers so that student could focus
Document Page
References
Chen, J. C., & Lai, Y. L. (2016). A Brief Review of Researching the Graphing
Calculator Used for School Mathematics Classrooms. International Journal of
Learning, Teaching and Educational Research, 14(2).
Dion, G., Harvey, A., Jackson, C., Klag, P., Liu, J., & Wright, C. (2001). A survey of
calculator usage in high schools. School Science and Mathematics, 101(8), 427-
438.
Lloyd, B. H. (1991). Mathematics test performance: The effects of item type and
calculator use. Applied Measurement in Education, 4, 11-22.
Milou, E. (1999). The graphing calculator: A survey of classroom usage. School
Science and Mathematics, 99(3), 133-140.
Weissgerber, T. L., Milic, N. M., Winham, S. J., & Garovic, V. D. (2015). Beyond bar
and line graphs: time for a new data presentation paradigm. PLoS
Document Page
Appendix
t-Test: Two-Sample Assuming Unequal Variances for testing Conjecture
A
Test 1 Test 2
Mean 18.04 14.54
Variance 2.284082 3.110612
Observations 50 50
Hypothesized Mean Difference 0
DF 96
t Stat 10.6554
P(T<=t) one-tail 2.93E-18
t Critical one-tail 1.660881
P(T<=t) two-tail 5.85E-18
t Critical two-tail 1.984984
t-Test: Two-Sample Assuming Unequal Variances for testing Conjecture B
Test 1 Test 2
Mean 521.42 571.62
Variance 2313.269 2871.424
Observations 50 50
Hypothesized Mean Difference 0
DF 97
t Stat -4.92978
P(T<=t) one-tail 1.7E-06
t Critical one-tail 1.660715
P(T<=t) two-tail 3.4E-06
t Critical two-tail 1.984723
t-Test: Two-Sample Assuming Unequal Variances for testing Conjecture C
Test 1 Test 2
Mean 3.6 1.4
Variance 1.142857 1.061224
Observations 50 50
Hypothesized Mean Difference 0
DF 98
t Stat 10.47837
P(T<=t) one-tail 5.56E-18
t Critical one-tail 1.660551
P(T<=t) two-tail 1.11E-17
t Critical two-tail 1.984467
t-Test: Two-Sample Assuming Unequal Variances for testing Conjecture
D
Test 1 Test 2
Mean 15.4 17.28
Variance 3.469387755 2.777143
Observations 50 50
Hypothesized Mean Difference 0
DF 97
t Stat -5.318919471
P(T<=t) one-tail 3.34914E-07
t Critical one-tail 1.660714611
P(T<=t) two-tail 6.69827E-07
tabler-icon-diamond-filled.svg

Paraphrase This Document

Need a fresh take? Get an instant paraphrase of this document with our AI Paraphraser
Document Page
THANK YOU
chevron_up_icon
1 out of 20
circle_padding
hide_on_mobile
zoom_out_icon
logo.png

Your All-in-One AI-Powered Toolkit for Academic Success.

Available 24*7 on WhatsApp / Email

[object Object]