The Effect of Calculators in Math Class: A UTA Statistical Report

Verified

Added on  2023/06/15

|9
|1158
|150
Report
AI Summary
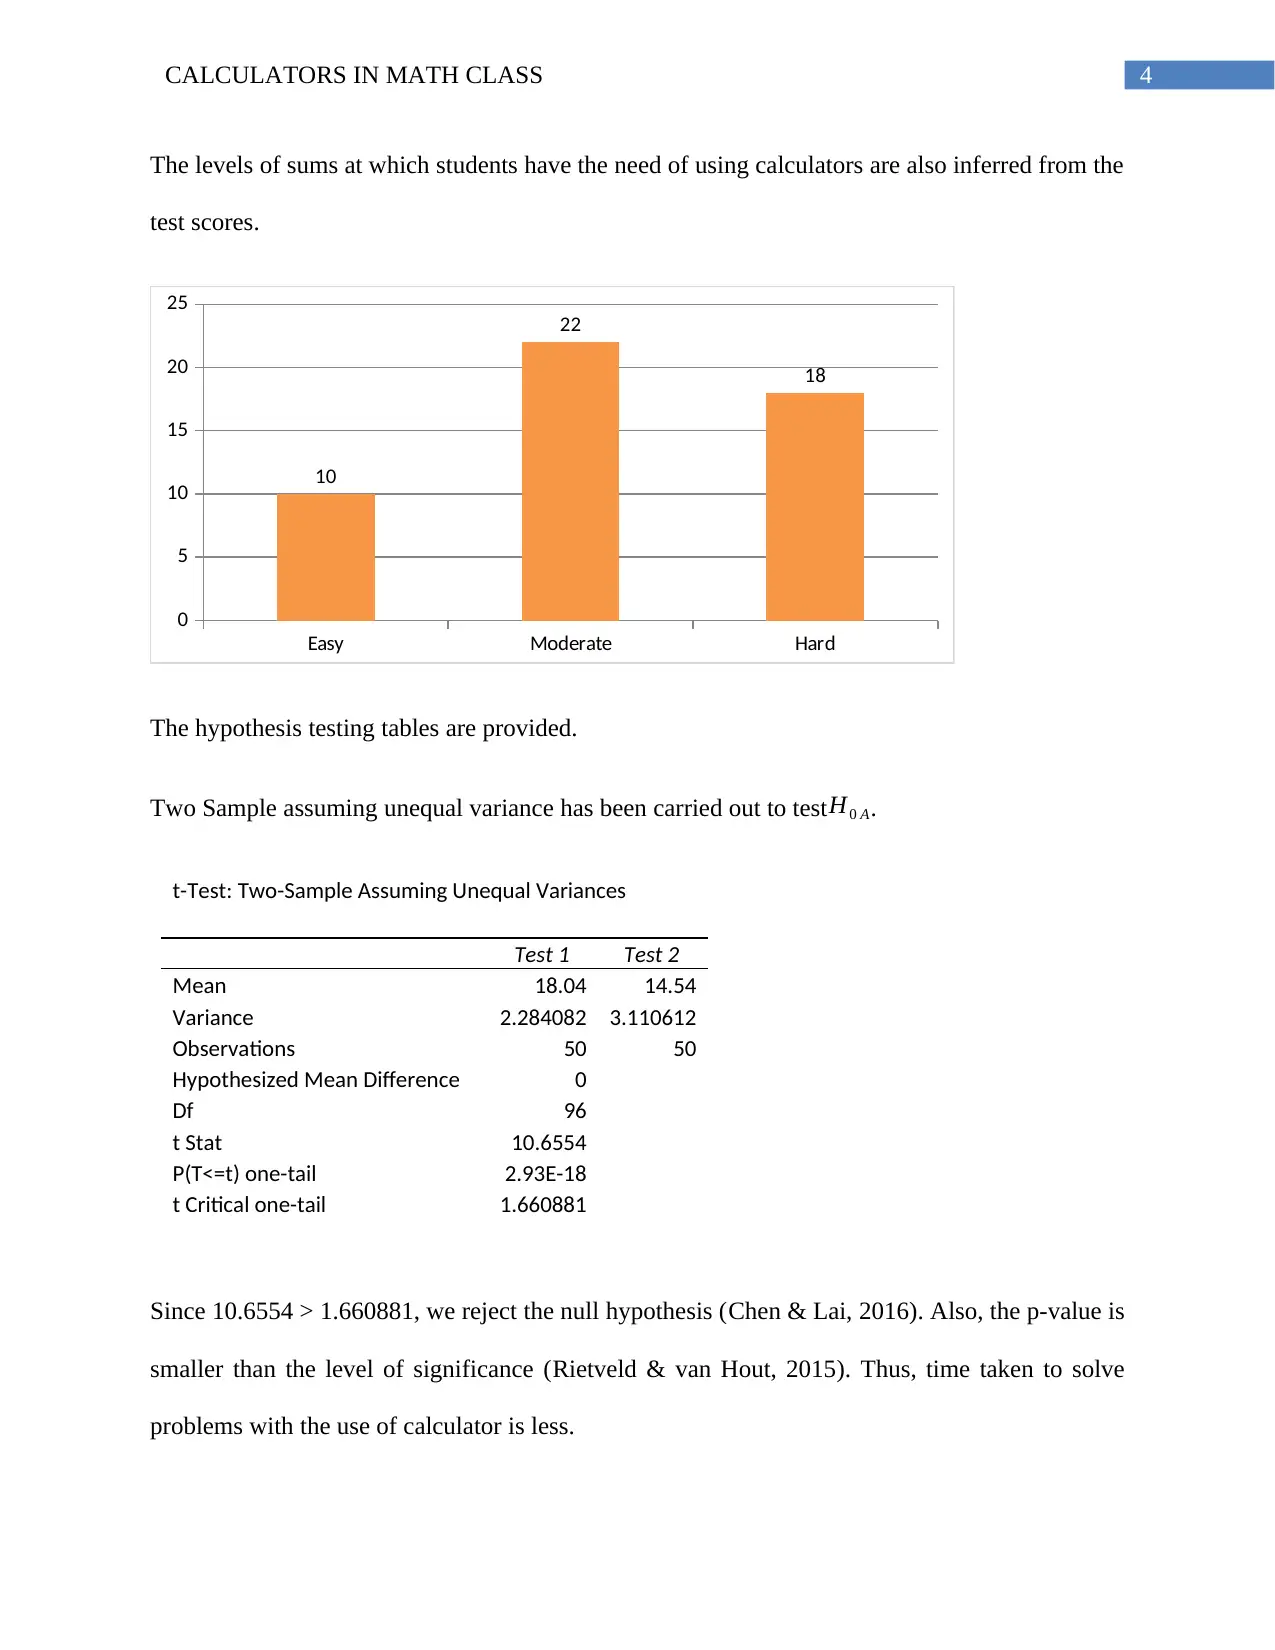
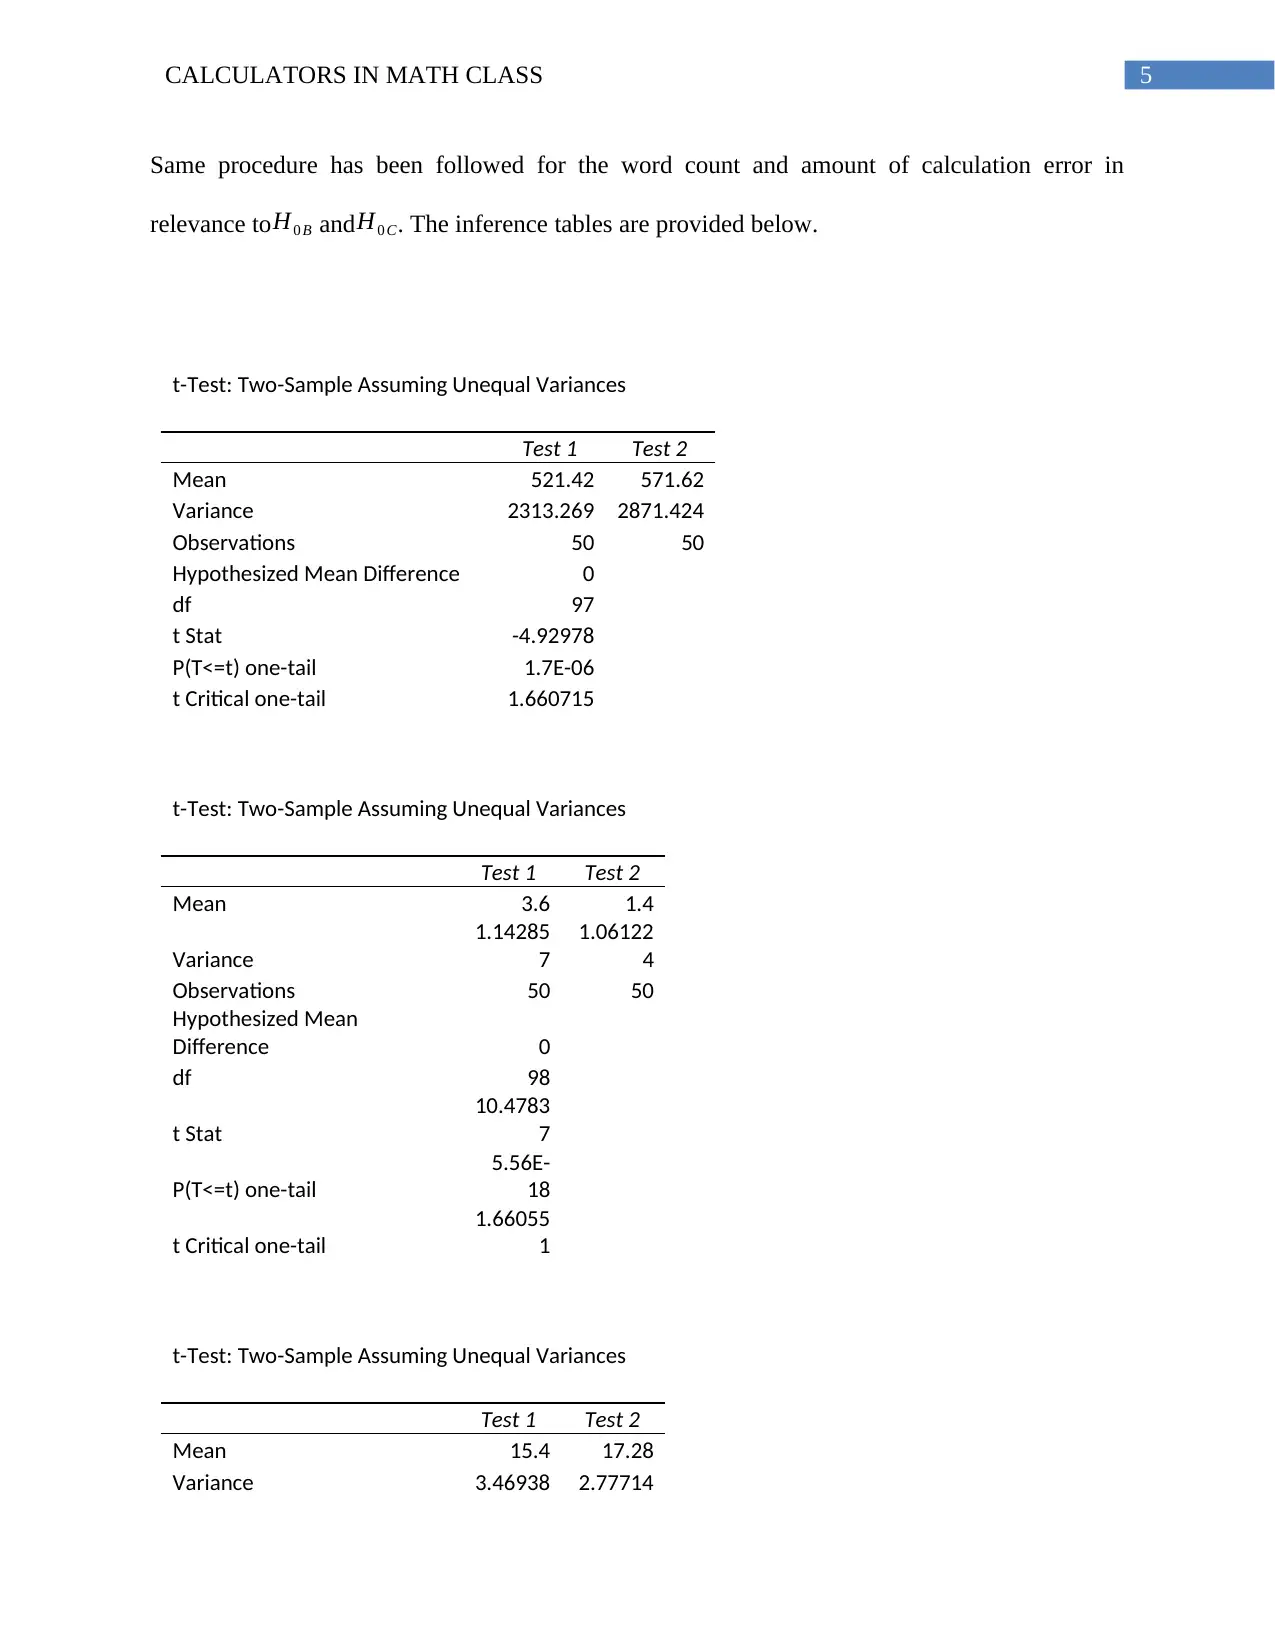
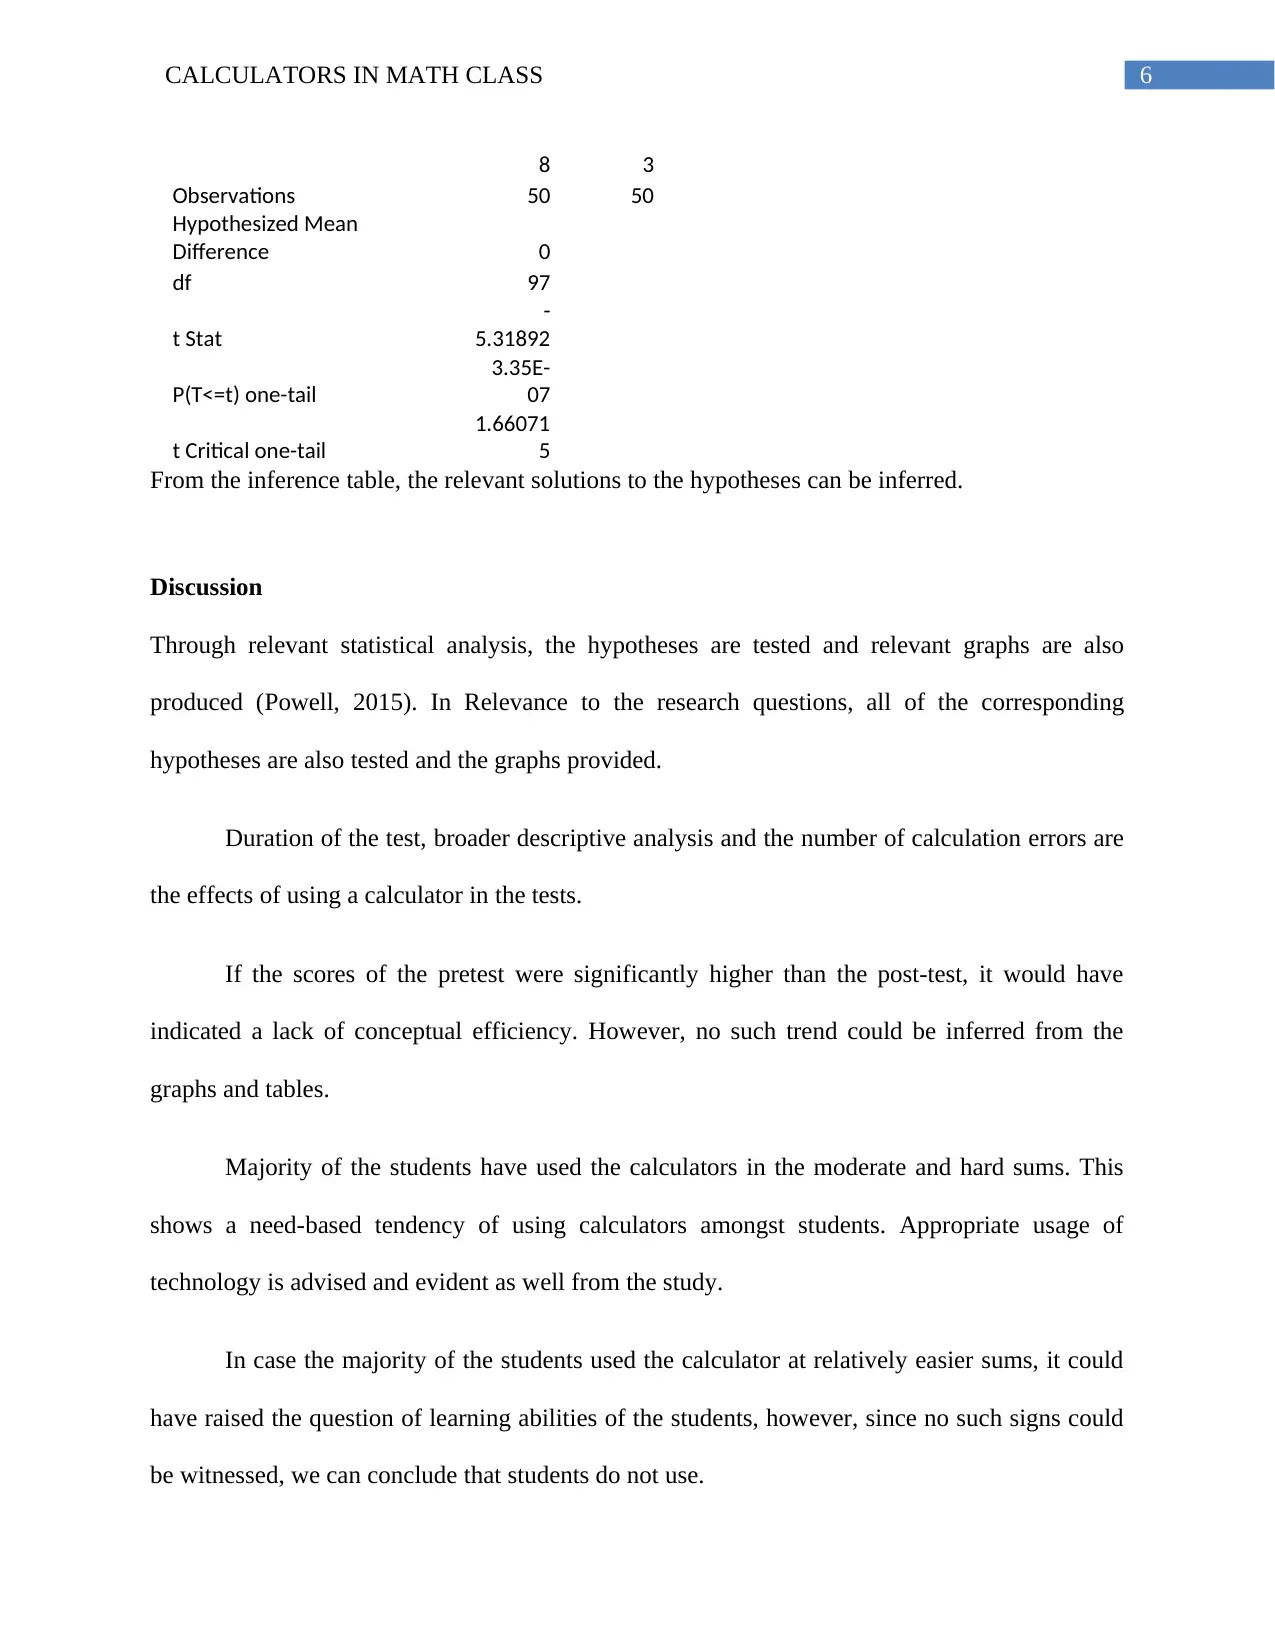
This report investigates the effects of calculator use in a math class setting, focusing on test duration, descriptive analysis, and calculation errors. The study involved students taking two tests, one with and one without calculators, and hypotheses were tested using statistical analysis, including t-tests assuming unequal variances. Results indicated that calculator use reduces the time taken to solve problems and the number of calculation errors, with students primarily using calculators for moderate to hard problems. The study concludes that appropriate technology usage is evident, as students do not rely on calculators for easier problems, suggesting a need-based approach to calculator use and no signs of hindering learning abilities. Desklib provides access to similar reports and study resources for students.
Document Page
Running head: CALCULATORS IN MATH CLASS
CALCULATORS IN MATH CLASS
Melissa Crosswhite
University of Texas of Arlington
2/4/2018
tabler-icon-diamond-filled.svg

Secure Best Marks with AI Grader

Need help grading? Try our AI Grader for instant feedback on your assignments.
Document Page
1CALCULATORS IN MATH CLASS
Table of Contents
Results..............................................................................................................................................2
Exploratory Data Analysis...............................................................................................................2
Discussion........................................................................................................................................6
References........................................................................................................................................7
Document Page
2CALCULATORS IN MATH CLASS
Results
Exploratory Data Analysis
In the first test taken, students would not be allowed to use a calculator. On the second
test, students will be allowed to do so. The following hypotheses are constructed in congruence
with the before mentioned research questions.
H0 A :The time taken¿ complete the test is more while u s ing a calculator .
H0 B : Amount of theoretical description isless while u s ing a calculator .
H0 C : Higher number of calculational errors are made while usingcalculator .
H0 D :The scores have not improved while u s ing a calculator .
The alternative hypotheses are presented below, as well.
H1 A :The timetaken ¿ complete thetest differentiates while u s inga calculator .
H1 B : Amount of theoretical description various while u s ing a calculator .
H1 C : Less calculational errors are made while usinga calculator .
H1 D : The scores have improved whileu s ing a calculator .
To understand the effects of using calculators while taking a test, the following graphs are
needed to be looked at initially (Weissgerber et al., 2015). It is to be noted that the full marks of
the tests are 20 minutes each.
Document Page
3CALCULATORS IN MATH CLASS
1
3
5
7
9
11
13
15
17
19
21
23
25
27
29
31
33
35
37
39
41
43
45
47
49
0
5
10
15
20
25
Test 1
Test 2
Student Number
Scores
1 3 5 7 91113151719212325272931333537394143454749
0
5
10
15
20
25
Test 1
Test 2
Student Number
Time taken to finish the tests
(min)
1
4
7
10
13
16
19
22
25
28
31
34
37
40
43
46
49
0
200
400
600
800
Test 1
Test 2
Student Number
Word Countof the
answer report
1
3
5
7
9
11
13
15
17
19
21
23
25
27
29
31
33
35
37
39
41
43
45
47
49
0
1
2
3
4
5
6
Test 1
Test 2
Student Number
Number of errors
tabler-icon-diamond-filled.svg

Secure Best Marks with AI Grader

Need help grading? Try our AI Grader for instant feedback on your assignments.
Document Page
4CALCULATORS IN MATH CLASS
The levels of sums at which students have the need of using calculators are also inferred from the
test scores.
Easy Moderate Hard
0
5
10
15
20
25
10
22
18
The hypothesis testing tables are provided.
Two Sample assuming unequal variance has been carried out to testH0 A.
t-Test: Two-Sample Assuming Unequal Variances
Test 1 Test 2
Mean 18.04 14.54
Variance 2.284082 3.110612
Observations 50 50
Hypothesized Mean Difference 0
Df 96
t Stat 10.6554
P(T<=t) one-tail 2.93E-18
t Critical one-tail 1.660881
Since 10.6554 > 1.660881, we reject the null hypothesis (Chen & Lai, 2016). Also, the p-value is
smaller than the level of significance (Rietveld & van Hout, 2015). Thus, time taken to solve
problems with the use of calculator is less.
Document Page
5CALCULATORS IN MATH CLASS
Same procedure has been followed for the word count and amount of calculation error in
relevance toH0 B andH0 C. The inference tables are provided below.
t-Test: Two-Sample Assuming Unequal Variances
Test 1 Test 2
Mean 521.42 571.62
Variance 2313.269 2871.424
Observations 50 50
Hypothesized Mean Difference 0
df 97
t Stat -4.92978
P(T<=t) one-tail 1.7E-06
t Critical one-tail 1.660715
t-Test: Two-Sample Assuming Unequal Variances
Test 1 Test 2
Mean 3.6 1.4
Variance
1.14285
7
1.06122
4
Observations 50 50
Hypothesized Mean
Difference 0
df 98
t Stat
10.4783
7
P(T<=t) one-tail
5.56E-
18
t Critical one-tail
1.66055
1
t-Test: Two-Sample Assuming Unequal Variances
Test 1 Test 2
Mean 15.4 17.28
Variance 3.46938 2.77714
Document Page
6CALCULATORS IN MATH CLASS
8 3
Observations 50 50
Hypothesized Mean
Difference 0
df 97
t Stat
-
5.31892
P(T<=t) one-tail
3.35E-
07
t Critical one-tail
1.66071
5
From the inference table, the relevant solutions to the hypotheses can be inferred.
Discussion
Through relevant statistical analysis, the hypotheses are tested and relevant graphs are also
produced (Powell, 2015). In Relevance to the research questions, all of the corresponding
hypotheses are also tested and the graphs provided.
Duration of the test, broader descriptive analysis and the number of calculation errors are
the effects of using a calculator in the tests.
If the scores of the pretest were significantly higher than the post-test, it would have
indicated a lack of conceptual efficiency. However, no such trend could be inferred from the
graphs and tables.
Majority of the students have used the calculators in the moderate and hard sums. This
shows a need-based tendency of using calculators amongst students. Appropriate usage of
technology is advised and evident as well from the study.
In case the majority of the students used the calculator at relatively easier sums, it could
have raised the question of learning abilities of the students, however, since no such signs could
be witnessed, we can conclude that students do not use.
tabler-icon-diamond-filled.svg

Paraphrase This Document

Need a fresh take? Get an instant paraphrase of this document with our AI Paraphraser
Document Page
7CALCULATORS IN MATH CLASS
Document Page
8CALCULATORS IN MATH CLASS
References
Weissgerber, T. L., Milic, N. M., Winham, S. J., & Garovic, V. D. (2015). Beyond bar and line
graphs: time for a new data presentation paradigm. PLoS biology, 13(4), e1002128.
Rietveld, T., & van Hout, R. (2015). The t test and beyond: Recommendations for testing the
central tendencies of two independent samples in research on speech, language and
hearing pathology. Journal of communication disorders, 58, 158-168.
Chen, J. C., & Lai, Y. L. (2016). A Brief Review of Researching the Graphing Calculator Used
for School Mathematics Classrooms. International Journal of Learning, Teaching and
Educational Research, 14(2).
Powell, J. (2015). Solve the Following Equation: The Role of the Graphing Calculator in the
Three Worlds of Mathematics. Interpreting Tall's Three Worlds of Mathematics, 52(2),
11.
chevron_up_icon
1 out of 9
circle_padding
hide_on_mobile
zoom_out_icon
[object Object]