Calculus Homework: Graph Analysis

Verified

Added on  2019/09/26

|18
|1398
|132
Homework Assignment
AI Summary
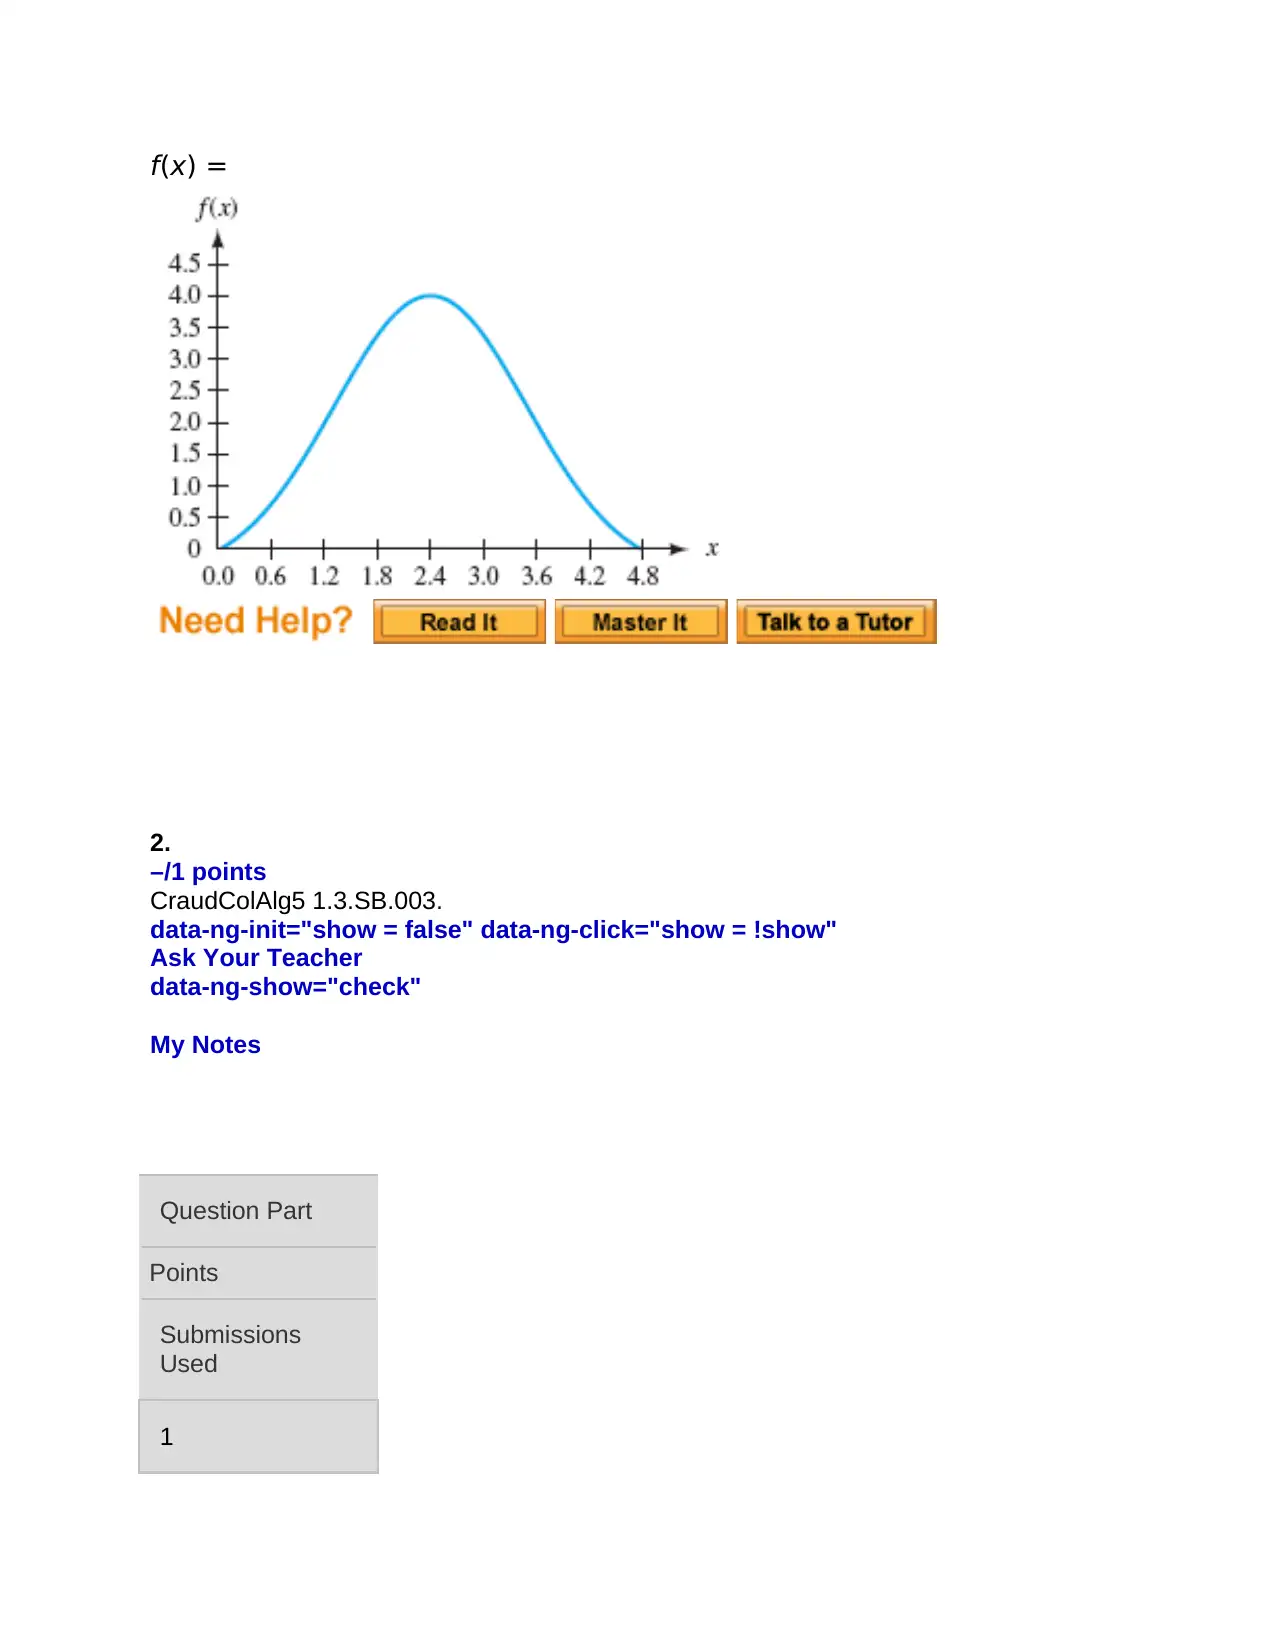
This homework assignment focuses on analyzing graphs of functions. Students are presented with several problems involving interpreting graphs, identifying concavity, points of inflection, and relating graphical features to real-world scenarios like population growth and inflation. The problems require students to determine values of functions from graphs, identify periods of increasing/decreasing concavity, estimate rates of change, and interpret the meaning of these features in context. The assignment includes multiple-choice questions and open-ended questions requiring graphical sketching and written explanations. The problems are drawn from a textbook, indicated by the 'CraudColAlg5' code, suggesting a college-level calculus course.
Document Page
1.
–/1 points
CraudColAlg5 1.3.SB.004.MI.
data-ng-init="show = false" data-ng-click="show = !show"
Ask Your Teacher
data-ng-show="check"
My Notes
Question Part
Points
Submissions
Used
1
–/1
0/3
Total
–/1
create list of
explanations
for conditional
explanations if
any
Converted from CraudColAlg4 1.3.SB.004.MI. Converted from
CraudColAlg3 1.3.SB.02.
The following is the graph of a function f = f(x). What is the smallest
value of x for which f(x) = 2.0?
tabler-icon-diamond-filled.svg

Paraphrase This Document

Need a fresh take? Get an instant paraphrase of this document with our AI Paraphraser
Document Page
f(x) =
2.
–/1 points
CraudColAlg5 1.3.SB.003.
data-ng-init="show = false" data-ng-click="show = !show"
Ask Your Teacher
data-ng-show="check"
My Notes
Question Part
Points
Submissions
Used
1
Document Page
–/1
0/3
Total
–/1
create list of
explanations
for conditional
explanations if
any
The following is the graph of a function
f = f(x).
What is the value of
f(4.2)?
f(4.2) =
Document Page
3.
–/1 points
CraudColAlg5 1.3.SB.025.
data-ng-init="show = false" data-ng-click="show = !show"
Ask Your Teacher
data-ng-show="check"
My Notes
Question Part
Points
Submissions
Used
1
–/1
0/3
Total
–/1
create list of
explanations
for conditional
explanations if
any
Converted from CraudColAlg4 1.3.SB.025. Converted from
CraudColAlg3 1.3.SB.08.
tabler-icon-diamond-filled.svg

Paraphrase This Document

Need a fresh take? Get an instant paraphrase of this document with our AI Paraphraser
Document Page
What is the mathematical term for points where concavity changes?
turning points
concave up
points of inflection
concave down
minima
maxima
4.
–/2 points
CraudColAlg5 1.3.EX.001.
data-ng-init="show = false" data-ng-click="show = !show"
Ask Your Teacher
data-ng-show="check"
My Notes
Converted from CraudColAlg4 1.3.EX.001. (a) Sketch a graph that is
always increasing but starts out concave up and then changes to
concave down. There should be a point of inflection in your picture.
Document Page
(b) Sketch a graph that is always decreasing but starts out concave
down and then changes to concave up. There should be a point of
inflection in your picture.
Document Page
tabler-icon-diamond-filled.svg

Paraphrase This Document

Need a fresh take? Get an instant paraphrase of this document with our AI Paraphraser
Document Page
5.
–/7 points
CraudColAlg5 1.3.EX.009.MI.
data-ng-init="show = false" data-ng-click="show = !show"
Ask Your Teacher
data-ng-show="check"
My Notes
Converted from CraudColAlg4 1.3.EX.005.MI. Converted from
CraudColAlg3 1.3.EX.05. The graph in the figure below shows the mean
flow F for the Arkansas River, in cubic feet of water per second, as a
function of the time t, in months, since the start of the year. The flow is
measured near the river's headwaters in the Rocky Mountains.
Document Page
(a) Use functional notation to express the flow at the end of May.
F
Estimate the value of the above term.
ft3
sec
(b) When is the flow at its greatest?
April
May
June
July
August
October
(c) At what time is the flow increasing the fastest?
April
May
June
July
August
Document Page
October
(d) Estimate the average rate of change per month in the flow during
the first 4 months of the year.
ft3/sec per month
(e) In light of the source of the Arkansas River, interpret your answers
to parts (b), (c), and (d).
Because the flow is measured near the river's headwaters in the Rocky
Mountains, we expect any change in flow to come from melting snow
primarily. This is consistent with the change in flow during the first four
months of the year (as seen in part (d)), a
---Select---
maximum increase
maximum decrease
minimum increase
minimum decrease in flow near the end of May (as seen in part (c)), and a
---Select---
base flow
peak flow one month later (as seen in part (b)).
6.
–/13 points
CraudColAlg5 1.3.EX.010.
data-ng-init="show = false" data-ng-click="show = !show"
Ask Your Teacher
data-ng-show="check"
My Notes
Question Part
Points
tabler-icon-diamond-filled.svg

Paraphrase This Document

Need a fresh take? Get an instant paraphrase of this document with our AI Paraphraser
Document Page
Submissions Used
1 2 3 4 5 6 7 8 9 1
0
1
1
1
2
1
3
–/1 –/1 –/1 –/1 –/1 –/1 –/1 –/1 –/1 –/1 –/1 –/1 –/1
0
/
3
0
/
3
0
/
3
0
/
3
0
/
3
0
/
3
0
/
3
0
/
3
0
/
3
0
/
3
0
/
3
0
/
3
0
/
3
Total
–/13
create list of explanations for conditional
explanations if any
Converted from CraudColAlg4 1.3.EX.006. Converted from
CraudColAlg3 1.3.EX.06.
The graph in the following figure shows the population N = N(d), in
thousands of animals, of a particular species on a protected reserve as
a function of the date d. Ecologists refer to growth of the type shown
here as logistic population growth.
(a) Explain in general terms how the population N changes with time.
This answer has not been graded yet.
Document Page
(b) When did the population reach 120 thousand?
(c) Your answer in part (b) is the solution of an equation involving N(d).
Which equation?
N(d) = individuals
(d) During which period is the graph concave up?
< d <
Explain what this means about population growth during this period.
This answer has not been graded yet.
(e) During which period is the graph concave down?
< d <
Explain what this means about population growth during this period.
This answer has not been graded yet.
(f) When does a point of inflection occur on the graph?
d =
Explain how this point may be interpreted in terms of the growth rate.
This answer has not been graded yet.
(g) What is the environmental carrying capacity of this reserve for this
species of animal? That is, what is the maximum number of individuals
that the environment can support?
animals
(h) Make a new graph of N(d) under the following new scenario. The
population grew as in the figure above until 1990, when a natural
disaster caused half of the population to die. After that the population
resumed logistic growth.
chevron_up_icon
1 out of 18
circle_padding
hide_on_mobile
zoom_out_icon
[object Object]