Statistical Analysis of Call Center Data: A Business Statistics Report

Verified

Added on  2022/08/20

|19
|2033
|13
Report
AI Summary
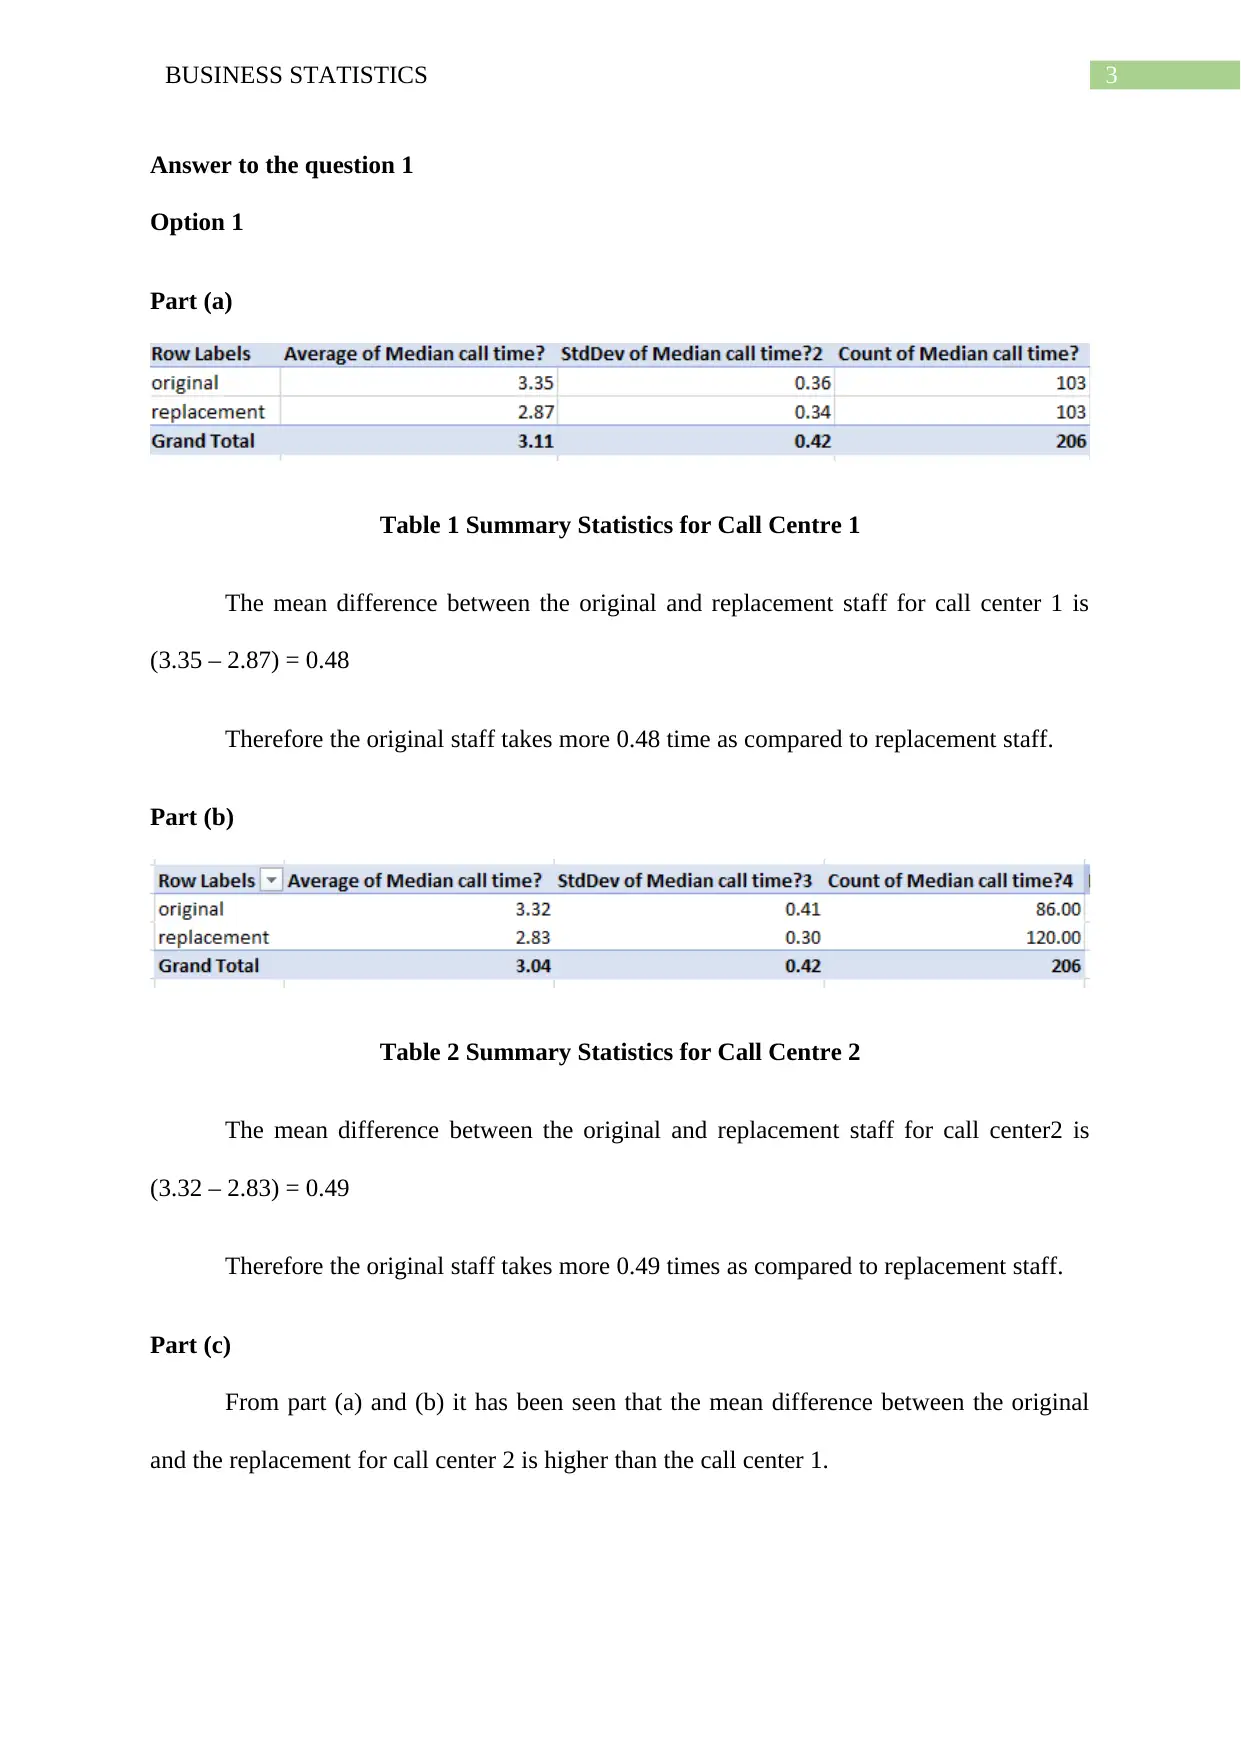
This report presents a statistical analysis of call center performance, examining data from two call centers. The analysis investigates the relationship between original and replacement staff, median call times, and customer complaints. The report utilizes descriptive and inferential statistics, including mean differences, confidence intervals, and hypothesis testing, to draw conclusions about staff efficiency and customer satisfaction. The findings suggest differences in performance between original and replacement staff, and correlations between call times and complaint numbers. The report also compares performance metrics across the two call centers, offering a comparative analysis of operational efficiency. The study uses both descriptive and inferential statistics to analyze the data and draw conclusions. The report also includes tables and figures to support the analysis and findings. The report provides a comprehensive assessment of the call center operations based on the provided dataset.
Document Page
Running head: BUSINESS STATISTICS
Business Statistics
Name of the Student:
Name of the University:
Author Note:
tabler-icon-diamond-filled.svg

Paraphrase This Document

Need a fresh take? Get an instant paraphrase of this document with our AI Paraphraser
Document Page
1BUSINESS STATISTICS
Table of Contents
Answer to the question 1............................................................................................................3
Part (a)....................................................................................................................................3
Part (b)....................................................................................................................................3
Part (c)....................................................................................................................................3
Answer to the question 2............................................................................................................4
Part (a)....................................................................................................................................4
Part (b)....................................................................................................................................4
Part (c)....................................................................................................................................4
Answer to the question 3............................................................................................................5
Part (a)....................................................................................................................................5
Part (b)....................................................................................................................................7
Part (c)....................................................................................................................................8
Answer to the question 4............................................................................................................9
Part (a)....................................................................................................................................9
Answer to the question 5..........................................................................................................10
Part (a)..................................................................................................................................10
Part (b)..................................................................................................................................10
Answer to the question 6..........................................................................................................11
Part (a)..................................................................................................................................11
Part (b)..................................................................................................................................12
Document Page
2BUSINESS STATISTICS
Part (c)..................................................................................................................................12
Answer to the question 7..........................................................................................................13
Part (a)..................................................................................................................................13
Part (b)..................................................................................................................................14
Part (c)..................................................................................................................................14
Answer to the question 8..........................................................................................................15
Part (a)......................................................................................................................................15
Part (b)..................................................................................................................................16
Part (c)..................................................................................................................................16
Answer to the question 9..........................................................................................................17
Bibliography.............................................................................................................................18
Document Page
3BUSINESS STATISTICS
Answer to the question 1
Option 1
Part (a)
Table 1 Summary Statistics for Call Centre 1
The mean difference between the original and replacement staff for call center 1 is
(3.35 – 2.87) = 0.48
Therefore the original staff takes more 0.48 time as compared to replacement staff.
Part (b)
Table 2 Summary Statistics for Call Centre 2
The mean difference between the original and replacement staff for call center2 is
(3.32 – 2.83) = 0.49
Therefore the original staff takes more 0.49 times as compared to replacement staff.
Part (c)
From part (a) and (b) it has been seen that the mean difference between the original
and the replacement for call center 2 is higher than the call center 1.
tabler-icon-diamond-filled.svg

Paraphrase This Document

Need a fresh take? Get an instant paraphrase of this document with our AI Paraphraser
Document Page
4BUSINESS STATISTICS
Answer to the question 2
Part (a)
Table 3 Summary Statistics for Call Centre 1
The mean difference between the original and replacement staff, whose median call
time above 3 minutes and for call center 1 is (3.47 – 3.24) = 0.23
Therefore the original staff takes more 0.23 times as compared to the replacement
staff on median call time above 3 minutes.
Part (b)
Table 4 Summary Statistics for Call Centre 2
The mean difference between the original and replacement staff, whose median call
time above 3 minutes and for call center 2 is (3.52 – 3.18) = 0.34
Therefore the original staff takes more 0.34 times as compared to the replacement
staff on median call time above 3 minutes.
Part (c)
From part (a) and (b) it has been seen that the mean difference between the original
and replacement staff, whose median call time above 3 minutes and for call center 2 is higher
than the call center 1.
Document Page
5BUSINESS STATISTICS
Answer to the question 3
Part (a)
Table 5 Summary Output for Call center 1
1 10 19 28 37 46 55 64 73 82 91 100109 118127 136145 154163 172181 190199
0
0.5
1
1.5
2
2.5
3
3.5
4
4.5
Median call time
Figure 1 Median call time for call center 1
Document Page
6BUSINESS STATISTICS
1 10 19 28 37 46 55 64 73 82 91 100 109 118 127 136 145 154 163 172 181 190 199
0
5
10
15
20
25
30
35
40
45
Number of complaints
Figure 2 Number of Complaints about call center 1
Null hypothesis (H0): There is no difference between the median call time and the number of
complaints about call center 1.
Alternative hypothesis (H1): There is a difference between the median call time and the
number of complaints about call center 1.
P-Value = 0.000
Alpha = 0.05
It has been that the P-value is less than alpha. Therefore there is a differences
difference between the median call time and the number of complaints on call center 1.
tabler-icon-diamond-filled.svg

Paraphrase This Document

Need a fresh take? Get an instant paraphrase of this document with our AI Paraphraser
Document Page
7BUSINESS STATISTICS
Part (b)
Table 6 Summary Output for Call center 2
1 10 19 28 37 46 55 64 73 82 91 100109 118127 136145 154163 172181 190199
0
0.5
1
1.5
2
2.5
3
3.5
4
4.5
Median call time
Figure 3 Median call time for call center 2
Document Page
8BUSINESS STATISTICS
1 10 19 28 37 46 55 64 73 82 91 100 109 118 127 136 145 154 163 172 181 190 199
0
5
10
15
20
25
30
35
40
45
Number of complaints
Figure 2 Number of Complaints about call center 2
Null hypothesis (H0): There is no difference between the median call time and the
number of complaints about call center 2.
Alternative hypothesis (H1): There is a difference between the median call time and
the number of complaints about call center 2.
P-Value = 0.000
Alpha = 0.05 (at 5% level)
The P-value is less than alpha. Therefore there is a differences difference between the
median call time and the number of complaints on call center 2.
Part (c)
From part (a) and (b) it is clear that both the call center 1 and 2 shows that there is a
difference between the median call time and the number of complaints.
Document Page
9BUSINESS STATISTICS
Answer to the question 4
Part (a)
For call center 1
The original staff sample size =103.
The original staff sample =3.35.
Given that the population mean = 3
Population standard deviation = 1.1
Z score = (sample mean – Population mean)/ population standard deviation
= (3.35-3)/1.1
= 0.32
For call center 1
The replacement staff sample size =103.
The replacement staff sample mean =2.87.
Given that the population mean = 3
Population standard deviation = 1.1
Z score = (sample mean – Population mean)/ population standard deviation
= (2.87-3)/1.1
= -0.12
Mod (Z) = 0.12
tabler-icon-diamond-filled.svg

Paraphrase This Document

Need a fresh take? Get an instant paraphrase of this document with our AI Paraphraser
Document Page
10BUSINESS STATISTICS
Answer to the question 5
Part (a)
For call center 1
The original staff sample size = 103
The number of workers which have median call more than 3 minutes is 83
Therefore the proportion of workers which have median call more than 3 minutes (p)
= 83/ 103
= 0.81
The 95% confidence interval for the population proportion is as below
P ± 1.96 * p(1 p)
n
= 0.81± 1.96 * 0.81(1081)
104
= (0.73, 0.88)
Part (b)
For call center 1
The replacement staff sample size = 103
The number of workers which have median call more than 3 minutes is 38
Therefore the proportion of workers which have median call more than 3 minutes (p)
= 38/ 103
= 0.37
Document Page
11BUSINESS STATISTICS
The 95% confidence interval for the population proportion is as below
P ± 1.96 * p(1 p)
n
= 0.37± 1.96 * 0.37(10.37)
104
= (0.28, 0.46)
Answer to the question 6
Part (a)
Table 7 Summary Output for call center 1
Null hypothesis (H0): There is no relationship between the original staff, replacement
staff, and median call time.
Alternative hypothesis (H1): There is a relationship between the original staff,
replacement staff and median call time.
P-value = 0.00
Alpha = 0.05 ( at 5% level)
chevron_up_icon
1 out of 19
circle_padding
hide_on_mobile
zoom_out_icon
[object Object]