Business Statistics: Call Center Staff Performance Analysis

Verified

Added on  2022/08/26

|19
|2245
|24
Report
AI Summary
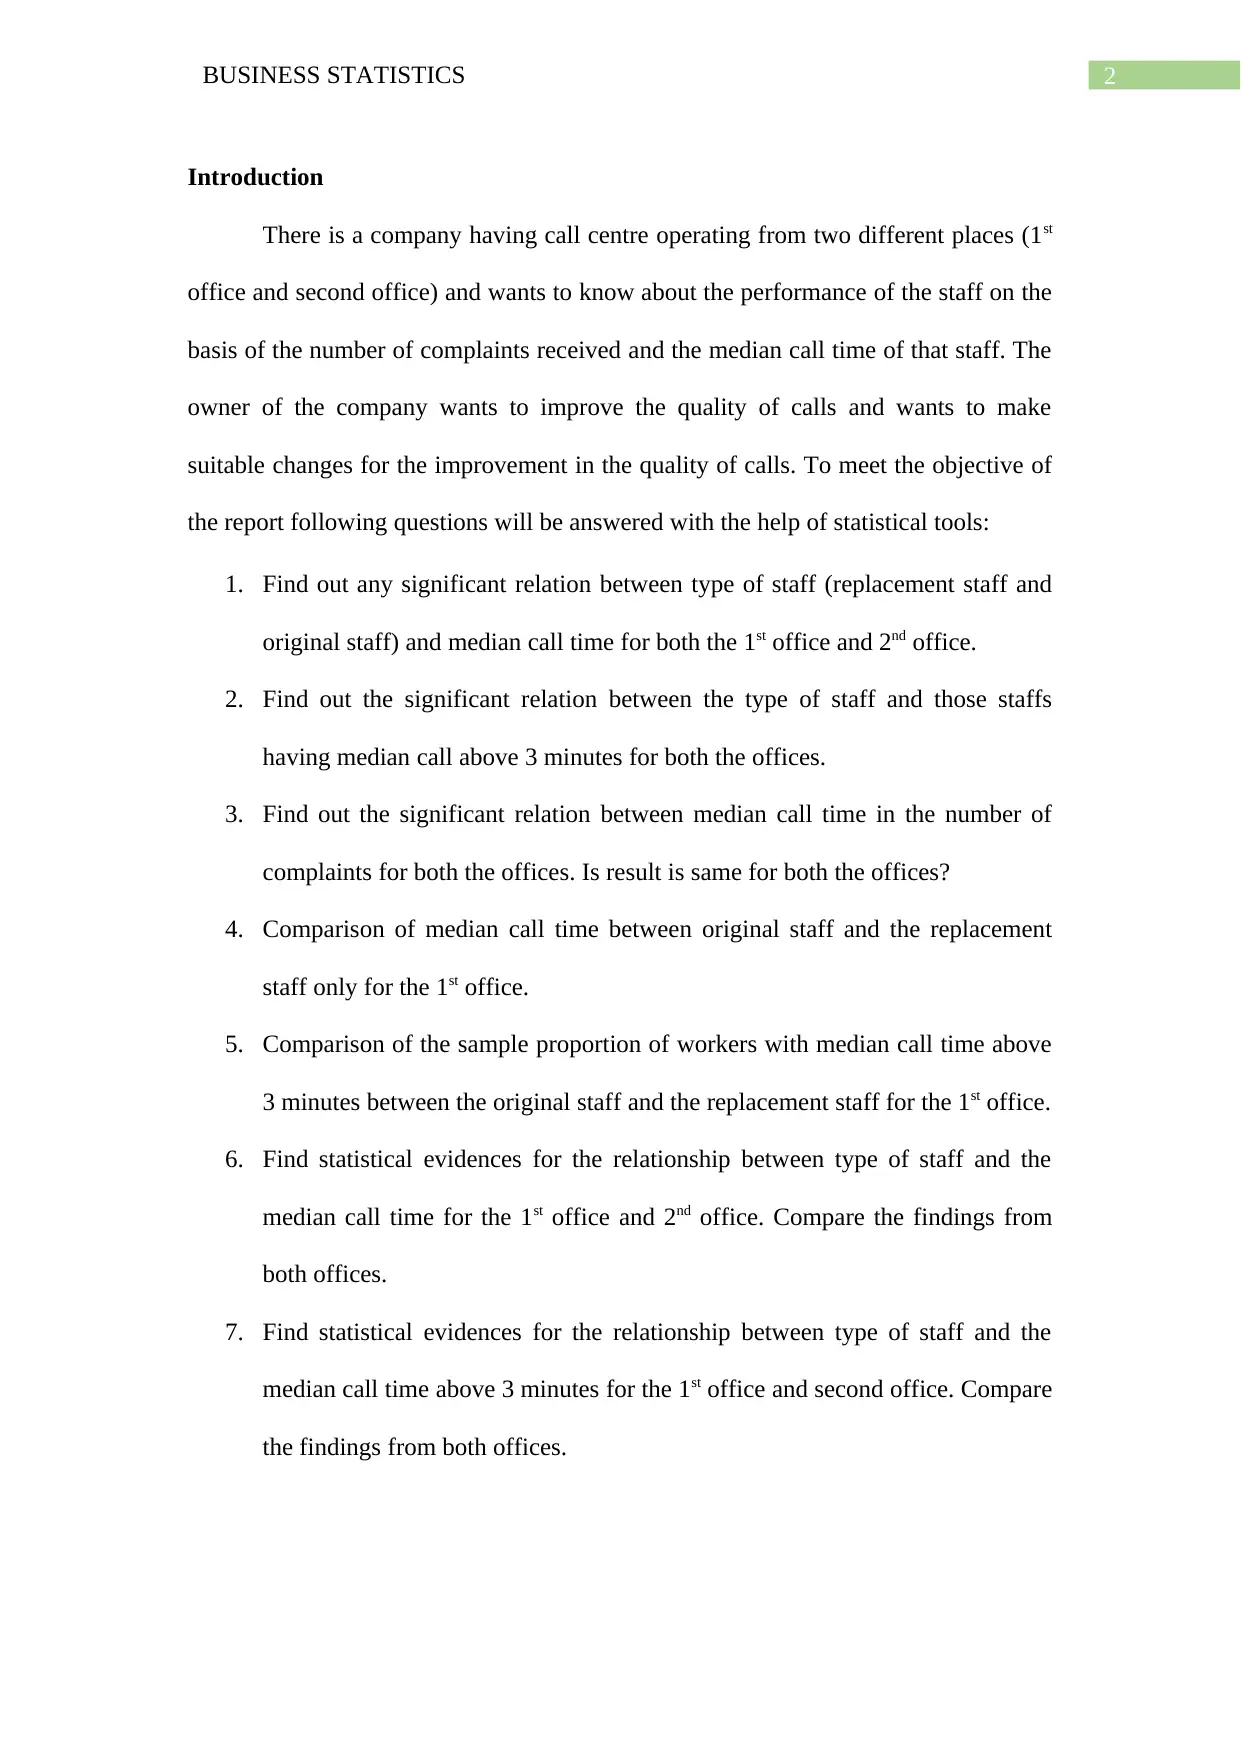
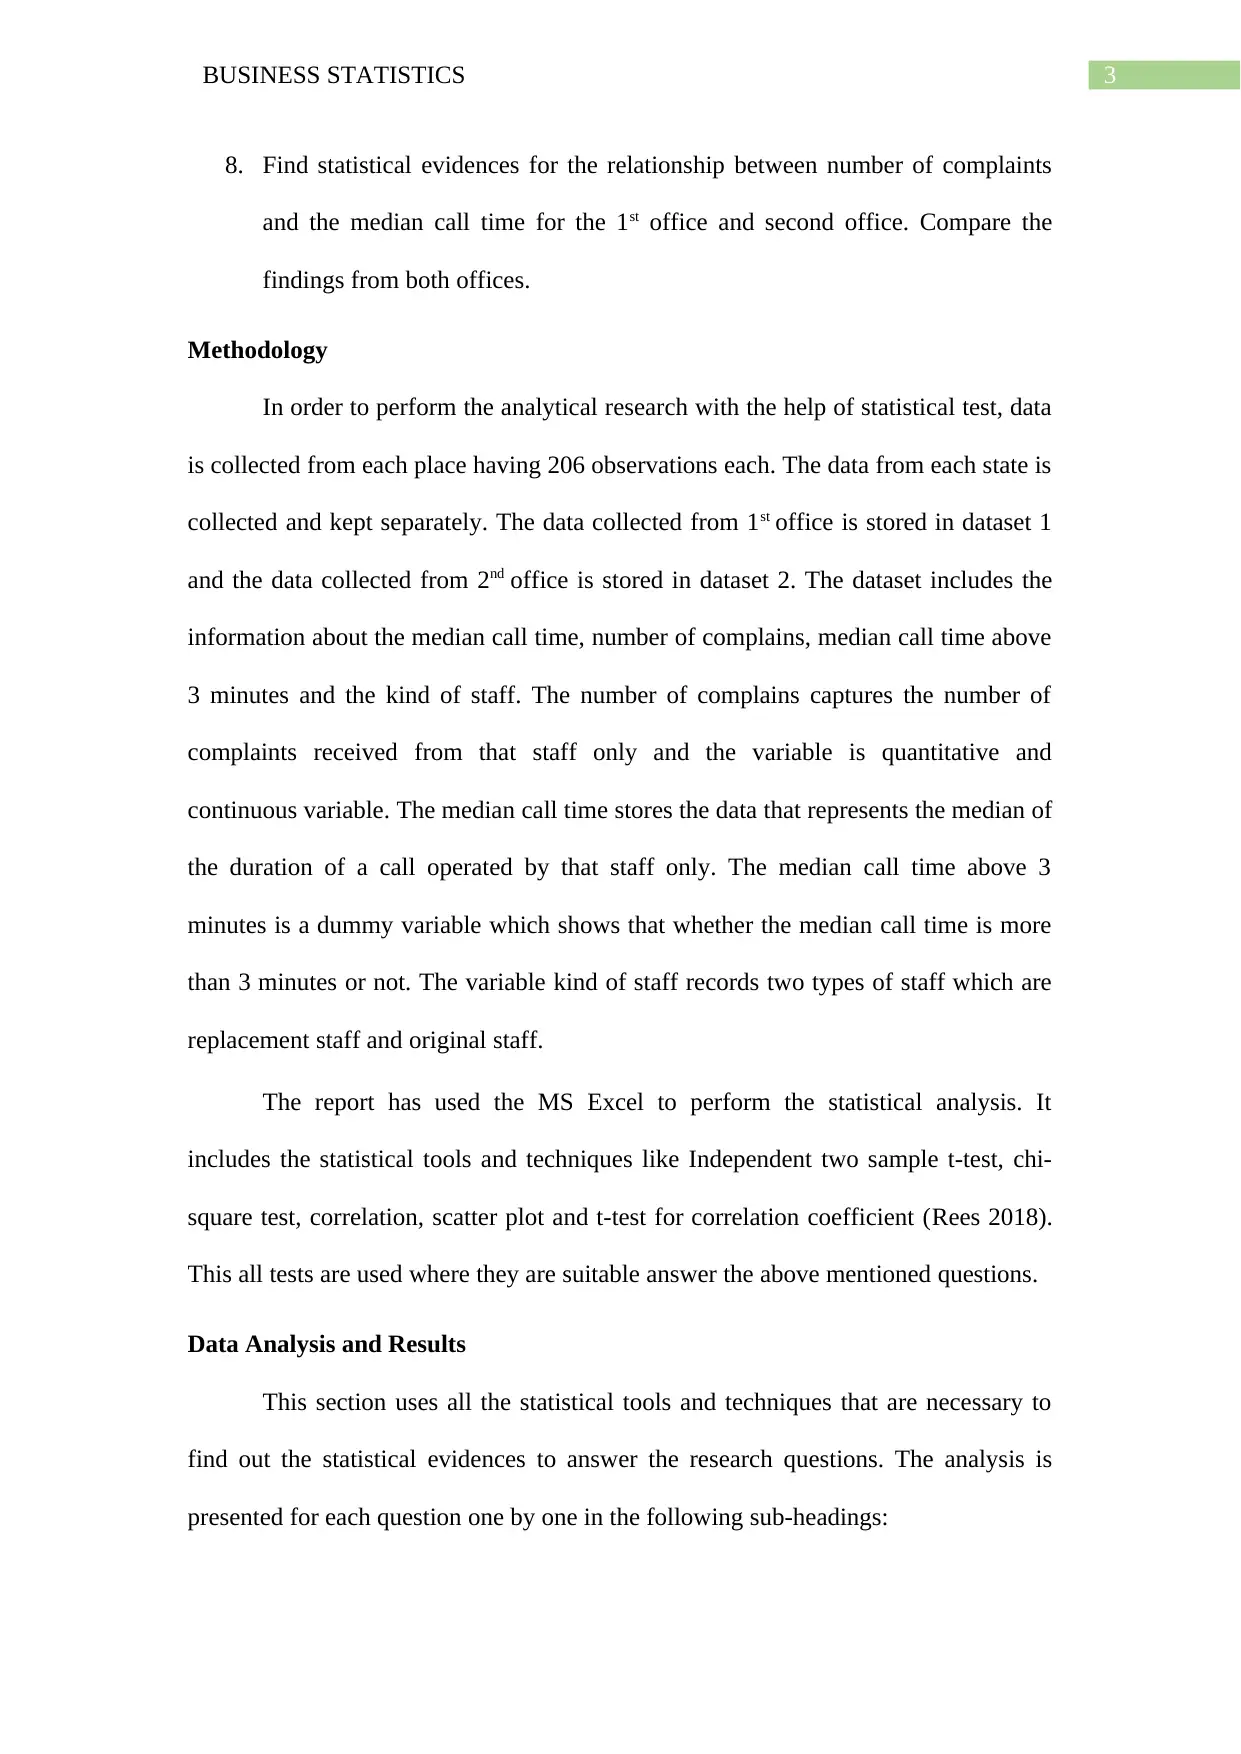
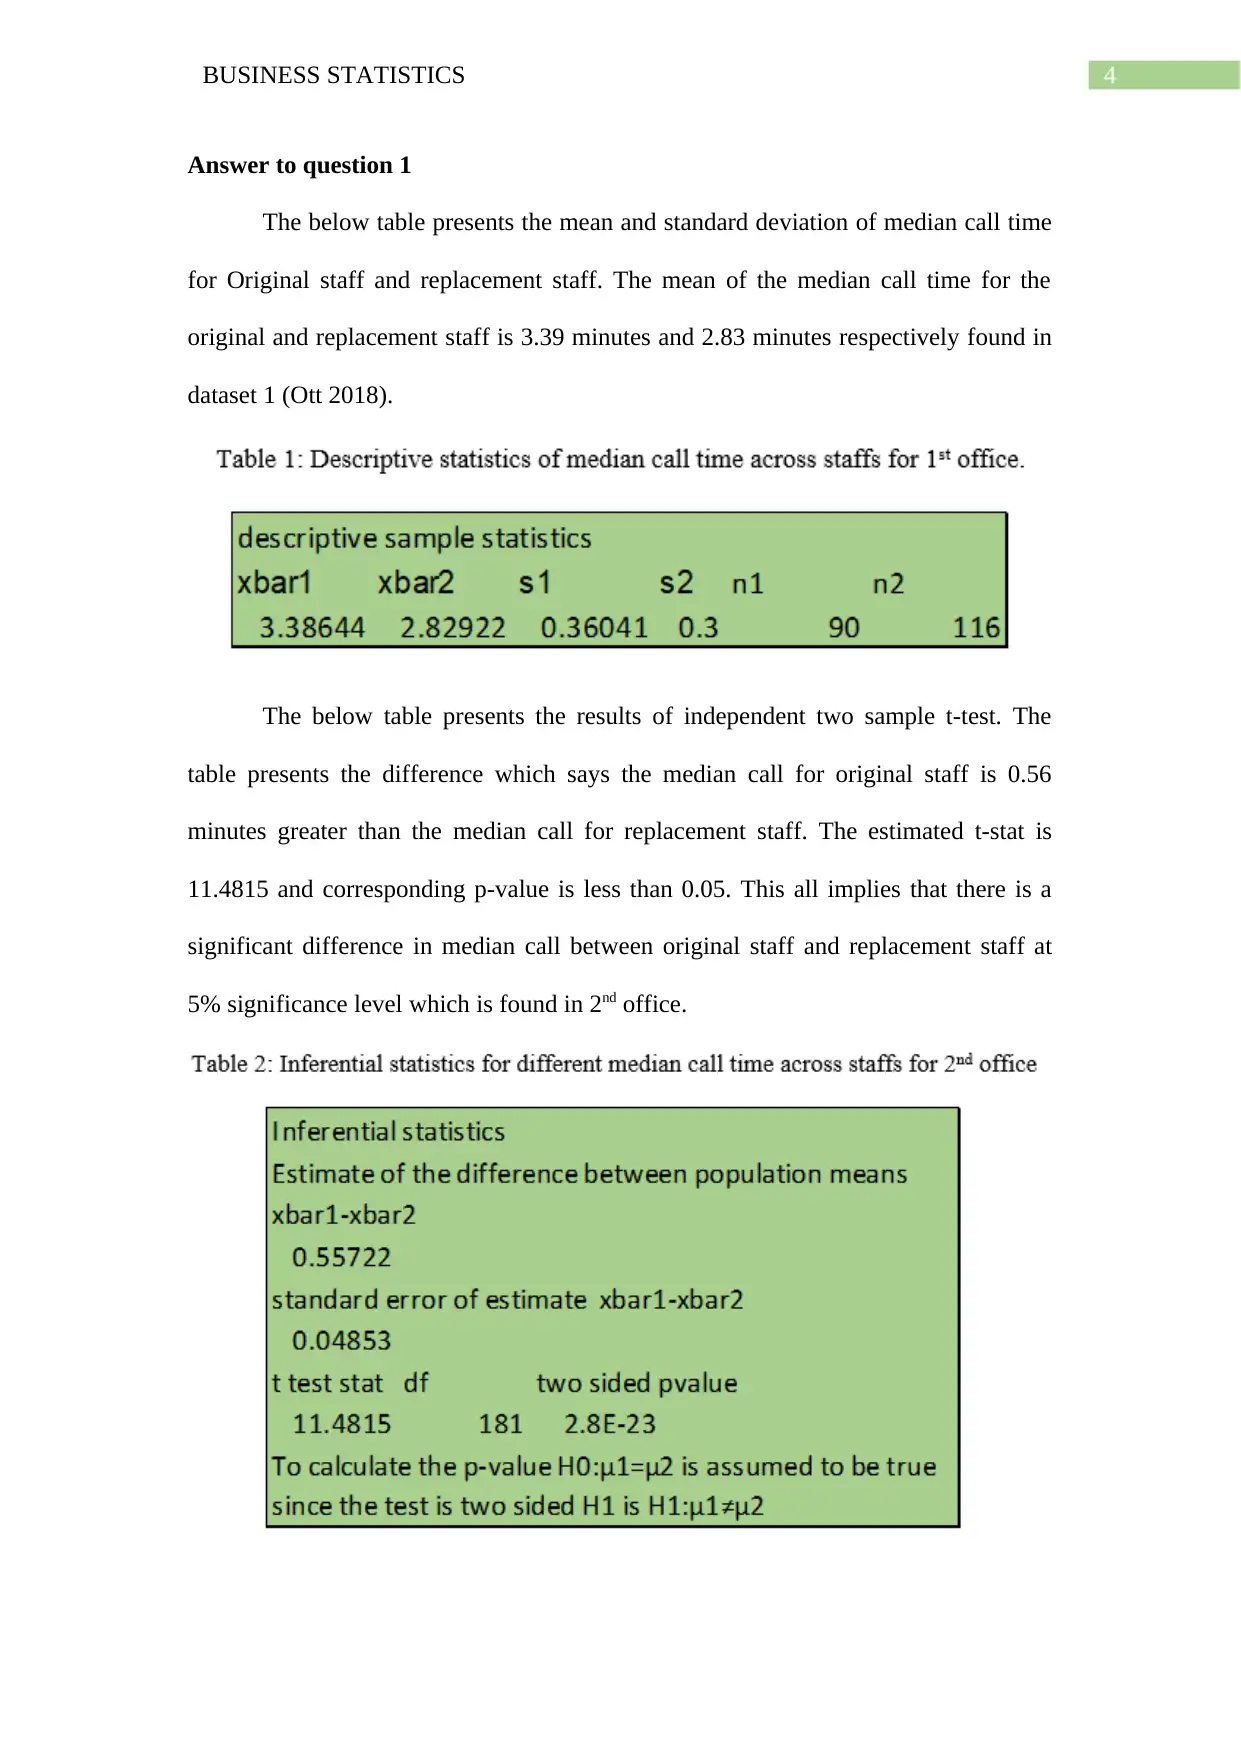
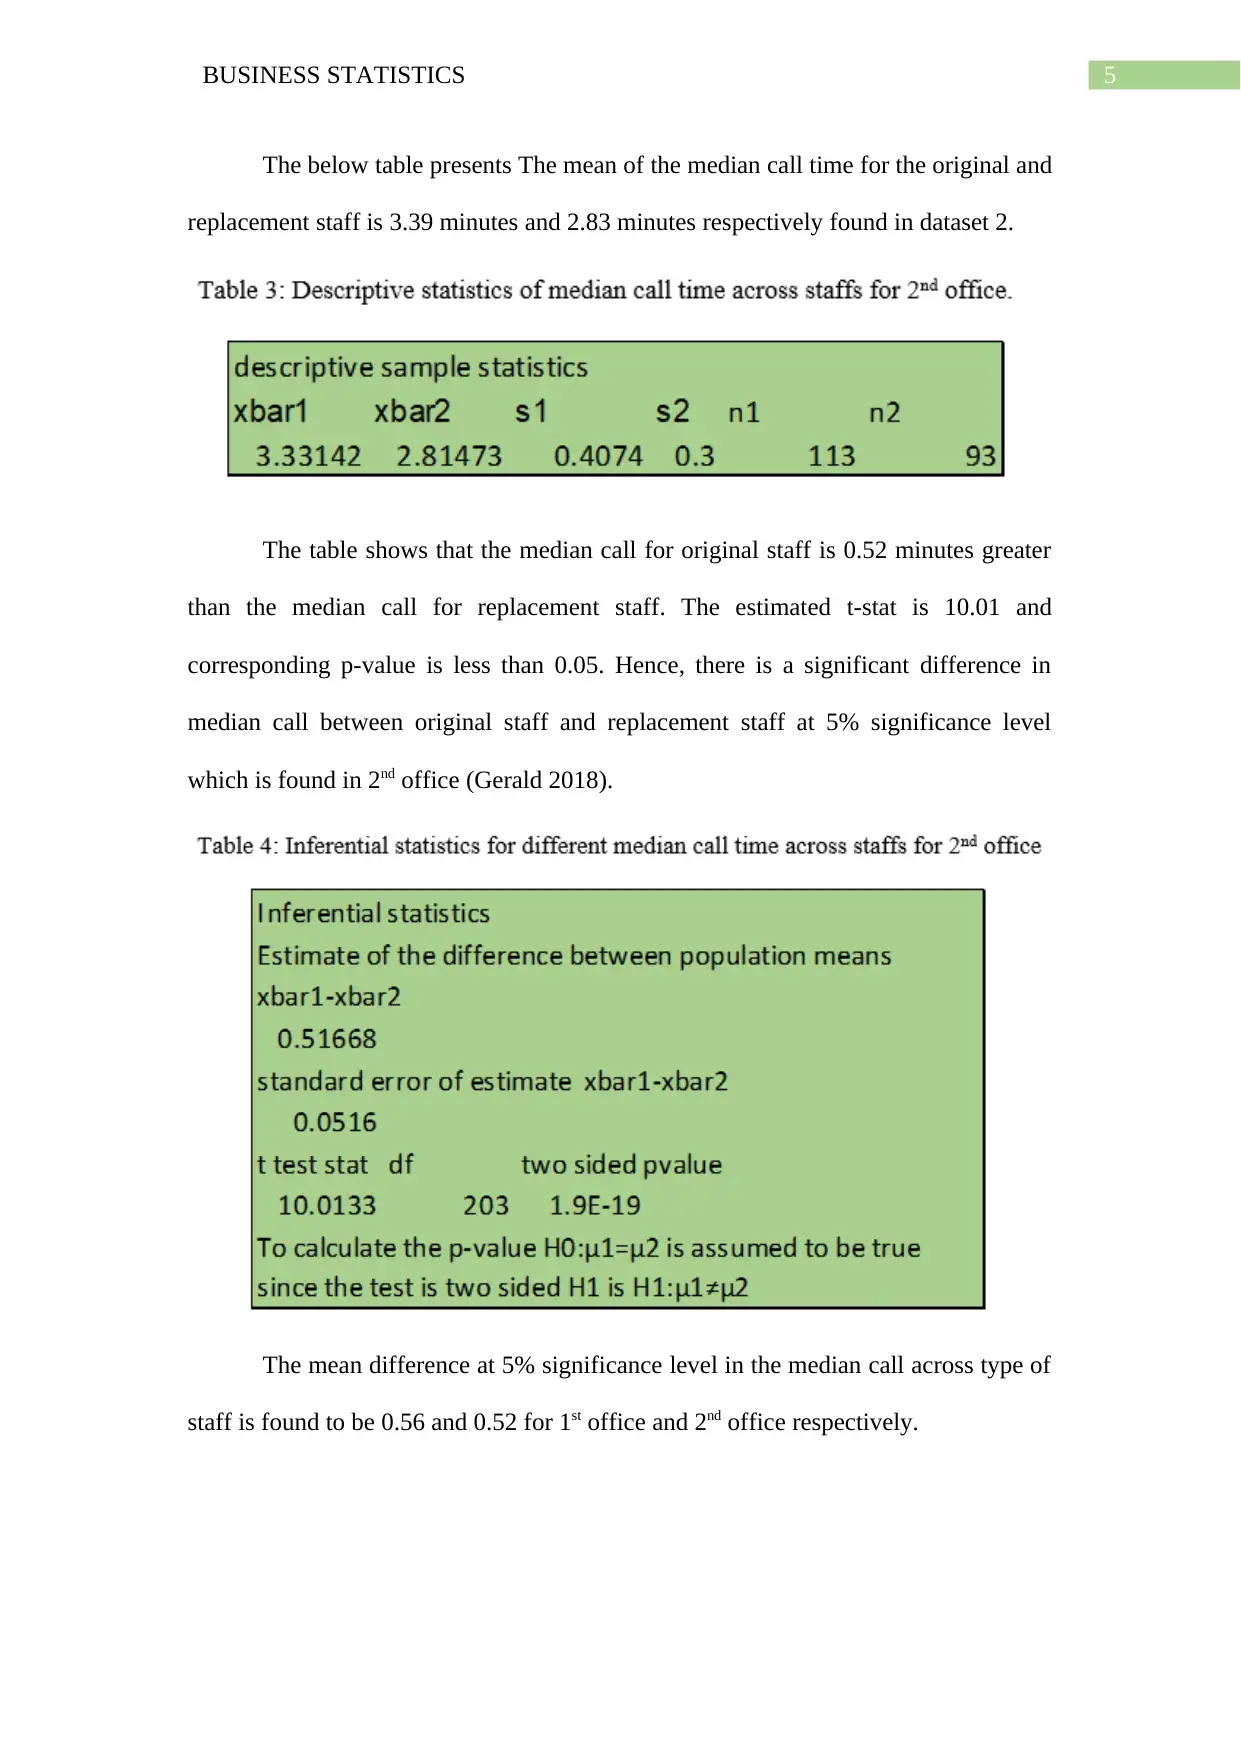
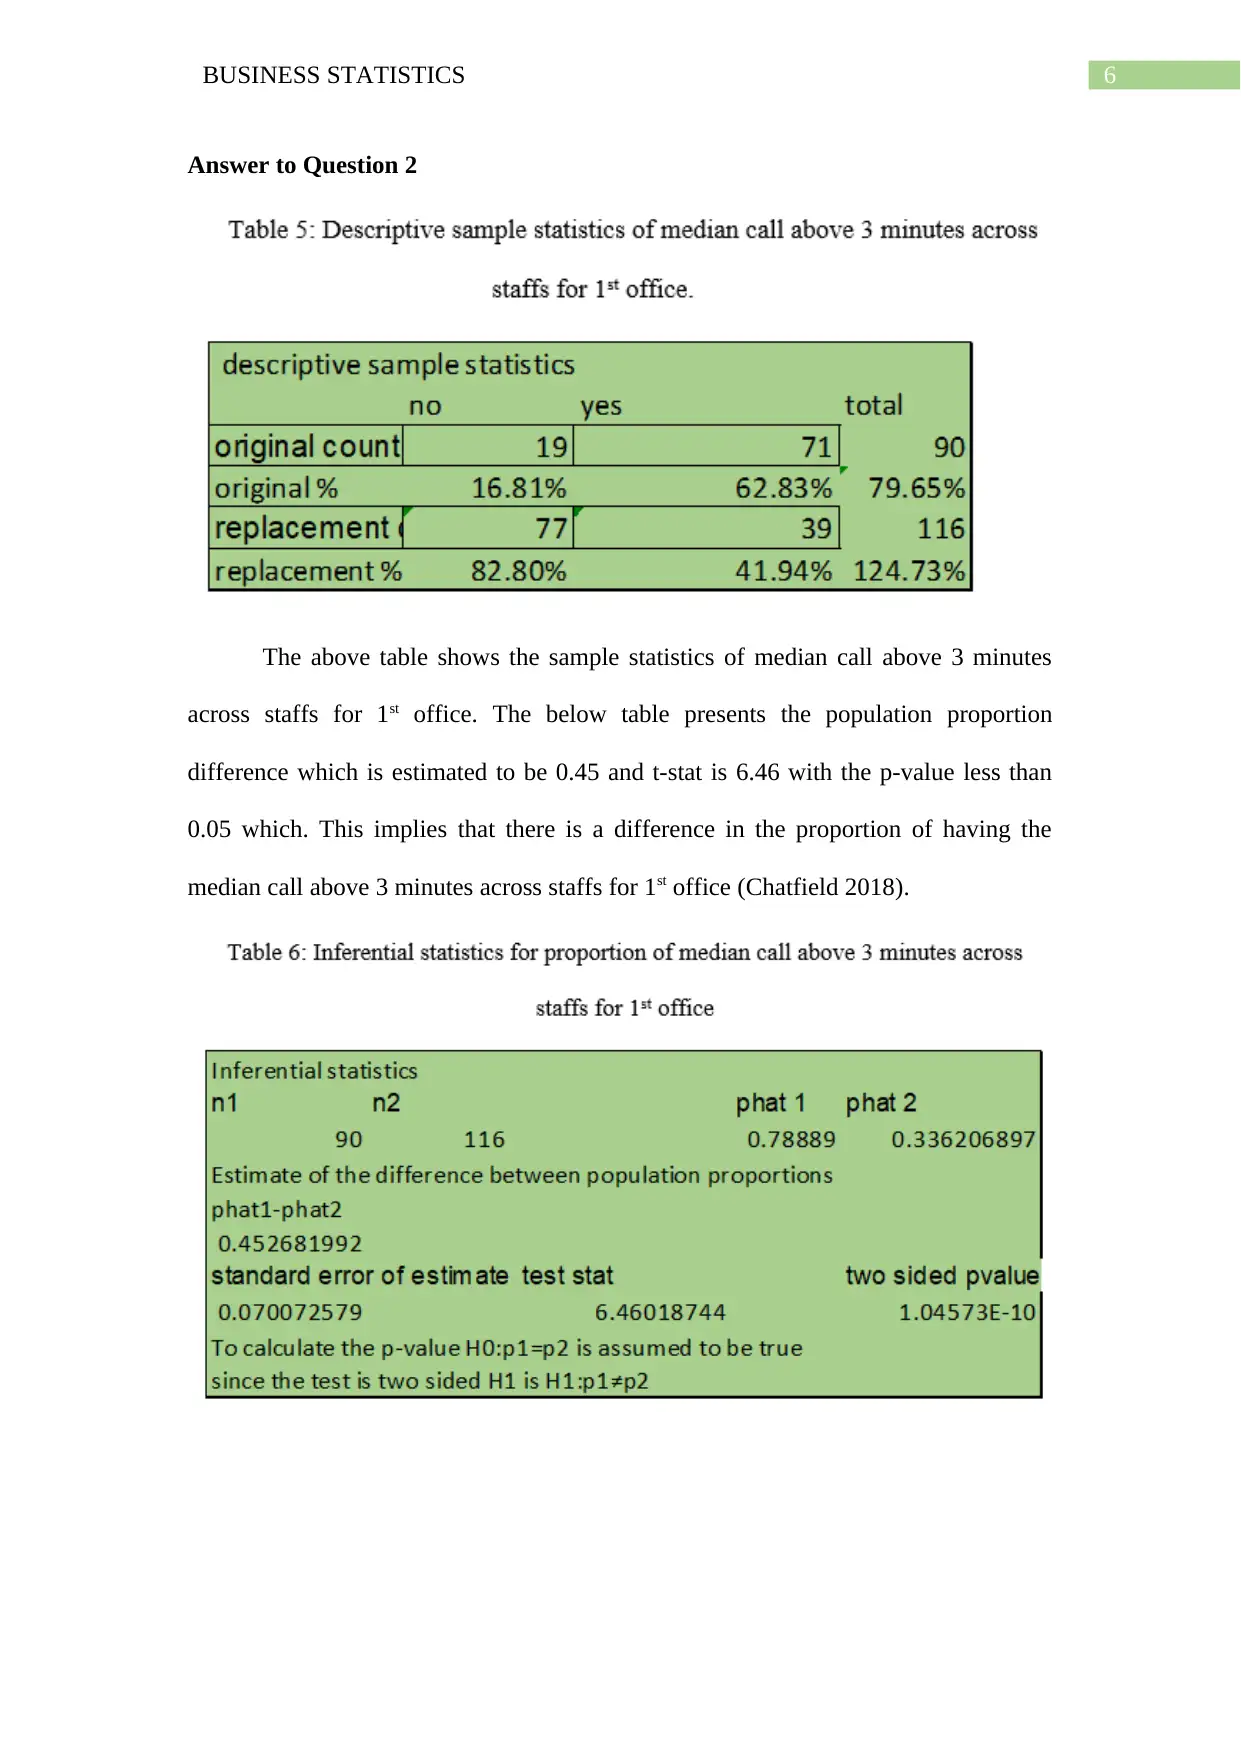
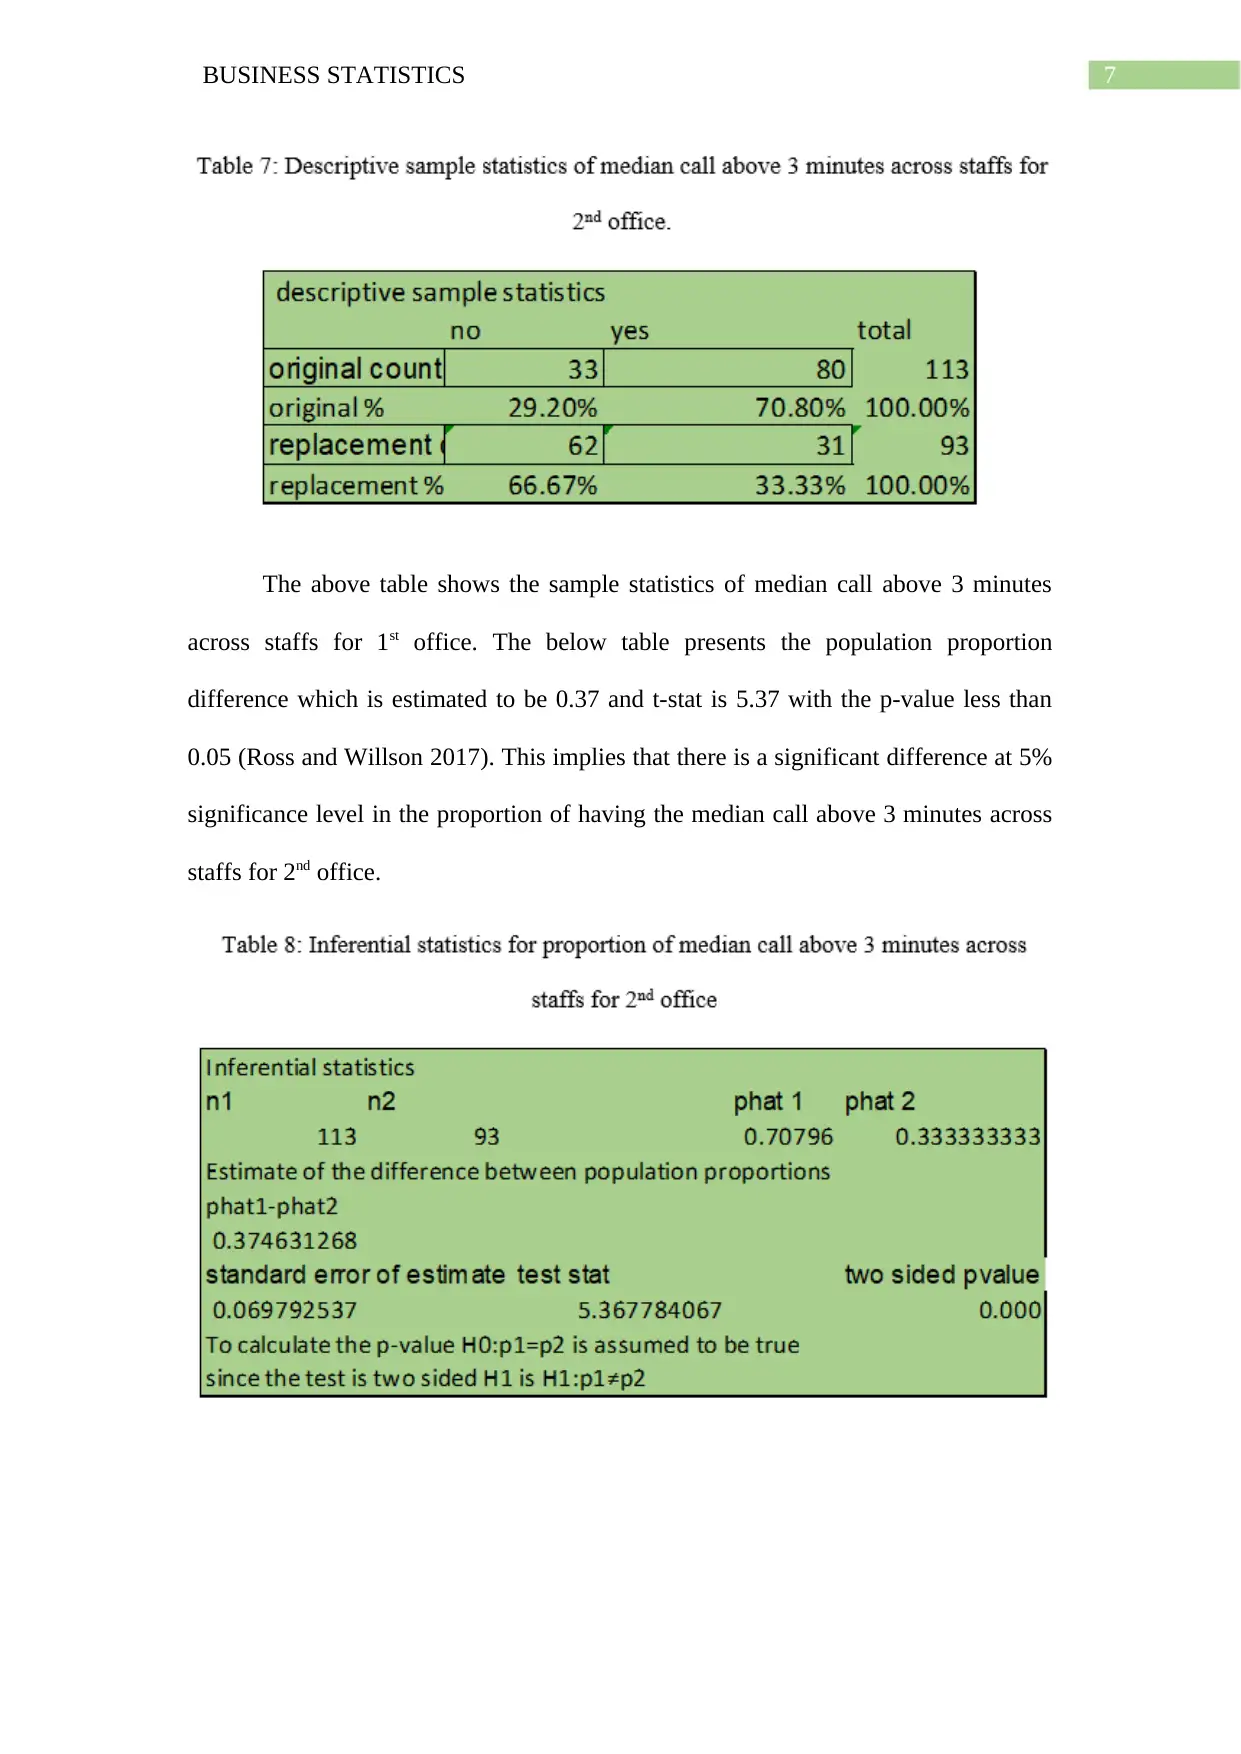
This report presents a statistical analysis of call center staff performance across two offices. The study investigates the relationship between staff type (original vs. replacement) and median call time, the proportion of calls exceeding 3 minutes, and the number of complaints received. The methodology employs statistical techniques such as independent t-tests, chi-square tests, and correlation analysis using MS Excel. Key findings include significant differences in median call times between original and replacement staff in both offices, a correlation between median call time and the number of complaints, and insights into the proportion of calls exceeding the 3-minute threshold. The analysis compares the results across the two offices, offering recommendations for improving call quality and staff performance. The report concludes with recommendations focused on replacement staff, and a detailed reference list.
Document Page
Running head: BUSINESS STATISTICS
Business Statistics
Name of the Student:
Name of the University:
Author Note:
tabler-icon-diamond-filled.svg

Paraphrase This Document

Need a fresh take? Get an instant paraphrase of this document with our AI Paraphraser
Document Page
1BUSINESS STATISTICS
Table of Contents
Introduction....................................................................................................................2
Methodology..................................................................................................................3
Data Analysis and Results..............................................................................................3
Answer to question 1......................................................................................................4
Answer to Question 2.....................................................................................................6
Answer to Question 3.....................................................................................................8
Answer to question 4....................................................................................................10
Answer to question 5....................................................................................................10
Answer to question 6....................................................................................................11
Answer to question 7....................................................................................................14
Answer to question 8....................................................................................................15
Conclusion and Recommendation................................................................................16
Reference and Bibliography.........................................................................................17
Document Page
2BUSINESS STATISTICS
Introduction
There is a company having call centre operating from two different places (1st
office and second office) and wants to know about the performance of the staff on the
basis of the number of complaints received and the median call time of that staff. The
owner of the company wants to improve the quality of calls and wants to make
suitable changes for the improvement in the quality of calls. To meet the objective of
the report following questions will be answered with the help of statistical tools:
1. Find out any significant relation between type of staff (replacement staff and
original staff) and median call time for both the 1st office and 2nd office.
2. Find out the significant relation between the type of staff and those staffs
having median call above 3 minutes for both the offices.
3. Find out the significant relation between median call time in the number of
complaints for both the offices. Is result is same for both the offices?
4. Comparison of median call time between original staff and the replacement
staff only for the 1st office.
5. Comparison of the sample proportion of workers with median call time above
3 minutes between the original staff and the replacement staff for the 1st office.
6. Find statistical evidences for the relationship between type of staff and the
median call time for the 1st office and 2nd office. Compare the findings from
both offices.
7. Find statistical evidences for the relationship between type of staff and the
median call time above 3 minutes for the 1st office and second office. Compare
the findings from both offices.
Document Page
3BUSINESS STATISTICS
8. Find statistical evidences for the relationship between number of complaints
and the median call time for the 1st office and second office. Compare the
findings from both offices.
Methodology
In order to perform the analytical research with the help of statistical test, data
is collected from each place having 206 observations each. The data from each state is
collected and kept separately. The data collected from 1st office is stored in dataset 1
and the data collected from 2nd office is stored in dataset 2. The dataset includes the
information about the median call time, number of complains, median call time above
3 minutes and the kind of staff. The number of complains captures the number of
complaints received from that staff only and the variable is quantitative and
continuous variable. The median call time stores the data that represents the median of
the duration of a call operated by that staff only. The median call time above 3
minutes is a dummy variable which shows that whether the median call time is more
than 3 minutes or not. The variable kind of staff records two types of staff which are
replacement staff and original staff.
The report has used the MS Excel to perform the statistical analysis. It
includes the statistical tools and techniques like Independent two sample t-test, chi-
square test, correlation, scatter plot and t-test for correlation coefficient (Rees 2018).
This all tests are used where they are suitable answer the above mentioned questions.
Data Analysis and Results
This section uses all the statistical tools and techniques that are necessary to
find out the statistical evidences to answer the research questions. The analysis is
presented for each question one by one in the following sub-headings:
tabler-icon-diamond-filled.svg

Paraphrase This Document

Need a fresh take? Get an instant paraphrase of this document with our AI Paraphraser
Document Page
4BUSINESS STATISTICS
Answer to question 1
The below table presents the mean and standard deviation of median call time
for Original staff and replacement staff. The mean of the median call time for the
original and replacement staff is 3.39 minutes and 2.83 minutes respectively found in
dataset 1 (Ott 2018).
The below table presents the results of independent two sample t-test. The
table presents the difference which says the median call for original staff is 0.56
minutes greater than the median call for replacement staff. The estimated t-stat is
11.4815 and corresponding p-value is less than 0.05. This all implies that there is a
significant difference in median call between original staff and replacement staff at
5% significance level which is found in 2nd office.
Document Page
5BUSINESS STATISTICS
The below table presents The mean of the median call time for the original and
replacement staff is 3.39 minutes and 2.83 minutes respectively found in dataset 2.
The table shows that the median call for original staff is 0.52 minutes greater
than the median call for replacement staff. The estimated t-stat is 10.01 and
corresponding p-value is less than 0.05. Hence, there is a significant difference in
median call between original staff and replacement staff at 5% significance level
which is found in 2nd office (Gerald 2018).
The mean difference at 5% significance level in the median call across type of
staff is found to be 0.56 and 0.52 for 1st office and 2nd office respectively.
Document Page
6BUSINESS STATISTICS
Answer to Question 2
The above table shows the sample statistics of median call above 3 minutes
across staffs for 1st office. The below table presents the population proportion
difference which is estimated to be 0.45 and t-stat is 6.46 with the p-value less than
0.05 which. This implies that there is a difference in the proportion of having the
median call above 3 minutes across staffs for 1st office (Chatfield 2018).
tabler-icon-diamond-filled.svg

Paraphrase This Document

Need a fresh take? Get an instant paraphrase of this document with our AI Paraphraser
Document Page
7BUSINESS STATISTICS
The above table shows the sample statistics of median call above 3 minutes
across staffs for 1st office. The below table presents the population proportion
difference which is estimated to be 0.37 and t-stat is 5.37 with the p-value less than
0.05 (Ross and Willson 2017). This implies that there is a significant difference at 5%
significance level in the proportion of having the median call above 3 minutes across
staffs for 2nd office.
Document Page
8BUSINESS STATISTICS
Answer to Question 3
The below table presents the sample correlation which is found to be 0.911 is
statistically significant at 5% significance level. This implies there is strong positive
correlation between median call time and the number of complaints.
The below diagram shows the association between median call time and the
number of complaints. The number of complaints is presented in the Y axis and the
median call is presented in the X axis. The scatter plot shows that the points are
upward rising.
Document Page
9BUSINESS STATISTICS
The below table presents the sample correlation which is found to be 0.882 is
statistically significant at 5% significance level. This implies that there is strong
positive correlation between median call time and the number of complaints.
The below diagram shows the association between median call time and the
number of complaints. Which shows the upward rising trend line.
tabler-icon-diamond-filled.svg

Paraphrase This Document

Need a fresh take? Get an instant paraphrase of this document with our AI Paraphraser
Document Page
10BUSINESS STATISTICS
From the above analysis, it is found that the correlation between median call
time and the number of complaints is greater for the 1st office than 2nd office.
Answer to question 4
The above table shows that the z-score is .3513 for the original staff and -
0.1553 for the replacement staff in case of 1st office. The higher Z-score shows the
more reliable and acceptable result. Hence, the median call time with 3 minutes of
population mean with 1.1 minutes of standard deviation is shows the better outcome
for the original staffs in 1st office (Rumsey 2016).
Answer to question 5
Document Page
11BUSINESS STATISTICS
The proportion of median call time above 3 minutes is 79% and the 95%
confidence interval is from 70.46% to 87.32% for the original staff in the 1st office.
The proportion of median call time above 3 minutes is 34% and the 95%
confidence interval is from 25.02% to 42.22% for the original staff in the 2nd office.
Answer to question 6
chevron_up_icon
1 out of 19
circle_padding
hide_on_mobile
zoom_out_icon
[object Object]