Business Statistics: Analyzing Call Data - University Assignment 2018

Verified

Added on  2023/06/15

|13
|2416
|407
Homework Assignment
AI Summary
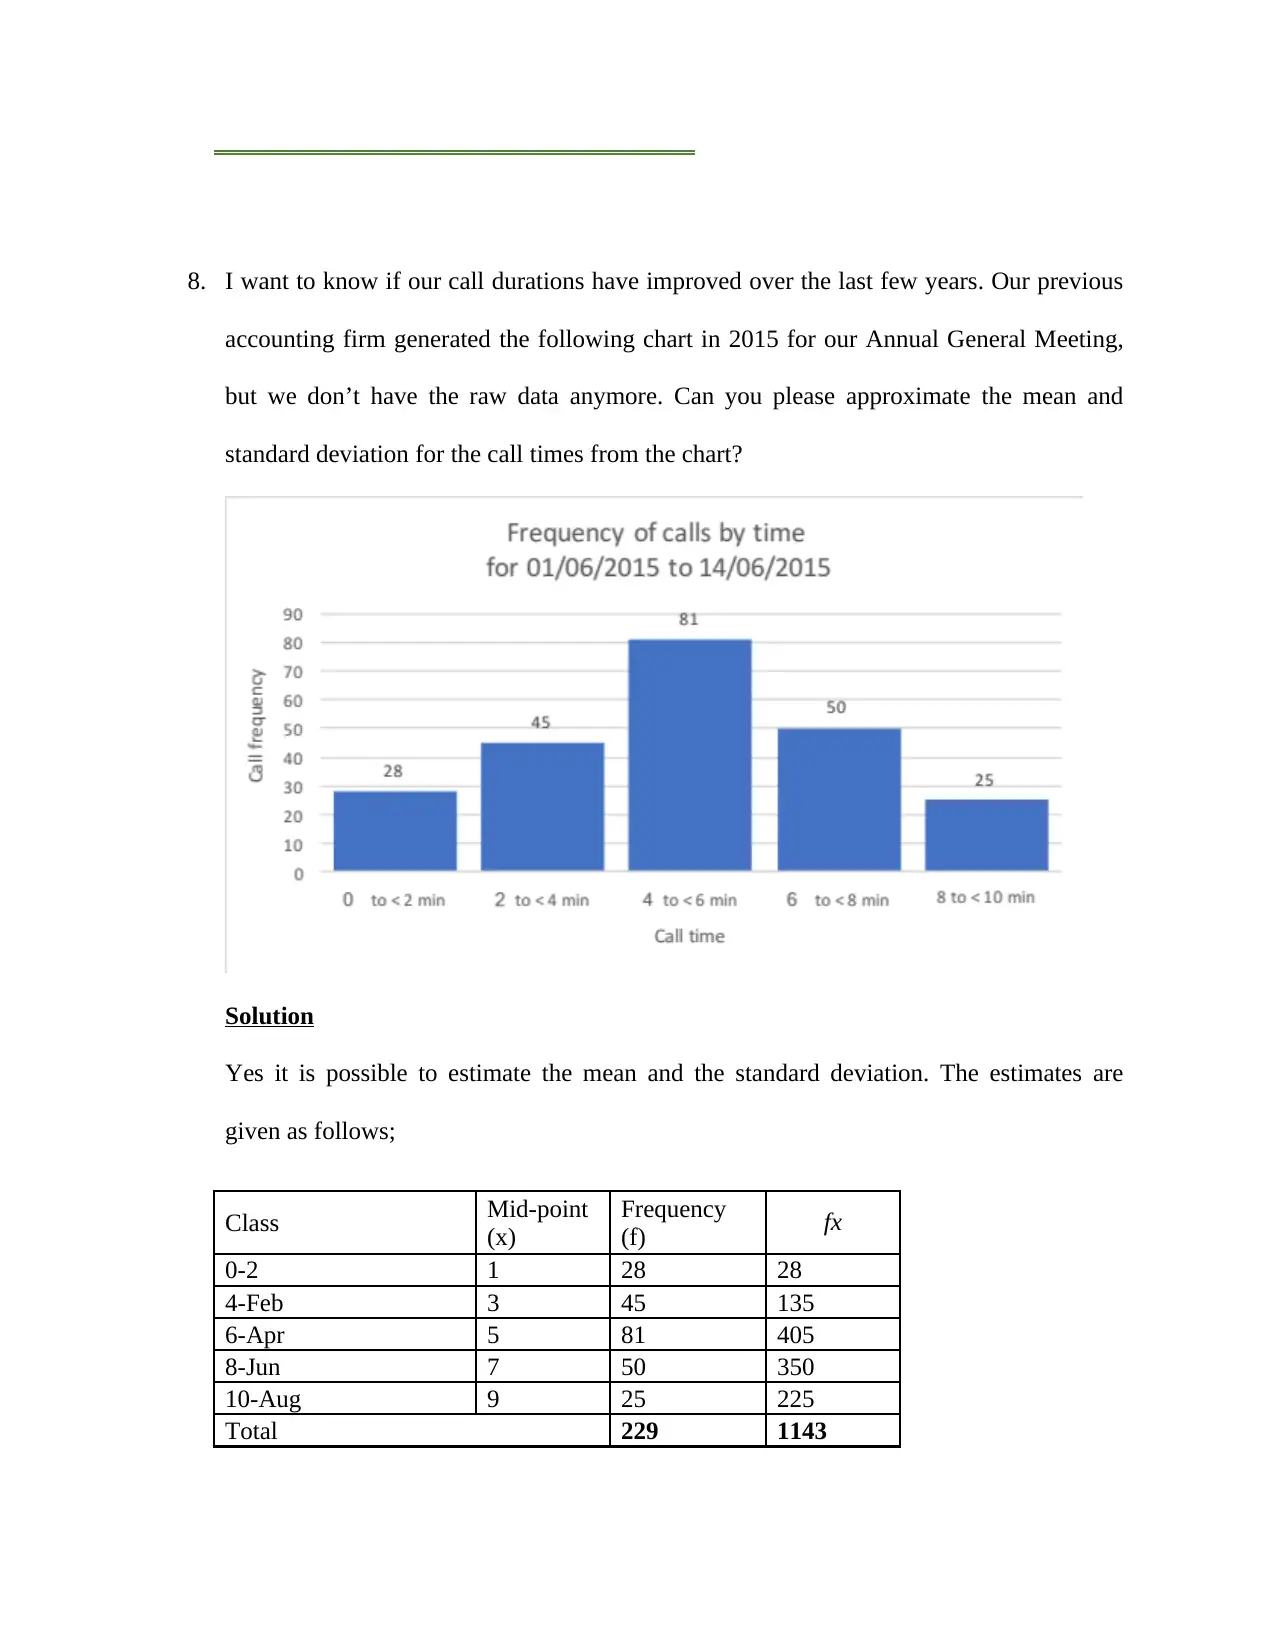
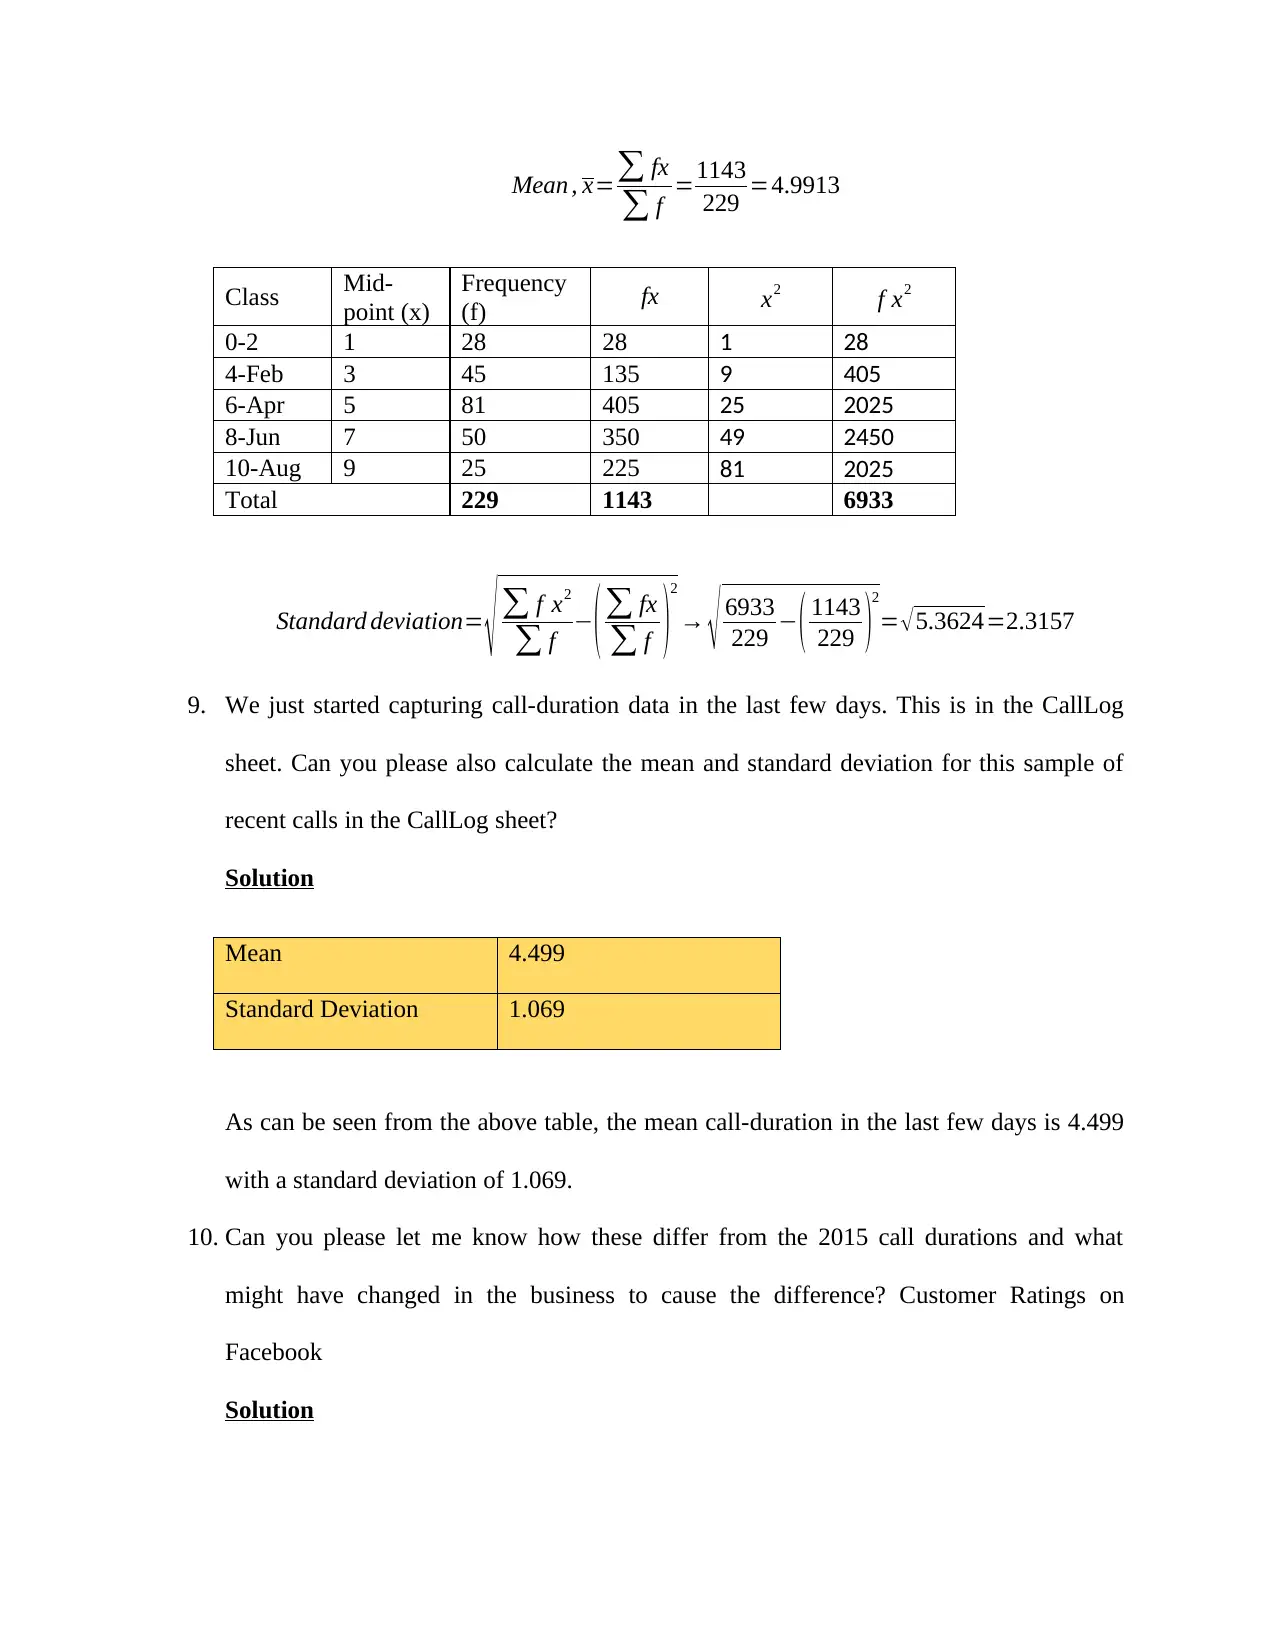
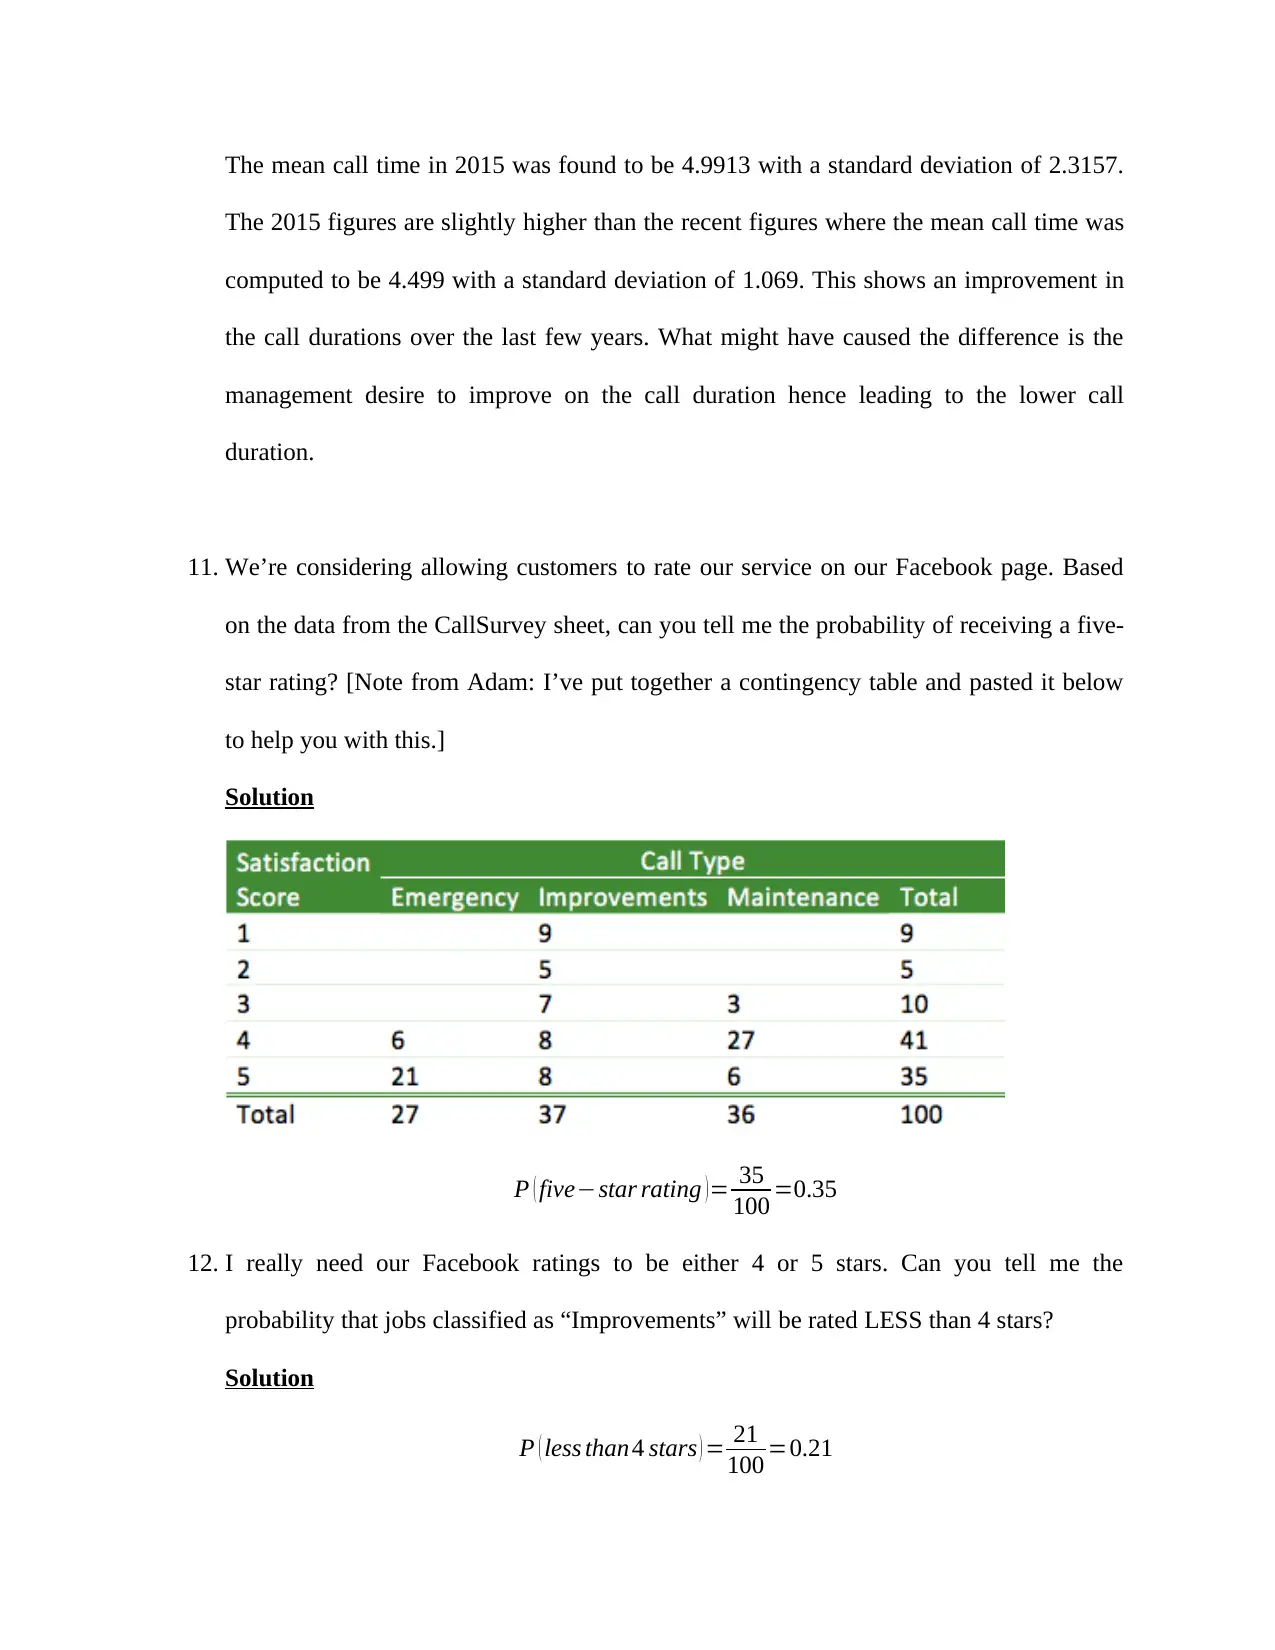
This assignment focuses on applying statistical methods to analyze call data for a business. It covers topics such as identifying outliers in daily call volumes, calculating mean and standard deviation for customer satisfaction ratings and call durations, and comparing satisfaction ratings across different job types (Emergency, Improvements, Maintenance). Hypothesis testing is used to determine if the return on investment (ROI) for emergency jobs is significantly lower than that of improvements jobs, and confidence intervals are calculated to assess the reliability of customer satisfaction scores. The assignment also explores the probability of receiving certain customer ratings and discusses the implications of changing the business mix based on the statistical findings. It concludes with a discussion on Type II errors in hypothesis testing and provides recommendations for business decisions based on the data analysis. Desklib offers this and many other solved assignments for students.
Document Page
Statistics for business
Student Name:
University
11th February 2018
tabler-icon-diamond-filled.svg

Paraphrase This Document

Need a fresh take? Get an instant paraphrase of this document with our AI Paraphraser
Document Page
1. We recently implemented a new phone system that captures data on all incoming calls.
The only automated report it produces looks like the image below. Can you tell me what
each of the numbers mean? Daily Incoming Calls between 01/10/2017 and 30/11/2017
Daily Incoming Calls between 01/10/2017 and 30/11/2017
Solution
The lower quartile is 46 while the median (middle quartile) is 52. Upper quartile is 61
while the upper whisker is 69.
2. I searched Google to try and understand the above plot and it looked like it was left-
skewed. Am I correct? What does this actually mean?
Solution
No the plot shows that the data is right-skewed. The plot means that the median number
of daily incoming calls is lower than the mean daily incoming calls.
3. From searching Google about the above plot, it also looks like we only got two calls one
day, but the quietest day I can remember in the last few months was around 35 calls.
What could have happened here to get that number?
Solution
The number 2 is definitely an outlier. This could be as a result of wrong entry.
4. The system produces day-to-day totals, which are in the CallNumbers sheet, which was
used to generate the above box-plot. Is this “2” an “outlier”? Are any others? Can you
Document Page
give statistical evidence that it’s an outlier? If so, I can use these to raise an issue with the
phone system provider… Call Survey
Solution
Yes the “2” is an outlier as can be seen from the plot. There are other outliers for instance
“69” is also an outlier. The given values are outliers since they are beyond the lower and
the upper bounds. Any value beyond or below the upper and lower bound respectively
qualifies to be an outlier.
5. My reception team has been following up every job we do. They have collected data on
customer satisfaction for customers who are willing to participate in a short survey. The
data are in the CallSurvey sheet. Can you please tell me the mean and standard deviation
customer satisfaction rating (1-5)?
Solution
Mean 3.880
Standard deviation 1.202
As can be seen from the above table, the mean satisfaction rating is 3.880 with a standard
deviation of 1.202.
6. Can I please see a chart that compares the average satisfaction rating for each job type?
Solution
Document Page
Emergency job type had a much higher satisfaction among the job types followed by
maintenance while improvements had lowest satisfaction rating.
7. I’m interested in how many survey responses we got for each job type. Can you give me
the AVERAGE TYPE of call? [Note from Adam: The average type of call is not
possible. Please explain to Walter why we can’t do this and provide some numbers to
answer his real question.] Call durations
Solution
It is not possible to get the average type of call since type of call is a nominal variable
and not a numerical variable. Average can only be obtained for numerical variables. The
only thing we can find is the count for each job type and not average. The count for each
job type is given in the table below.
Row Labels Count of Type
Emergency 27
Improvements 37
Maintenance 36
Grand Total 100
tabler-icon-diamond-filled.svg

Paraphrase This Document

Need a fresh take? Get an instant paraphrase of this document with our AI Paraphraser
Document Page
8. I want to know if our call durations have improved over the last few years. Our previous
accounting firm generated the following chart in 2015 for our Annual General Meeting,
but we don’t have the raw data anymore. Can you please approximate the mean and
standard deviation for the call times from the chart?
Solution
Yes it is possible to estimate the mean and the standard deviation. The estimates are
given as follows;
Class Mid-point
(x)
Frequency
(f) fx
0-2 1 28 28
4-Feb 3 45 135
6-Apr 5 81 405
8-Jun 7 50 350
10-Aug 9 25 225
Total 229 1143
Document Page
Mean , x= fx
f =1143
229 =4.9913
Class Mid-
point (x)
Frequency
(f) fx x2 f x2
0-2 1 28 28 1 28
4-Feb 3 45 135 9 405
6-Apr 5 81 405 25 2025
8-Jun 7 50 350 49 2450
10-Aug 9 25 225 81 2025
Total 229 1143 6933
Standard deviation=
f x2
f ( fx
f )2
6933
229 ( 1143
229 )2
= 5.3624=2.3157
9. We just started capturing call-duration data in the last few days. This is in the CallLog
sheet. Can you please also calculate the mean and standard deviation for this sample of
recent calls in the CallLog sheet?
Solution
Mean 4.499
Standard Deviation 1.069
As can be seen from the above table, the mean call-duration in the last few days is 4.499
with a standard deviation of 1.069.
10. Can you please let me know how these differ from the 2015 call durations and what
might have changed in the business to cause the difference? Customer Ratings on
Facebook
Solution
Document Page
The mean call time in 2015 was found to be 4.9913 with a standard deviation of 2.3157.
The 2015 figures are slightly higher than the recent figures where the mean call time was
computed to be 4.499 with a standard deviation of 1.069. This shows an improvement in
the call durations over the last few years. What might have caused the difference is the
management desire to improve on the call duration hence leading to the lower call
duration.
11. We’re considering allowing customers to rate our service on our Facebook page. Based
on the data from the CallSurvey sheet, can you tell me the probability of receiving a five-
star rating? [Note from Adam: I’ve put together a contingency table and pasted it below
to help you with this.]
Solution
P ( fivestar rating ) = 35
100 =0.35
12. I really need our Facebook ratings to be either 4 or 5 stars. Can you tell me the
probability that jobs classified as “Improvements” will be rated LESS than 4 stars?
Solution
P ( less than4 stars ) = 21
100 =0.21
tabler-icon-diamond-filled.svg

Paraphrase This Document

Need a fresh take? Get an instant paraphrase of this document with our AI Paraphraser
Document Page
13. I want to include an average of Facebook ratings in our advertising. I’m thinking of only
inviting customers to rate us on Facebook the job was an emergency or maintenance so
the “Improvements” customers don’t bring down average our rating score. What do you
think? Confidence in Satisfaction Scores
Solution
We compute the 95% Confidence Interval (C.I) as follows;
C . I=x ± M . E
M . E=zα/ 2
σ
n 1.961.208388
100 =0.2368
x=3.88
Lower bound=3.880.2388=3.6412
Uppe r bound=3.88+0.2388=4.1188
From the previous results, the average satisfaction score for the improvement job type
was found to be 3.03. The 95% confident interval is between 3.6412 and 4.1188 and as
can be seen the value of 3.03 is actually lower than the confidence interval for the overall
satisfaction rating. Based on this, it would therefore not be a bad idea to only invite
customers to rate us on Facebook given that the job was an Emergency or Maintenance in
order to not allow the “Improvements” rating bring down average our rating score.
14. I am aware that the customer ratings collected in the CallSurvey sheet are just for a
sample of three typical days and so the actual customer satisfaction could be slightly
different if we had a bigger sample. How can I know this data in CallSurvey is reliable?
Can you provide some information to give me 95% confidence in the overall satisfaction
score?
Solution
Document Page
To check how reliable the data is, we need to know the population average score and
check whether the sample average confidence interval falls in the population average. To
calculate the confidence interval we apply the following procedures;
Confidence Interval (C.I) is given as;
C . I=x ± M . E
M . E=zα/ 2
σ
n 1.961.208388
100 =0.2368
x=3.88
Lower bound=3.880.2388=3.6412
Uppe r bound=3.88+0.2388=4.1188
So we are 95% confident that the true overall satisfaction score is between 3.6412 and
4.1188.
15. I also want to know how reliable the differences are in satisfaction scores between job
type. Can you provide some information to give me 95% confidence in the satisfaction
score for each job type?
Solution
Emergency Improvements Maintenance
Mean 4.7778 3.0270 4.0833
Standard Deviation 0.4157 1.4793 0.4930
Sample size 27 37 36
95% confidence interval for difference in mean between Emergency and Improvements
Results
Difference -1.751
Standard 0.293
Document Page
error
95% CI -2.3372 to -
1.1644
t-statistic -5.969
DF 62
Significance
level
P < 0.0001
95% confidence interval for difference in mean between Emergency and
Maintenance
Results
Difference -0.695
Standard error 0.118
95% CI -0.9295 to -0.4595
t-statistic -5.909
DF 61
Significance level P < 0.0001
95% confidence interval for difference in mean between Improvements and Maintenance
Results
Difference 1.056
Standard error 0.260
95% CI 0.5387 to 1.5739
t-statistic 4.069
DF 71
tabler-icon-diamond-filled.svg

Paraphrase This Document

Need a fresh take? Get an instant paraphrase of this document with our AI Paraphraser
Document Page
Significance level P = 0.0001
16. Based on the last question, is the satisfaction score between each job type really that
different? How do you know? Changing Business Mix
Solution
Yes the above results shows that the satisfaction score between each job type are indeed
significantly different.
The satisfaction scores are significantly different for Emergency and Improvements. The
satisfaction scores were also significantly different for Emergency and Maintenance. The
same was for Improvements and Maintenance.
17. The “Improvements” jobs have always been difficult. Customers usually get several
quotes and we must be very competitive on price. It often en******** cost********s
more than we expected. I’m wondering if we should stop trying to offer home
improvement plumbing work and just focus on growing the “emergencies” side of the
business. I’ve calculated the basic return on investment (ROI) for each of the jobs in the
CallLog sheet. Based on that data, can you tell me if the ROI for the “Emergencies” job
type is really lower than the ROI of the “Improvements” job type?
Solution
For this question, I sought to test the following hypothesis;
H0 : ROI for the Emergencies is equal ¿ that of the Improvements
H A : ROI for the Emergencies is significantly lower thanthat of the Improvements
I tested this using t-test assuming equal variances at 5% level of significance. The results
of the t-test are provided below;
Document Page
t-Test: Two-Sample Assuming Equal Variances
Emergency
Improvement
s
Mean 0.07562631 0.21514789
Variance 0.32538828 0.49337692
Observations 70 86
Pooled Variance 0.41810928
Hypothesized Mean Difference 0
df 154
t Stat -1.3403938
P(T<=t) one-tail 0.09104572
t Critical one-tail 1.65480839
P(T<=t) two-tail 0.18209144
t Critical two-tail 1.97548806
As can be seen, the p-value for one-tail is 0.091 (a value greater than 5% level of
significance), we thus fail to reject the null hypothesis and conclude that there is no
significant evidence to say that the ROI for the “Emergencies” job type is really lower
than the ROI of the “Improvements” job type.
18. I tried to work out the above question on my own. After some web searches, I got very
confused. Can you give me a very brief explanation of what the null hypothesis is and
whether it was accepted in the above answer?
Solution
The null hypothesis for the above question is;
H0 : ROI for the Emergencies is equal ¿ that of the Improvements
This null hypothesis was accepted since the p-value was found to be greater than 5%
level of significance.
chevron_up_icon
1 out of 13
circle_padding
hide_on_mobile
zoom_out_icon
[object Object]