Corporate Accounting Analysis: Caltex Australia's Financial Statements
VerifiedAdded on 2021/06/14
|11
|2446
|31
Report
AI Summary
This report provides a detailed analysis of Caltex Australia Limited's financial statements. It examines the cash flow statement, highlighting changes in operating, investing, and financing activities over several years, and analyzes the reasons behind these changes. The report also investigates the items included in the other comprehensive income statement, explaining their causes and why certain items are not reported in the income statement. Furthermore, it delves into Caltex's income tax expenditure, verifying its calculation and examining deferred tax reported in the balance sheet, including income tax payable and current tax assets. The analysis compares income tax expenditure with income tax paid in the cash flow statement and identifies unique features in the financial statements, offering new insights into the company's financial performance.
1CORPORATE ACCOUNTING
CORPORATE ACCOUNTING
Name of the Student
Name of the University
Author’s Note
CORPORATE ACCOUNTING
Name of the Student
Name of the University
Author’s Note
Paraphrase This Document
Need a fresh take? Get an instant paraphrase of this document with our AI Paraphraser
2CORPORATE ACCOUNTING
Table of Contents
Brief Overview of Caltex.................................................................................................................3
Changes in item of cash flow statement of Caltex over the past few years and analyzing reasons
for change........................................................................................................................................3
Items of Other Comprehensive Income Statement..........................................................................6
Analyzing each item of other comprehensive income statement....................................................6
Causes for the items not reported in the income statement.............................................................7
Explaining about Caltex’s income tax expenditure.........................................................................7
Verification of the tax being figure that is same as Caltex tax rate times the company’s
accounting income...........................................................................................................................7
Deferred tax reported in balance sheet and reasons for record........................................................8
Income tax payable or current tax assets recorded by the firm.......................................................8
Verification of income tax expenditure given in income statement same as income tax paid
shown in cash flow statement..........................................................................................................9
Features in financial statements and new insights...........................................................................9
References......................................................................................................................................10
3CORPORATE ACCOUNTING
Brief Overview of Caltex
The purpose of this report is to analyze the annual report of a company that is listed on
ASX (Australian Stock Exchange). The company that has been selected in this report is Caltex
Australia Limited, which is an Australia-based supplier of transport fuel and convenience retailer
organization. This organization has been engaged in business of buying, marketing and
distributing its petroleum products as well as operating convenience stores across this nation.
This organization has been operating via two segments that involve- Lytton and supply as well as
marketing. This enterprise has been listed on Australian Securities Exchange and has been
constituent of S&P/ASX 50 index.
Changes in item of cash flow statement of Caltex over the past few years and analyzing
reasons for change
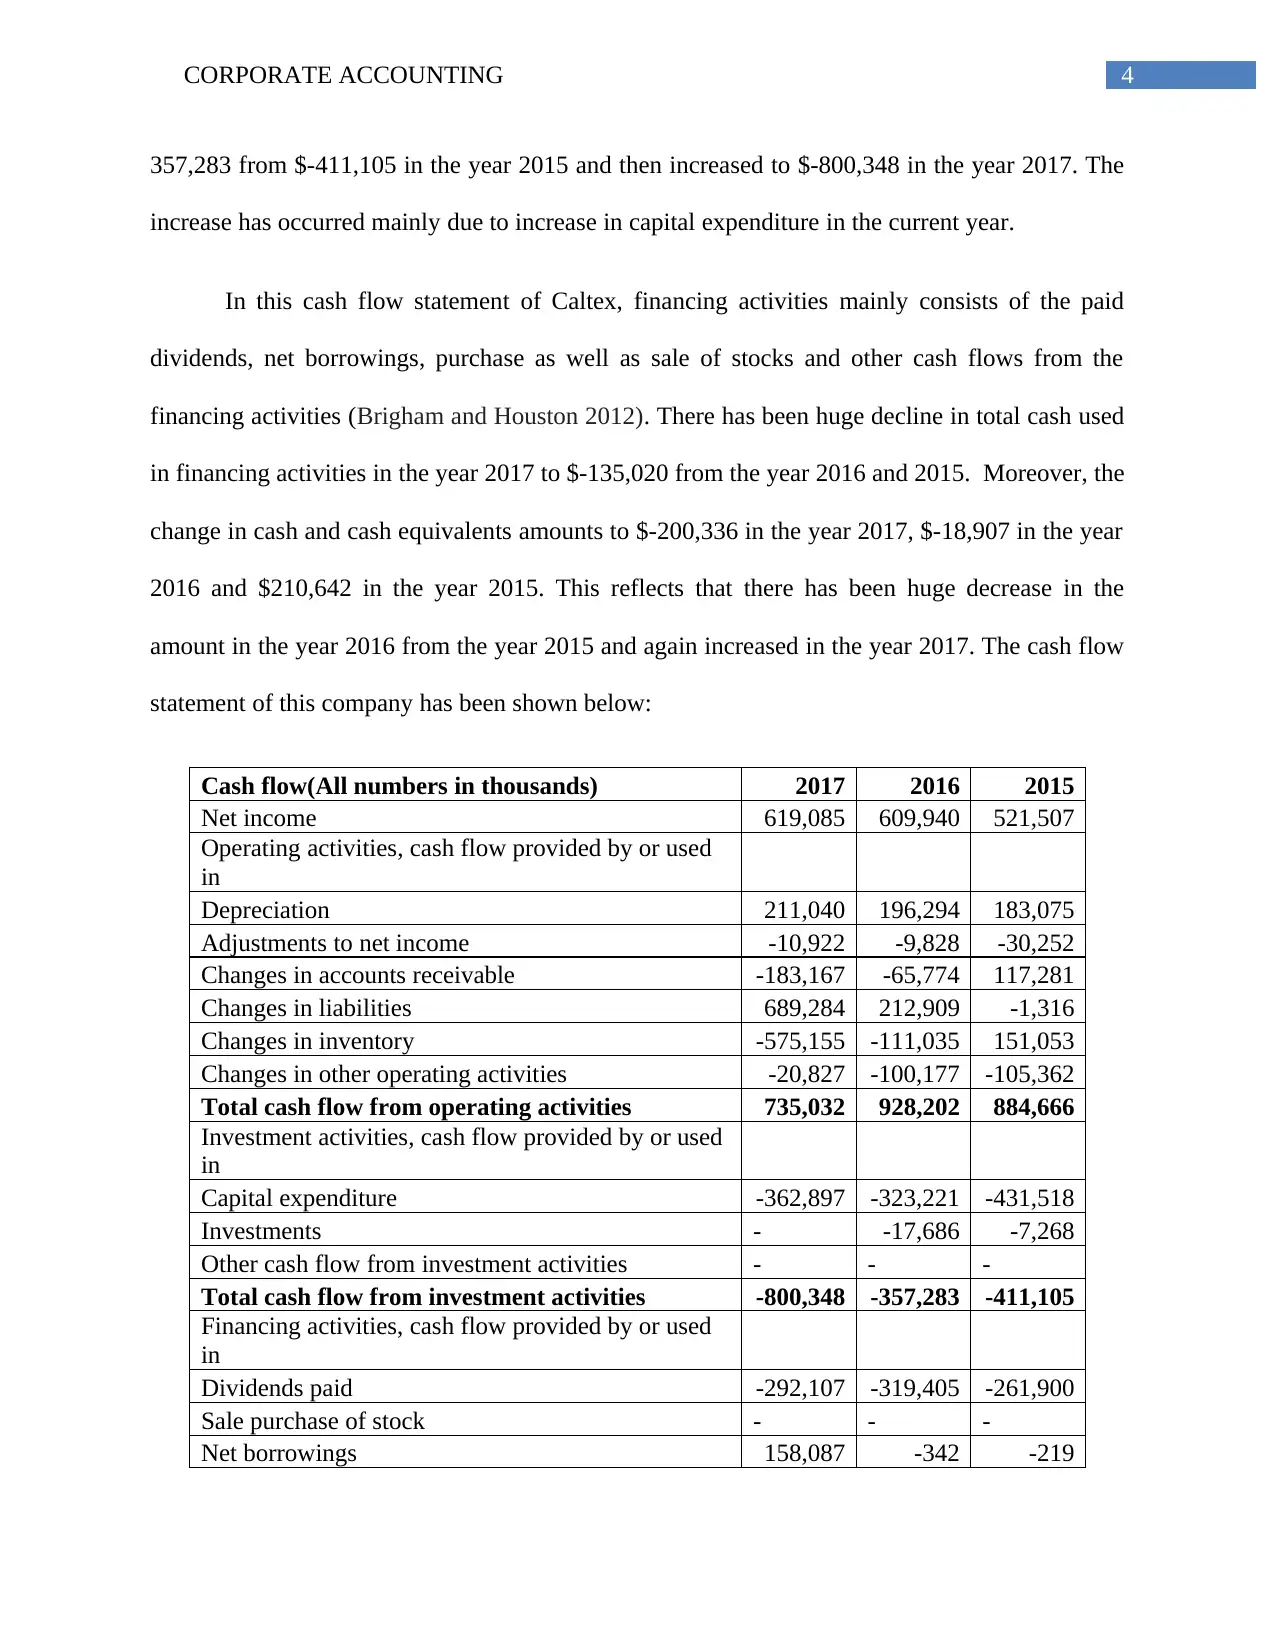
The cash flow statement of Caltex Australia Limited mainly consist of three sections that
involves cash flow from investing activities, operating activities, financing activities and net cash
as well as cash equivalents (Bodnar and Hopwood 2012). The items that are included in the
operating activities involves depreciation, adjustments to net income, liabilities changes,
inventory changes, changes in accounts receivable and changes in other operating activities. It
has been seen that the total cash flow of operating activities has declined in the year 2017 to
$735,032 from the year 2016 and 2015.
The items that are included in the investment activities are capital expenses, investments
and other cash flow from investment activities (Farshadfar and Monem 2013). It has been
evident that the total cash used for the investment activities decreased in the year 2016 to $-
Brief Overview of Caltex
The purpose of this report is to analyze the annual report of a company that is listed on
ASX (Australian Stock Exchange). The company that has been selected in this report is Caltex
Australia Limited, which is an Australia-based supplier of transport fuel and convenience retailer
organization. This organization has been engaged in business of buying, marketing and
distributing its petroleum products as well as operating convenience stores across this nation.
This organization has been operating via two segments that involve- Lytton and supply as well as
marketing. This enterprise has been listed on Australian Securities Exchange and has been
constituent of S&P/ASX 50 index.
Changes in item of cash flow statement of Caltex over the past few years and analyzing
reasons for change
The cash flow statement of Caltex Australia Limited mainly consist of three sections that
involves cash flow from investing activities, operating activities, financing activities and net cash
as well as cash equivalents (Bodnar and Hopwood 2012). The items that are included in the
operating activities involves depreciation, adjustments to net income, liabilities changes,
inventory changes, changes in accounts receivable and changes in other operating activities. It
has been seen that the total cash flow of operating activities has declined in the year 2017 to
$735,032 from the year 2016 and 2015.
The items that are included in the investment activities are capital expenses, investments
and other cash flow from investment activities (Farshadfar and Monem 2013). It has been
evident that the total cash used for the investment activities decreased in the year 2016 to $-
⊘ This is a preview!⊘
Do you want full access?
Subscribe today to unlock all pages.
Trusted by 1+ million students worldwide
4CORPORATE ACCOUNTING
357,283 from $-411,105 in the year 2015 and then increased to $-800,348 in the year 2017. The
increase has occurred mainly due to increase in capital expenditure in the current year.
In this cash flow statement of Caltex, financing activities mainly consists of the paid
dividends, net borrowings, purchase as well as sale of stocks and other cash flows from the
financing activities (Brigham and Houston 2012). There has been huge decline in total cash used
in financing activities in the year 2017 to $-135,020 from the year 2016 and 2015. Moreover, the
change in cash and cash equivalents amounts to $-200,336 in the year 2017, $-18,907 in the year
2016 and $210,642 in the year 2015. This reflects that there has been huge decrease in the
amount in the year 2016 from the year 2015 and again increased in the year 2017. The cash flow
statement of this company has been shown below:
Cash flow(All numbers in thousands) 2017 2016 2015
Net income 619,085 609,940 521,507
Operating activities, cash flow provided by or used
in
Depreciation 211,040 196,294 183,075
Adjustments to net income -10,922 -9,828 -30,252
Changes in accounts receivable -183,167 -65,774 117,281
Changes in liabilities 689,284 212,909 -1,316
Changes in inventory -575,155 -111,035 151,053
Changes in other operating activities -20,827 -100,177 -105,362
Total cash flow from operating activities 735,032 928,202 884,666
Investment activities, cash flow provided by or used
in
Capital expenditure -362,897 -323,221 -431,518
Investments - -17,686 -7,268
Other cash flow from investment activities - - -
Total cash flow from investment activities -800,348 -357,283 -411,105
Financing activities, cash flow provided by or used
in
Dividends paid -292,107 -319,405 -261,900
Sale purchase of stock - - -
Net borrowings 158,087 -342 -219
Paraphrase This Document
Need a fresh take? Get an instant paraphrase of this document with our AI Paraphraser
5CORPORATE ACCOUNTING
Other cash flow from financing activities -1,000 -1,000 -800
Total cash flow from financing activities -135,020 -589,826 -262,919
Effect of exchange rate changes - - -
Change in cash and cash equivalents -200,336 -18,907 210,642
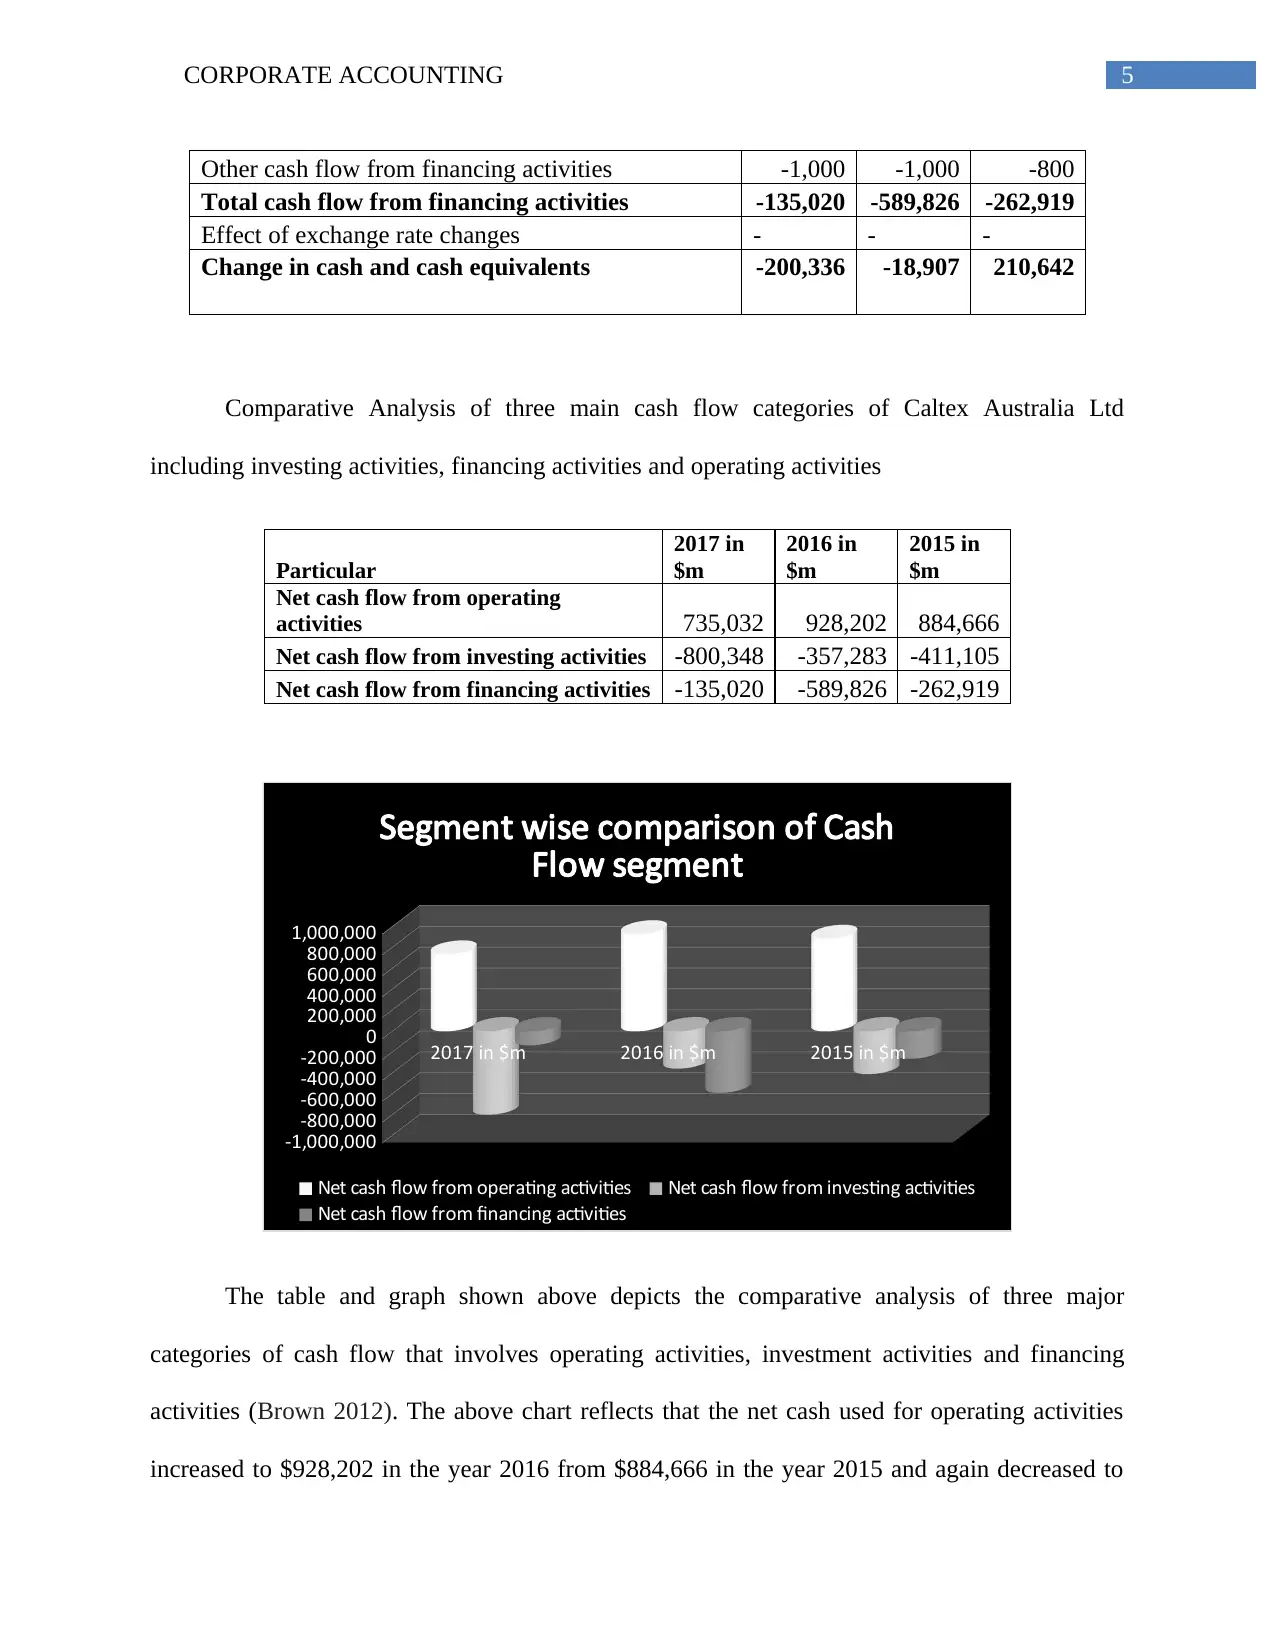
Comparative Analysis of three main cash flow categories of Caltex Australia Ltd
including investing activities, financing activities and operating activities
Particular
2017 in
$m
2016 in
$m
2015 in
$m
Net cash flow from operating
activities 735,032 928,202 884,666
Net cash flow from investing activities -800,348 -357,283 -411,105
Net cash flow from financing activities -135,020 -589,826 -262,919
2017 in $m 2016 in $m 2015 in $m
-1,000,000
-800,000
-600,000
-400,000
-200,000
0
200,000
400,000
600,000
800,000
1,000,000
Segment wise comparison of Cash
Flow segment
Net cash flow from operating activities Net cash flow from investing activities
Net cash flow from financing activities
The table and graph shown above depicts the comparative analysis of three major
categories of cash flow that involves operating activities, investment activities and financing
activities (Brown 2012). The above chart reflects that the net cash used for operating activities
increased to $928,202 in the year 2016 from $884,666 in the year 2015 and again decreased to
Other cash flow from financing activities -1,000 -1,000 -800
Total cash flow from financing activities -135,020 -589,826 -262,919
Effect of exchange rate changes - - -
Change in cash and cash equivalents -200,336 -18,907 210,642
Comparative Analysis of three main cash flow categories of Caltex Australia Ltd
including investing activities, financing activities and operating activities
Particular
2017 in
$m
2016 in
$m
2015 in
$m
Net cash flow from operating
activities 735,032 928,202 884,666
Net cash flow from investing activities -800,348 -357,283 -411,105
Net cash flow from financing activities -135,020 -589,826 -262,919
2017 in $m 2016 in $m 2015 in $m
-1,000,000
-800,000
-600,000
-400,000
-200,000
0
200,000
400,000
600,000
800,000
1,000,000
Segment wise comparison of Cash
Flow segment
Net cash flow from operating activities Net cash flow from investing activities
Net cash flow from financing activities
The table and graph shown above depicts the comparative analysis of three major
categories of cash flow that involves operating activities, investment activities and financing
activities (Brown 2012). The above chart reflects that the net cash used for operating activities
increased to $928,202 in the year 2016 from $884,666 in the year 2015 and again decreased to
6CORPORATE ACCOUNTING
$735,032 in the year 2017. Moreover, the net cash used from investment activities decreased to
$-357,283 in the year 2016 from $-411,105 in the year 2015 and again increased to $-800,348 in
the year 2017. On the other hand, net cash flow from financing activities in the year 2015
amounted to $-262,919 which increased to $-589,826 in the year 2016 and again decreased to $-
135,020 in the year 2017.
Items of Other Comprehensive Income Statement
The comprehensive income statement of Caltex Australia Ltd consists of net profit which
had increased to $620,752m in the year 2017 from $610,480m in the year 2015. The items that
are involved in other comprehensive income statement are- foreign operations – foreign currency
translation differences, net change in fair value of net investment hedges, fair value change of
cash flow hedges (Higgins 2012). It also consists of net income tax on items which have been
mainly transferred to the income statement.
Analyzing each item of other comprehensive income statement
The difference in foreign currency translation increased to $29,577 min the year 2017
from $6698m in the year 2016. There has been increase in fair value of other comprehensive
income to $45,294m in the year 2017 from $893m in the year 2016. Income tax on the items
decreased to $2m in the year 2017 from $89 m in the year 2016. Furthermore, it also reflects that
the total of other comprehensive income increased drastically to $25,998m in the year 2017 from
$6753m in the year 2016.
⊘ This is a preview!⊘
Do you want full access?
Subscribe today to unlock all pages.
Trusted by 1+ million students worldwide
7CORPORATE ACCOUNTING
Causes for the items not reported in the income statement
It has been opined by Jagannath and Koller (2013) that, comprehensive income statement
is mainly used for measurement of change in owner’s interest in the business. It generally
incorporates income as well as expenditure which have not yet realized and is utilized for
bypassing income statement. In addition to this, other comprehensive income mainly considers
items that involve debt security on the unrealized profits and losses, changes in transactions of
foreign currency, profit or loss obtained from the derivative instruments and any other pension
profits or losses.
Explaining about Caltex’s income tax expenditure
The income tax expenditure declined to $242,694 m in the year 2017 from $253,283m in
the year 2016 as given in the company’s income statement. This tax was mainly calculated by
dividing income tax expenditure to profit before income tax expenses from continued as well as
discontinued operations (Henderson et al. 2015).
Verification of the tax being figure that is same as Caltex tax rate times the company’s
accounting income
The amount of income tax has been computed by using tax rates, which have been mainly
ratified significantly from the statement of company’s financial position (Kirkham 2013). The
present income tax expenditure amounted to around $253,283m in the year 2016 and $242,694m
in the year 2017 as given in the financial statement. This reflects that the income tax amount had
decreased considerably in the year 2017. Thus, it cannot be estimated that whether the income
tax expenditures figures are same as that of tax rate times this enterprise’s accounting income.
Paraphrase This Document
Need a fresh take? Get an instant paraphrase of this document with our AI Paraphraser
8CORPORATE ACCOUNTING
Deferred tax reported in balance sheet and reasons for record
Deferred tax is mainly estimated by the procedure of balance sheet asset that results from
primary differences between tax base of the assets as well as liabilities and its total carrying
amount as stated in the financial statements. Deferred tax asset refers to the asset given in the
enterprise balance sheet which might be utilized for reducing its taxable income. It relates to the
circumstances in which a particular business has mainly overpaid taxes or taxes that is paid in
advance on balance sheet. Deferred tax assets are generally identified to that extent in which the
availability of the taxable profit in future has been probable against basic differences which are
deductible. The deferred tax asset increased to around $244,073m in the year 2017 from the year
2016 that recorded to around $238,083m.
Income tax payable or current tax assets recorded by the firm
It has been highlighted in the company’s balance sheet that there is no record of current
income tax assets in the year 2017 while in the year 2016, the amount recorded to around $9524
m. The income tax asset refers to the amount which has been estimated based on the standard
accounting rules as well as the total amount of tax which has been owed by organization to the
tax authorities. In addition to this, income tax payable refers to the total amount which the
enterprise owes according to tax based on the tax code rules. It has been opined by () that, until
an enterprise makes payment of tax, the total amount of tax payable given on the balance sheet as
liability.
9CORPORATE ACCOUNTING
Verification of income tax expenditure given in income statement same as income tax paid
shown in cash flow statement
The income tax expenditure as shown in income statement is not the same as income tax
paid given in the cash flow statement. The income tax paid as shown in the cash flow statement
highlights that the amount paid in the year 2017 increased to around $239,389 from $13,595 in
the year 2016. Income tax payment involves the effect of income tax of specific profit or loss
relating to investment activities. On the contrary, income tax expenditure refers to the total
amount which represents cost of income tax. Therefore, the income tax expenditure shown in
income statement usually varies with income tax expenses as stated in the cash flow statement
(Pham, Suchard and Zein 2012). This is because of the fact that the total tax expenditure that the
company accounts for under income tax payable records to the total amount after accounting for
several expenses such as- administrative expenditure, operating expenditure, financing charges,
selling expenses and other expenses.
Unique Features in the financial statements and the new insights
From the Caltex Australian Ltd annual report, it can be recognized that the total amount
for income tax has been basically made based on the adjusted profits which are generally
attributable for non- assessable or disallowed items (Zadek, Evans. and Pruzan 2013). In addition
to this, the current income tax has been generally estimated by referencing recoverable amount
or the total amount of income tax payable with respect to the taxable profit or tax loss for that
specific accounting year. This has been usually estimated by applying tax laws as well as the tax
rates, which has been enacted at reporting date. Thus, it can be seen from the above discussion
that this enterprise has followed all the basic requirements of the Australian Tax Office (ATO)
while estimating different taxes that has been included in the company’s financial statement.
⊘ This is a preview!⊘
Do you want full access?
Subscribe today to unlock all pages.
Trusted by 1+ million students worldwide
10CORPORATE ACCOUNTING
References
Bodnar, G.H. and Hopwood, W.S., 2012. Accounting information systems. Upper Saddle River:
Pearson.
Brigham, E.F. and Houston, J.F., 2012. Fundamentals of financial management. Cengage
Learning.
Brown, R., 2012. Analysis of investments & management of portfolios.
Farshadfar, S. and Monem, R., 2013. Further evidence on the usefulness of direct method cash
flow components for forecasting future cash flows. The international journal of
accounting, 48(1), pp.111-133.
Henderson, S., Peirson, G., Herbohn, K. and Howieson, B., 2015. Issues in financial accounting.
Pearson Higher Education AU.
Higgins, R.C., 2012. Analysis for financial management. McGraw-Hill/Irwin.
Jagannath, A. and Koller, T., 2013. Building a better income statement. Mckinsey & Company.
November.
Kirkham, R., 2012. Liquidity analysis using cash flow ratios and traditional ratios: The
telecommunications sector in Australia. The Journal of New Business Ideas & Trends, 10(1), p.1.
Parker, R.H. ed., 2013. Accounting in Australia (RLE Accounting): Historical Essays (Vol. 58).
Routledge.
Pham, P.K., Suchard, J.A. and Zein, J., 2012. Corporate governance and the cost of capital:
Evidence from Australian companies. Journal of Applied Corporate Finance, 24(3), pp.84-93.
Paraphrase This Document
Need a fresh take? Get an instant paraphrase of this document with our AI Paraphraser

11CORPORATE ACCOUNTING
Zadek, S., Evans, R. and Pruzan, P., 2013. Building corporate accountability: Emerging practice
in social and ethical accounting and auditing. Routledge.
Zadek, S., Evans, R. and Pruzan, P., 2013. Building corporate accountability: Emerging practice
in social and ethical accounting and auditing. Routledge.
1 out of 11
Related Documents


Your All-in-One AI-Powered Toolkit for Academic Success.
+13062052269
info@desklib.com
Available 24*7 on WhatsApp / Email
![[object Object]](/_next/static/media/star-bottom.7253800d.svg)
Unlock your academic potential
Copyright © 2020–2026 A2Z Services. All Rights Reserved. Developed and managed by ZUCOL.