Comprehensive Financial Analysis of Caltex Australia Limited
VerifiedAdded on 2023/06/07
|13
|3278
|78
Report
AI Summary
This report provides a comprehensive financial analysis of Caltex Australia Limited, an ASX-listed company involved in manufacturing and selling petroleum products and operating convenience stores. The analysis utilizes ratio analysis to assess the company's financial performance, focusing on profitability and liquidity for 2017 and 2016. The report reveals a satisfactory but weakened liquidity position in 2017, attributed to reduced current and quick assets. Profitability declined due to increased operating expenses and inefficient asset utilization. The study also reviews Caltex's corporate governance statement, highlighting compliance with ASX principles and the Australian Corporations Act, 2001, while also pointing out ethical issues like wage fraud. The analysis includes calculations and interpretations of key ratios such as current ratio, quick ratio, cash ratio, return on assets, return on equity, net profit margin, gross profit margin, and earnings per share, offering insights into Caltex's financial health and performance trends.
Caltex Australia Limited 0
FINANCIAL ANALYSIS
Caltex Australia Limited
FINANCIAL ANALYSIS
Caltex Australia Limited
Paraphrase This Document
Need a fresh take? Get an instant paraphrase of this document with our AI Paraphraser
Caltex Australia Limited 1
Abstract:
This report is prepared to analyse the financial performance of Caltex Australia Limited
which is an ASX listed company engaged in the business of manufacturing and selling the
petroleum products and running the convenience stores across the country. The financial
performance of the Caltex Limited is analysed using the ratio analysis technique. It has been
observed that liquidity position of the company in 2017 is satisfactory but it has weakened as
compared to 2016 due to limited availability of current assets especially the quick assets.
Also, there is a decline in the level of profitability of Caltex in 2017 because of increased
operating expenses and excessive investments in the total assets which could not be ideally
utilised in the business and hence remained idle throughout the year 2017. Further, the
corporate governance statement of Caltex was studied and it was found that company is
voluntarily disclosing the non-financial information related to it through the issuance of said
statement. The company is duly complying with the ASX principles and recommendations
for corporate governance along with the provisions of Australian Corporations Act, 2001.
Even though Caltex is maintaining corporate governance structure, there has been identified
some ethical issues on part of company’s management such as wage fraud where the Caltex
has been accused for underpaying to its employees.
Caltex Australia Limited 2
Introduction:
Ratio analysis is the important technique of financial management which is used to analyse
the financial information of the company. In the present report, the technique of ratio analysis
is applied to the financial statements of Caltex Ltd to assess its financial performance in
terms of profitability and liquidity.
Part a
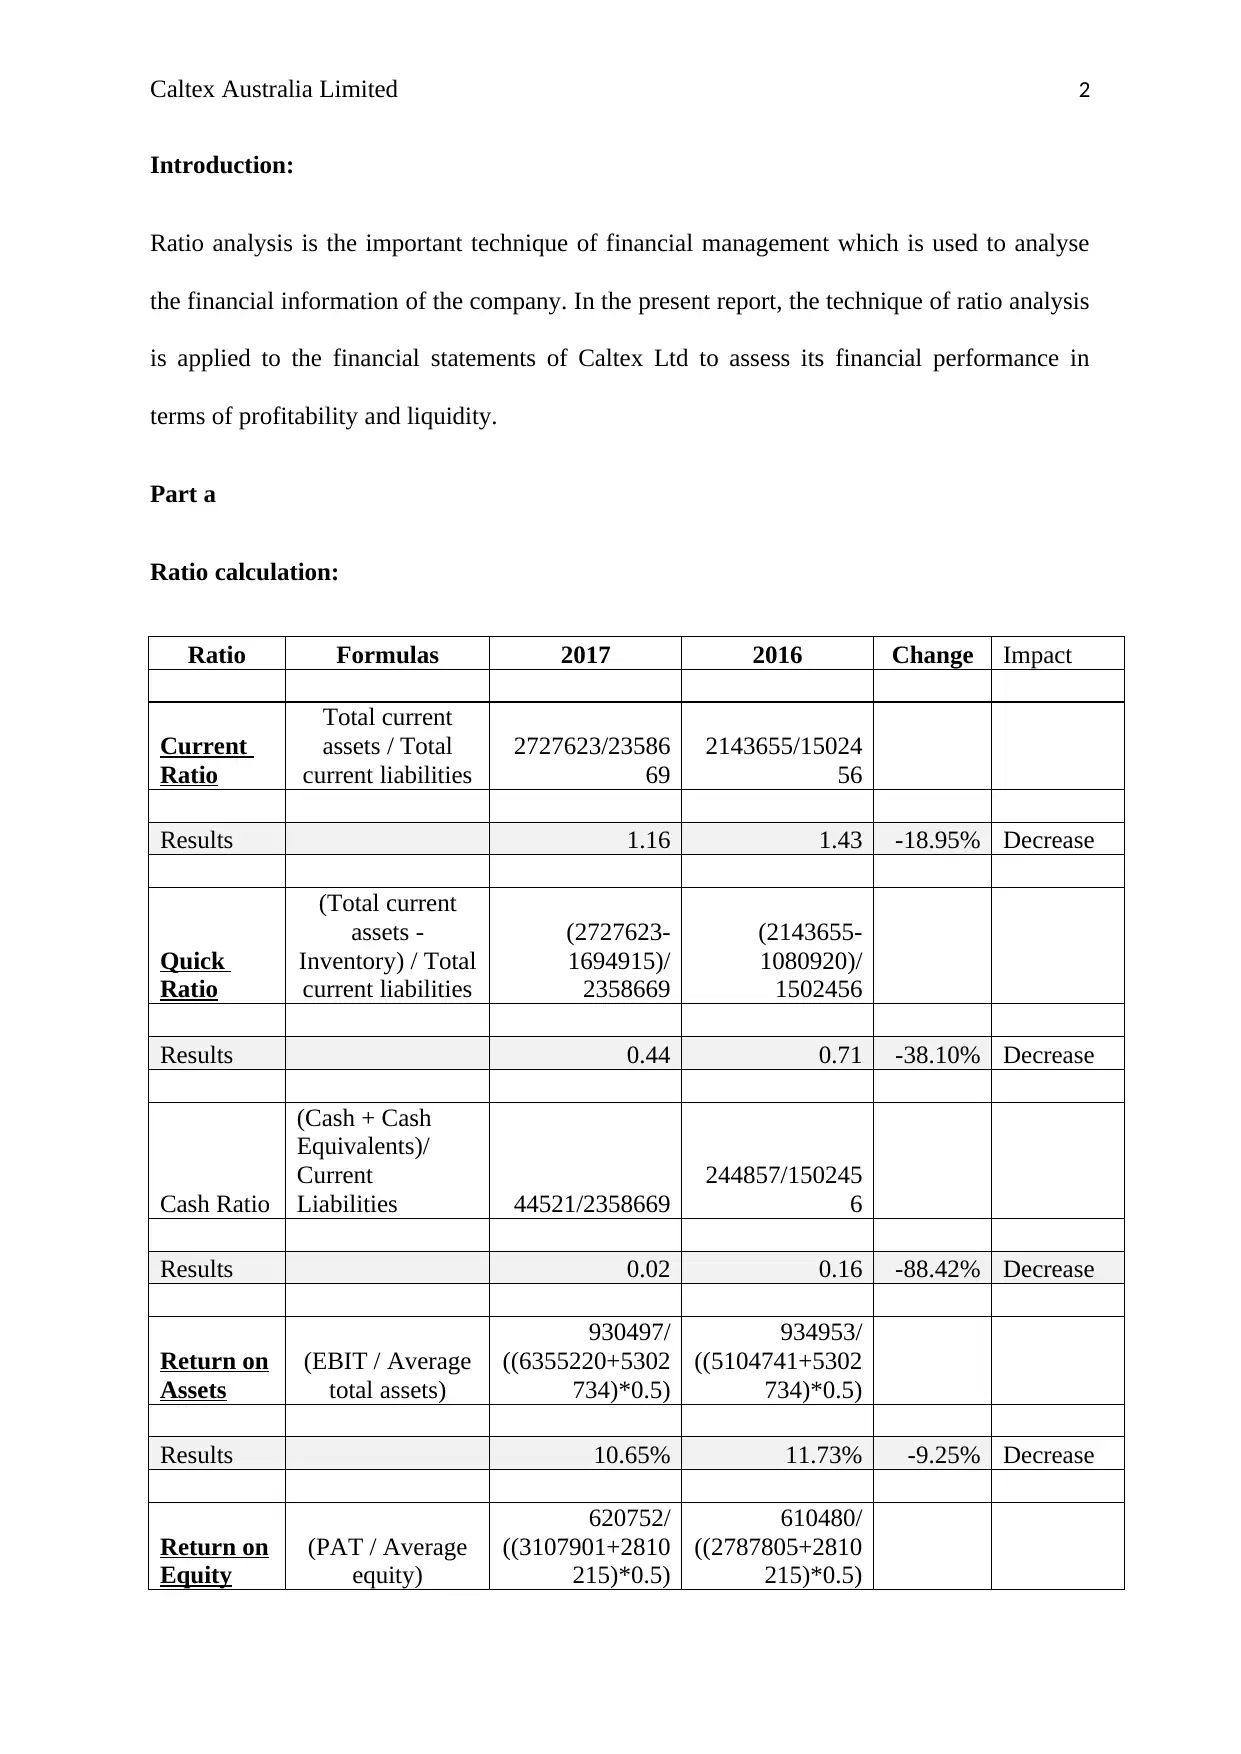
Ratio calculation:
Ratio Formulas 2017 2016 Change Impact
Current
Ratio
Total current
assets / Total
current liabilities
2727623/23586
69
2143655/15024
56
Results 1.16 1.43 -18.95% Decrease
Quick
Ratio
(Total current
assets -
Inventory) / Total
current liabilities
(2727623-
1694915)/
2358669
(2143655-
1080920)/
1502456
Results 0.44 0.71 -38.10% Decrease
Cash Ratio
(Cash + Cash
Equivalents)/
Current
Liabilities 44521/2358669
244857/150245
6
Results 0.02 0.16 -88.42% Decrease
Return on
Assets
(EBIT / Average
total assets)
930497/
((6355220+5302
734)*0.5)
934953/
((5104741+5302
734)*0.5)
Results 10.65% 11.73% -9.25% Decrease
Return on
Equity
(PAT / Average
equity)
620752/
((3107901+2810
215)*0.5)
610480/
((2787805+2810
215)*0.5)
Introduction:
Ratio analysis is the important technique of financial management which is used to analyse
the financial information of the company. In the present report, the technique of ratio analysis
is applied to the financial statements of Caltex Ltd to assess its financial performance in
terms of profitability and liquidity.
Part a
Ratio calculation:
Ratio Formulas 2017 2016 Change Impact
Current
Ratio
Total current
assets / Total
current liabilities
2727623/23586
69
2143655/15024
56
Results 1.16 1.43 -18.95% Decrease
Quick
Ratio
(Total current
assets -
Inventory) / Total
current liabilities
(2727623-
1694915)/
2358669
(2143655-
1080920)/
1502456
Results 0.44 0.71 -38.10% Decrease
Cash Ratio
(Cash + Cash
Equivalents)/
Current
Liabilities 44521/2358669
244857/150245
6
Results 0.02 0.16 -88.42% Decrease
Return on
Assets
(EBIT / Average
total assets)
930497/
((6355220+5302
734)*0.5)
934953/
((5104741+5302
734)*0.5)
Results 10.65% 11.73% -9.25% Decrease
Return on
Equity
(PAT / Average
equity)
620752/
((3107901+2810
215)*0.5)
610480/
((2787805+2810
215)*0.5)
⊘ This is a preview!⊘
Do you want full access?
Subscribe today to unlock all pages.
Trusted by 1+ million students worldwide
Caltex Australia Limited 3
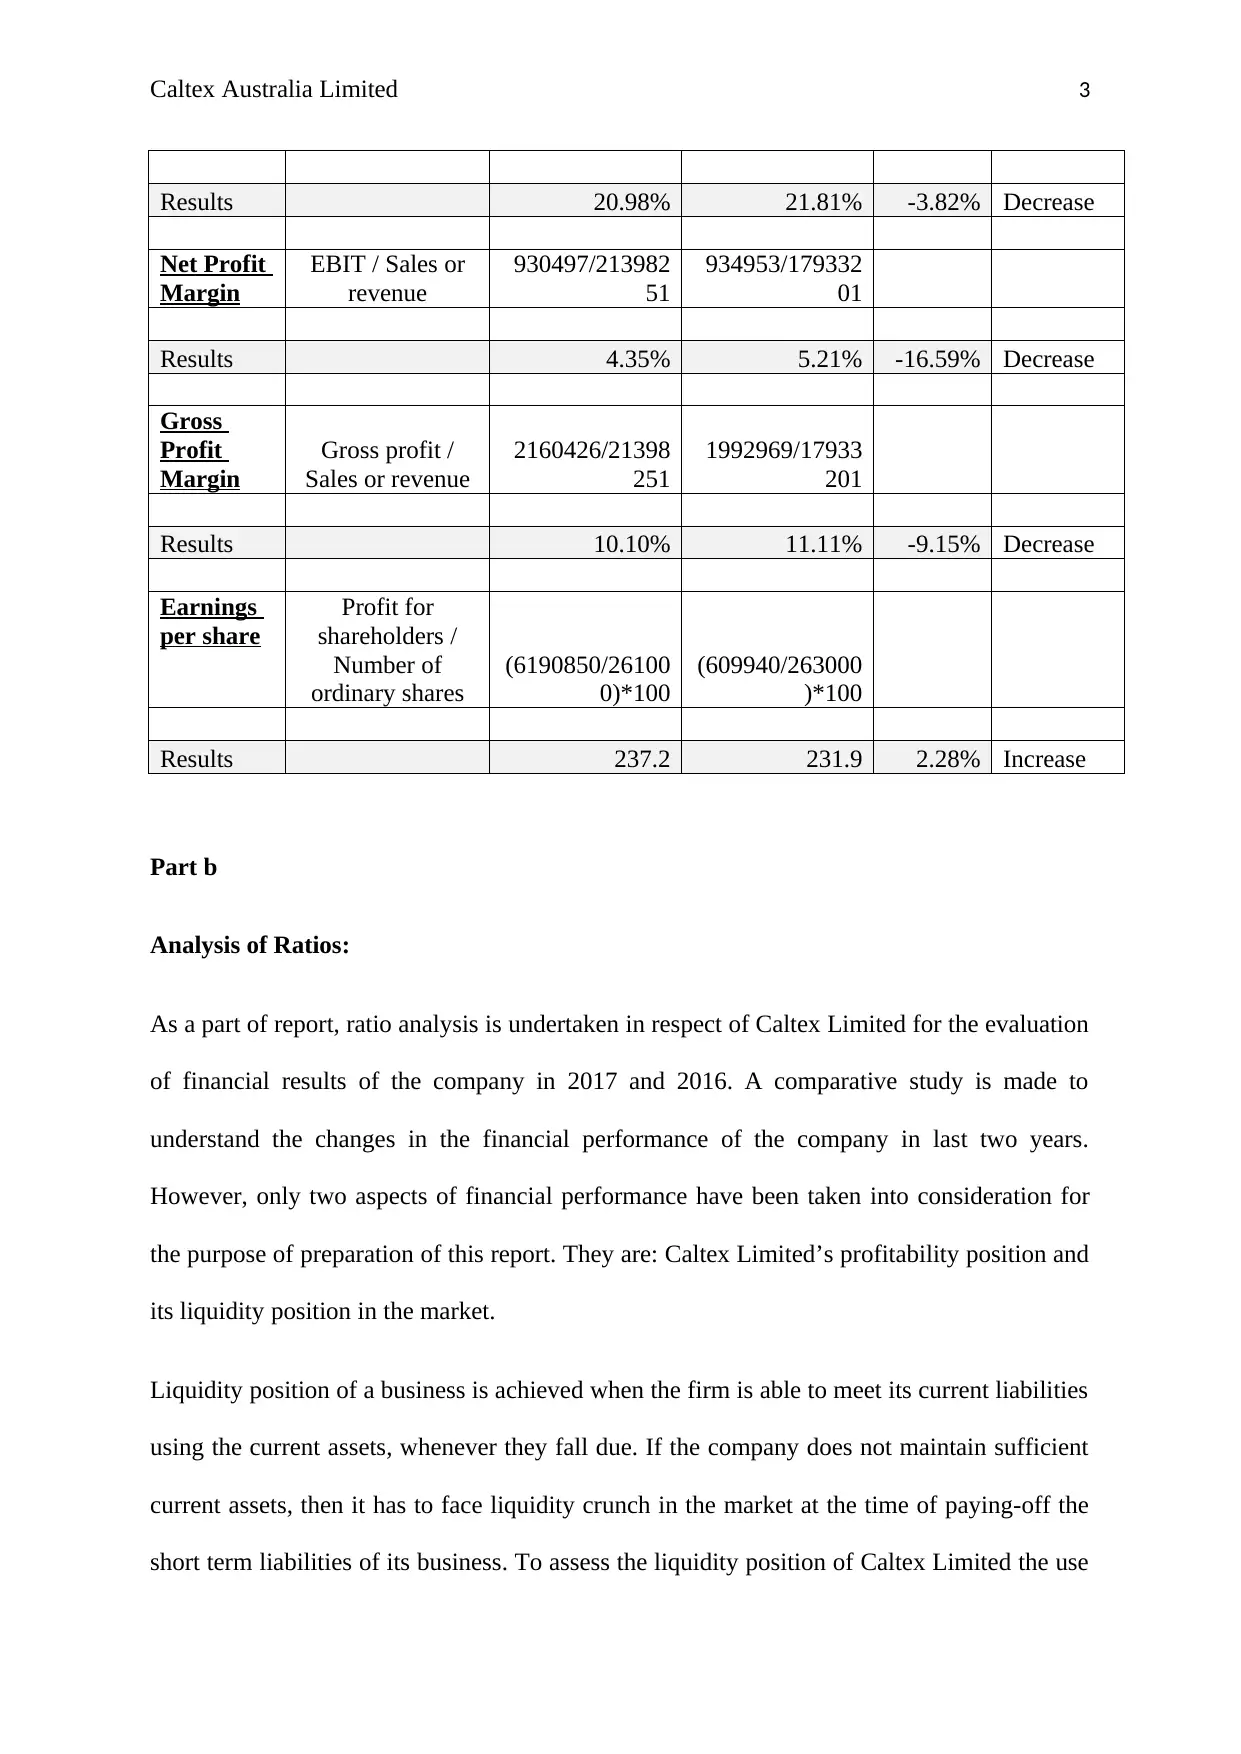
Results 20.98% 21.81% -3.82% Decrease
Net Profit
Margin
EBIT / Sales or
revenue
930497/213982
51
934953/179332
01
Results 4.35% 5.21% -16.59% Decrease
Gross
Profit
Margin
Gross profit /
Sales or revenue
2160426/21398
251
1992969/17933
201
Results 10.10% 11.11% -9.15% Decrease
Earnings
per share
Profit for
shareholders /
Number of
ordinary shares
(6190850/26100
0)*100
(609940/263000
)*100
Results 237.2 231.9 2.28% Increase
Part b
Analysis of Ratios:
As a part of report, ratio analysis is undertaken in respect of Caltex Limited for the evaluation
of financial results of the company in 2017 and 2016. A comparative study is made to
understand the changes in the financial performance of the company in last two years.
However, only two aspects of financial performance have been taken into consideration for
the purpose of preparation of this report. They are: Caltex Limited’s profitability position and
its liquidity position in the market.
Liquidity position of a business is achieved when the firm is able to meet its current liabilities
using the current assets, whenever they fall due. If the company does not maintain sufficient
current assets, then it has to face liquidity crunch in the market at the time of paying-off the
short term liabilities of its business. To assess the liquidity position of Caltex Limited the use
Paraphrase This Document
Need a fresh take? Get an instant paraphrase of this document with our AI Paraphraser
Caltex Australia Limited 4
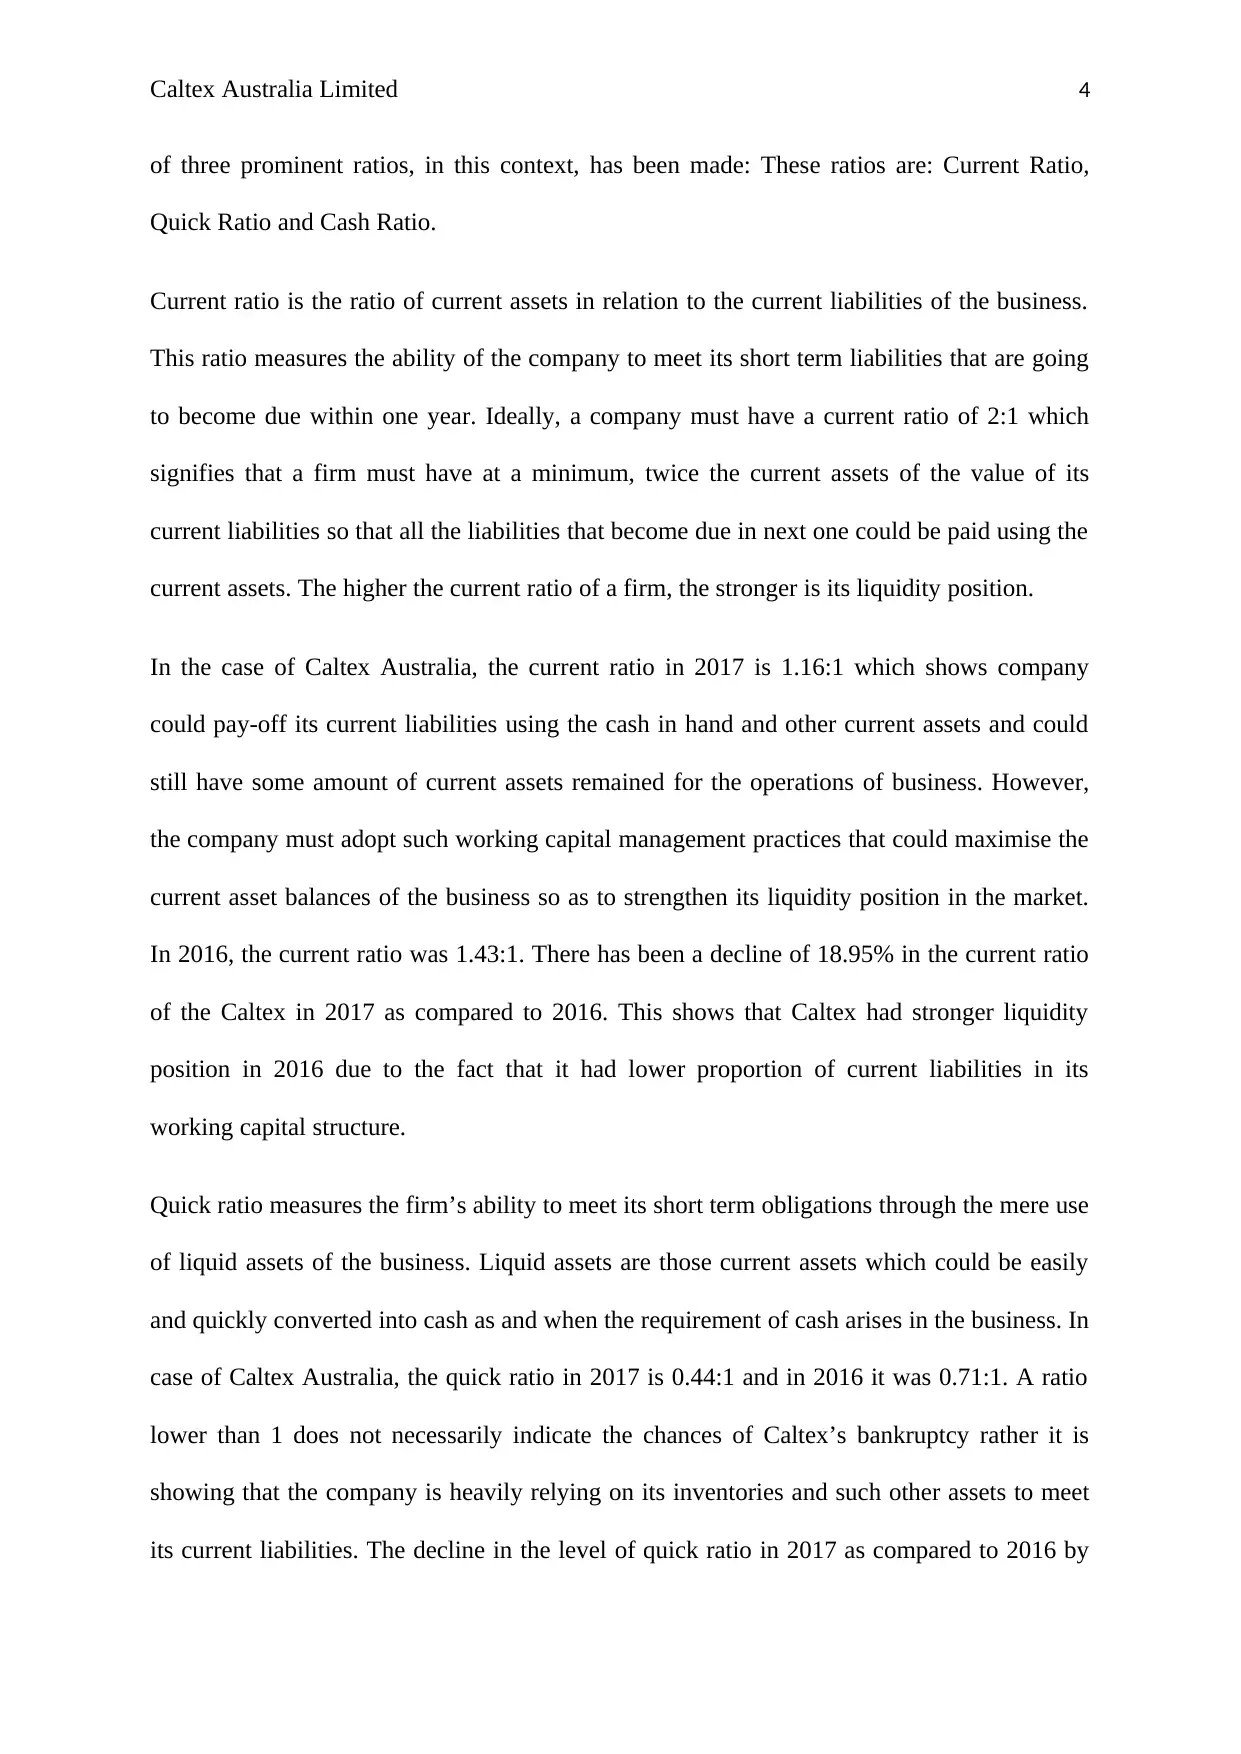
of three prominent ratios, in this context, has been made: These ratios are: Current Ratio,
Quick Ratio and Cash Ratio.
Current ratio is the ratio of current assets in relation to the current liabilities of the business.
This ratio measures the ability of the company to meet its short term liabilities that are going
to become due within one year. Ideally, a company must have a current ratio of 2:1 which
signifies that a firm must have at a minimum, twice the current assets of the value of its
current liabilities so that all the liabilities that become due in next one could be paid using the
current assets. The higher the current ratio of a firm, the stronger is its liquidity position.
In the case of Caltex Australia, the current ratio in 2017 is 1.16:1 which shows company
could pay-off its current liabilities using the cash in hand and other current assets and could
still have some amount of current assets remained for the operations of business. However,
the company must adopt such working capital management practices that could maximise the
current asset balances of the business so as to strengthen its liquidity position in the market.
In 2016, the current ratio was 1.43:1. There has been a decline of 18.95% in the current ratio
of the Caltex in 2017 as compared to 2016. This shows that Caltex had stronger liquidity
position in 2016 due to the fact that it had lower proportion of current liabilities in its
working capital structure.
Quick ratio measures the firm’s ability to meet its short term obligations through the mere use
of liquid assets of the business. Liquid assets are those current assets which could be easily
and quickly converted into cash as and when the requirement of cash arises in the business. In
case of Caltex Australia, the quick ratio in 2017 is 0.44:1 and in 2016 it was 0.71:1. A ratio
lower than 1 does not necessarily indicate the chances of Caltex’s bankruptcy rather it is
showing that the company is heavily relying on its inventories and such other assets to meet
its current liabilities. The decline in the level of quick ratio in 2017 as compared to 2016 by
Caltex Australia Limited 5
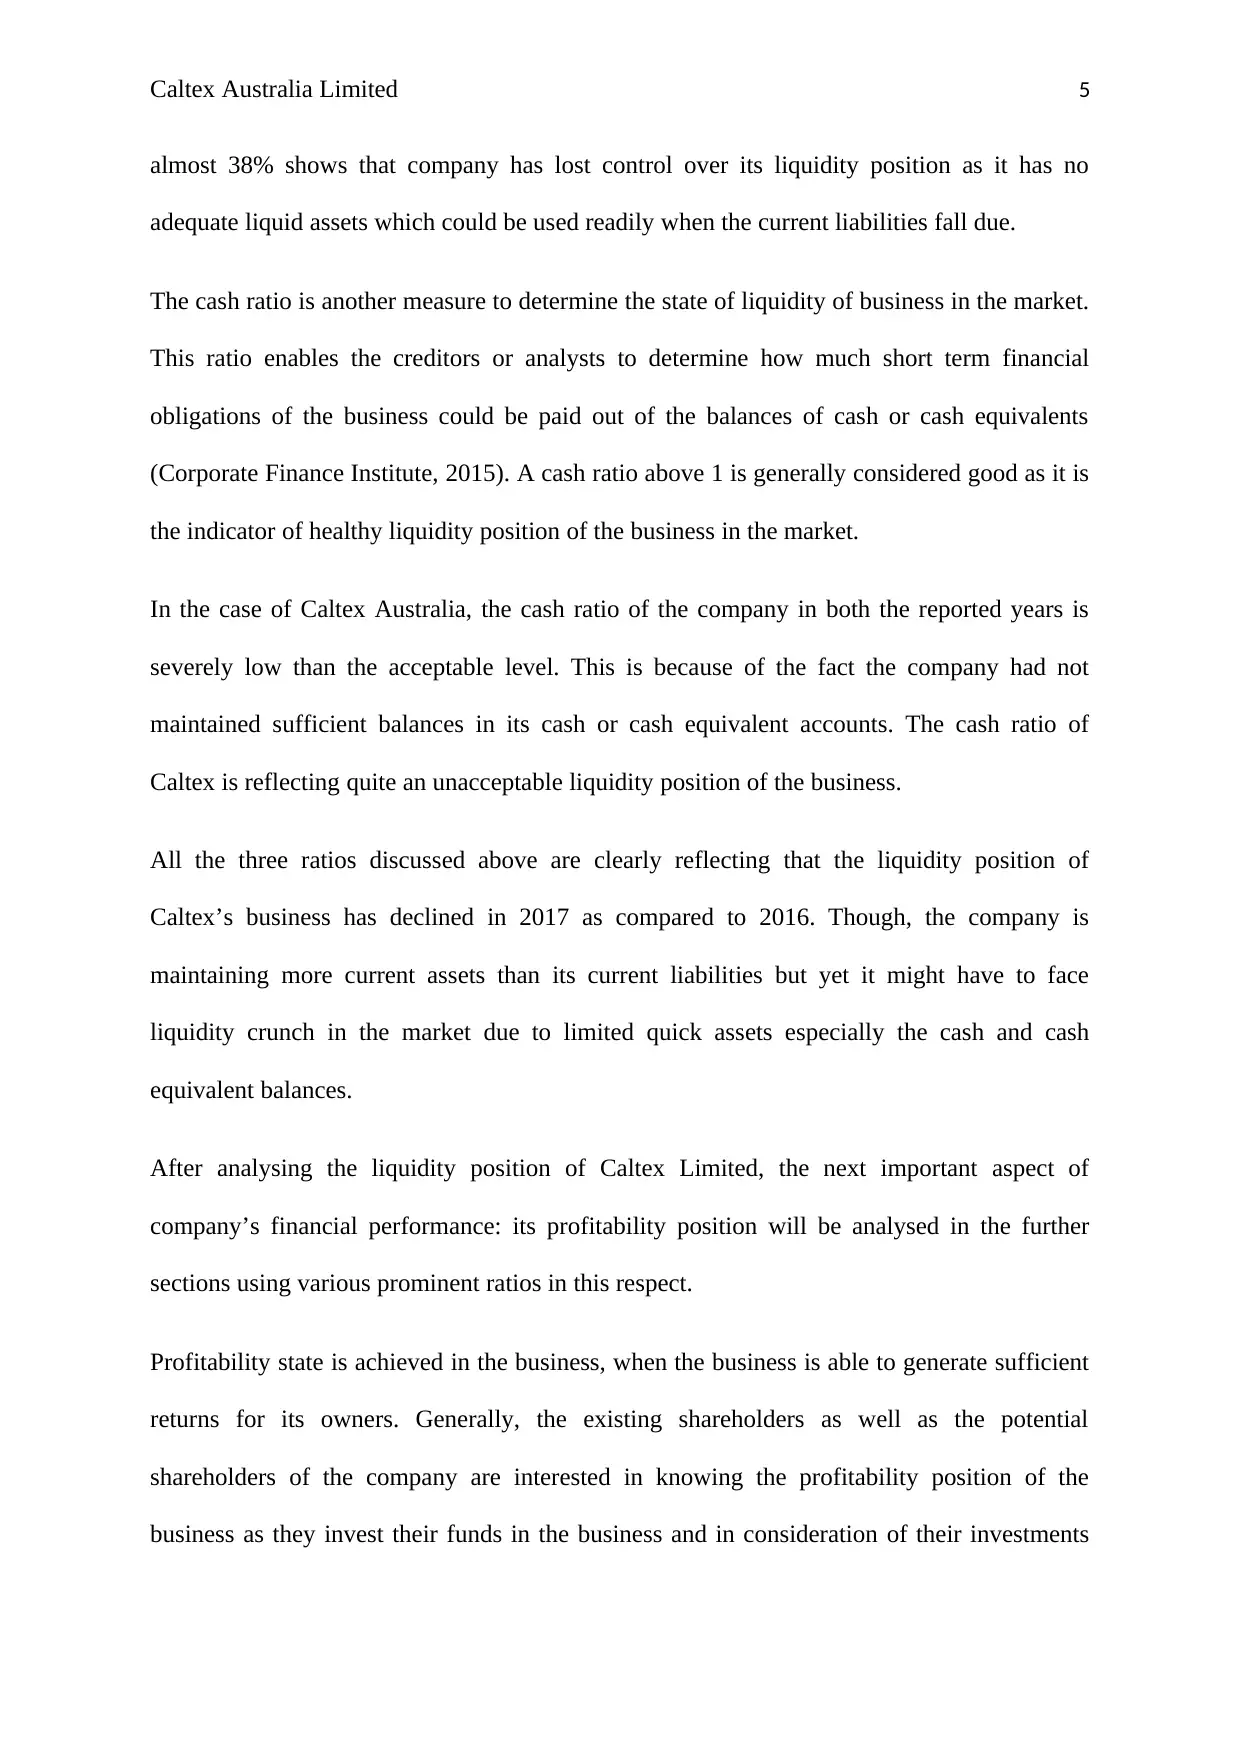
almost 38% shows that company has lost control over its liquidity position as it has no
adequate liquid assets which could be used readily when the current liabilities fall due.
The cash ratio is another measure to determine the state of liquidity of business in the market.
This ratio enables the creditors or analysts to determine how much short term financial
obligations of the business could be paid out of the balances of cash or cash equivalents
(Corporate Finance Institute, 2015). A cash ratio above 1 is generally considered good as it is
the indicator of healthy liquidity position of the business in the market.
In the case of Caltex Australia, the cash ratio of the company in both the reported years is
severely low than the acceptable level. This is because of the fact the company had not
maintained sufficient balances in its cash or cash equivalent accounts. The cash ratio of
Caltex is reflecting quite an unacceptable liquidity position of the business.
All the three ratios discussed above are clearly reflecting that the liquidity position of
Caltex’s business has declined in 2017 as compared to 2016. Though, the company is
maintaining more current assets than its current liabilities but yet it might have to face
liquidity crunch in the market due to limited quick assets especially the cash and cash
equivalent balances.
After analysing the liquidity position of Caltex Limited, the next important aspect of
company’s financial performance: its profitability position will be analysed in the further
sections using various prominent ratios in this respect.
Profitability state is achieved in the business, when the business is able to generate sufficient
returns for its owners. Generally, the existing shareholders as well as the potential
shareholders of the company are interested in knowing the profitability position of the
business as they invest their funds in the business and in consideration of their investments
⊘ This is a preview!⊘
Do you want full access?
Subscribe today to unlock all pages.
Trusted by 1+ million students worldwide
Caltex Australia Limited 6
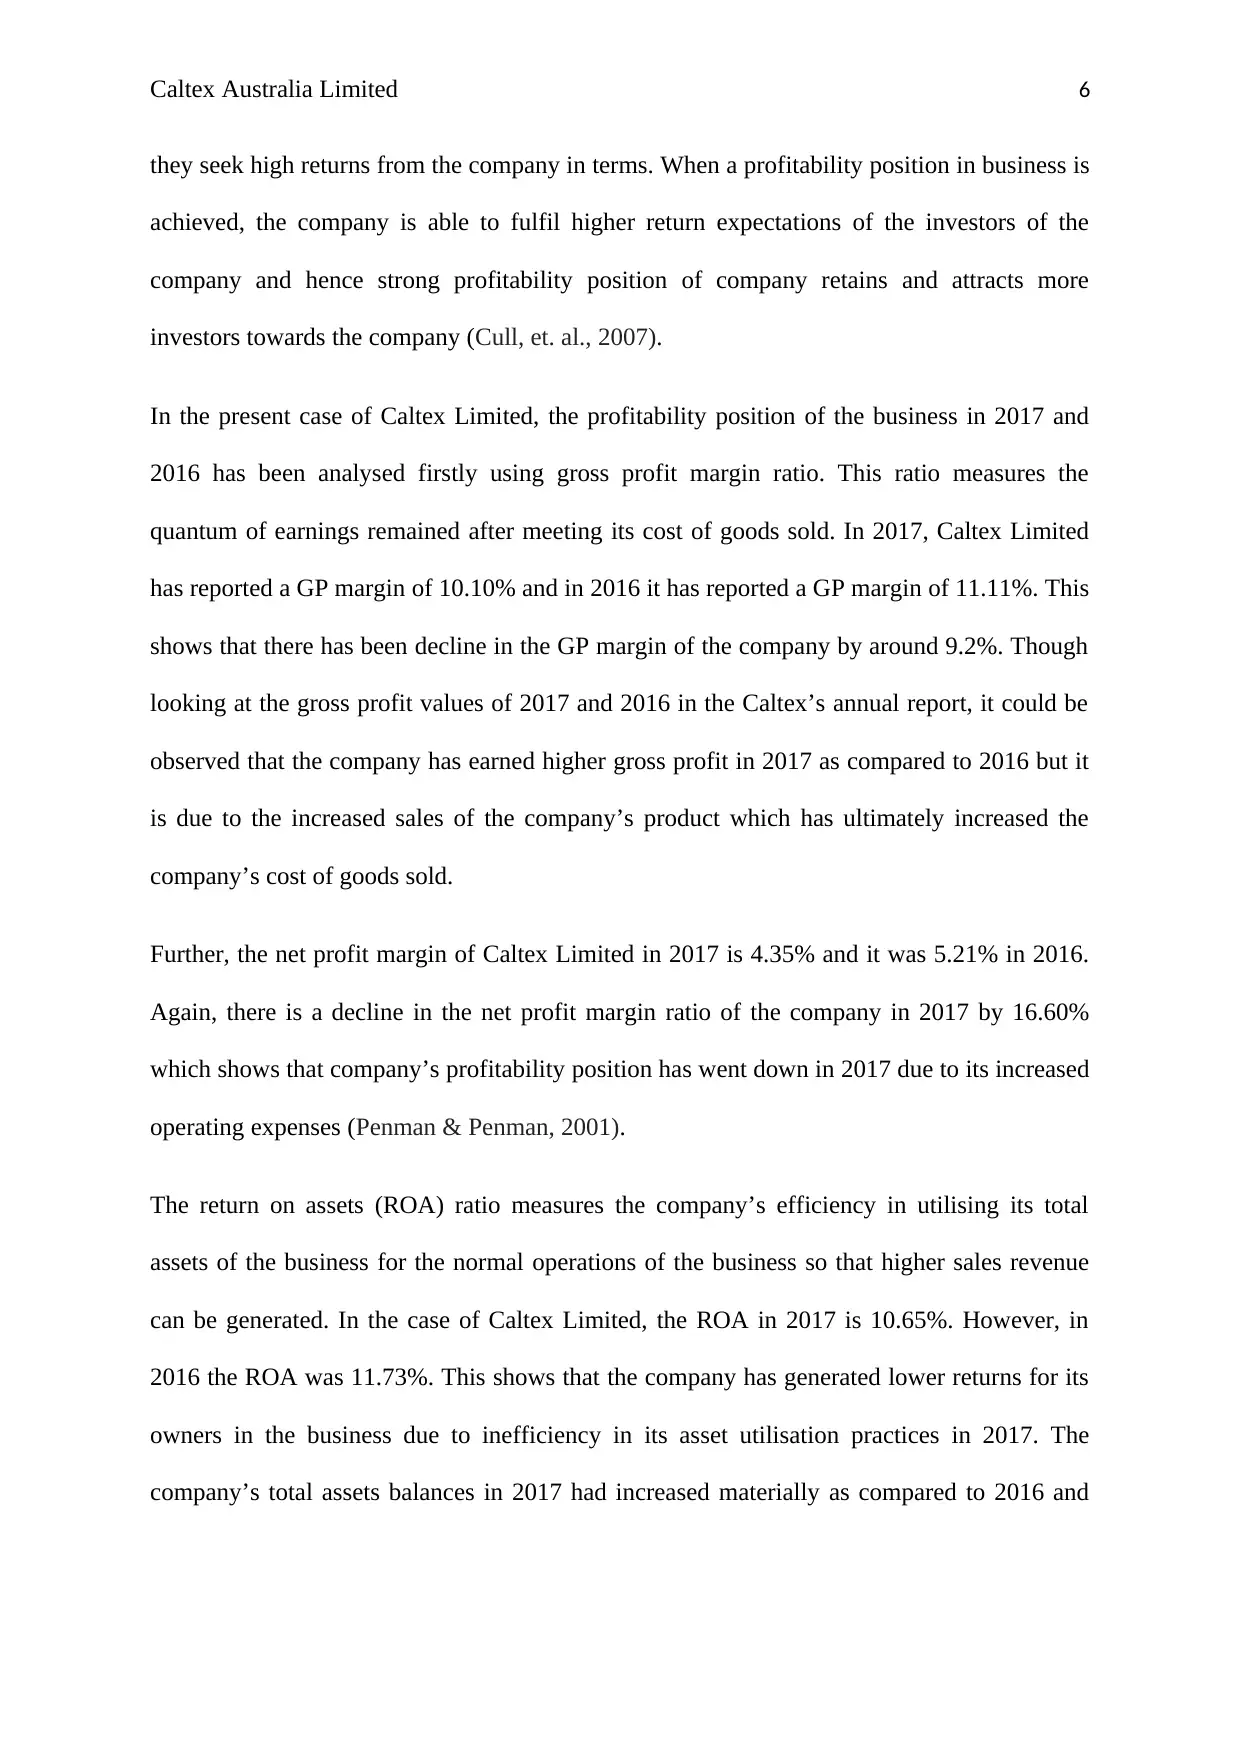
they seek high returns from the company in terms. When a profitability position in business is
achieved, the company is able to fulfil higher return expectations of the investors of the
company and hence strong profitability position of company retains and attracts more
investors towards the company (Cull, et. al., 2007).
In the present case of Caltex Limited, the profitability position of the business in 2017 and
2016 has been analysed firstly using gross profit margin ratio. This ratio measures the
quantum of earnings remained after meeting its cost of goods sold. In 2017, Caltex Limited
has reported a GP margin of 10.10% and in 2016 it has reported a GP margin of 11.11%. This
shows that there has been decline in the GP margin of the company by around 9.2%. Though
looking at the gross profit values of 2017 and 2016 in the Caltex’s annual report, it could be
observed that the company has earned higher gross profit in 2017 as compared to 2016 but it
is due to the increased sales of the company’s product which has ultimately increased the
company’s cost of goods sold.
Further, the net profit margin of Caltex Limited in 2017 is 4.35% and it was 5.21% in 2016.
Again, there is a decline in the net profit margin ratio of the company in 2017 by 16.60%
which shows that company’s profitability position has went down in 2017 due to its increased
operating expenses (Penman & Penman, 2001).
The return on assets (ROA) ratio measures the company’s efficiency in utilising its total
assets of the business for the normal operations of the business so that higher sales revenue
can be generated. In the case of Caltex Limited, the ROA in 2017 is 10.65%. However, in
2016 the ROA was 11.73%. This shows that the company has generated lower returns for its
owners in the business due to inefficiency in its asset utilisation practices in 2017. The
company’s total assets balances in 2017 had increased materially as compared to 2016 and
Paraphrase This Document
Need a fresh take? Get an instant paraphrase of this document with our AI Paraphraser
Caltex Australia Limited 7
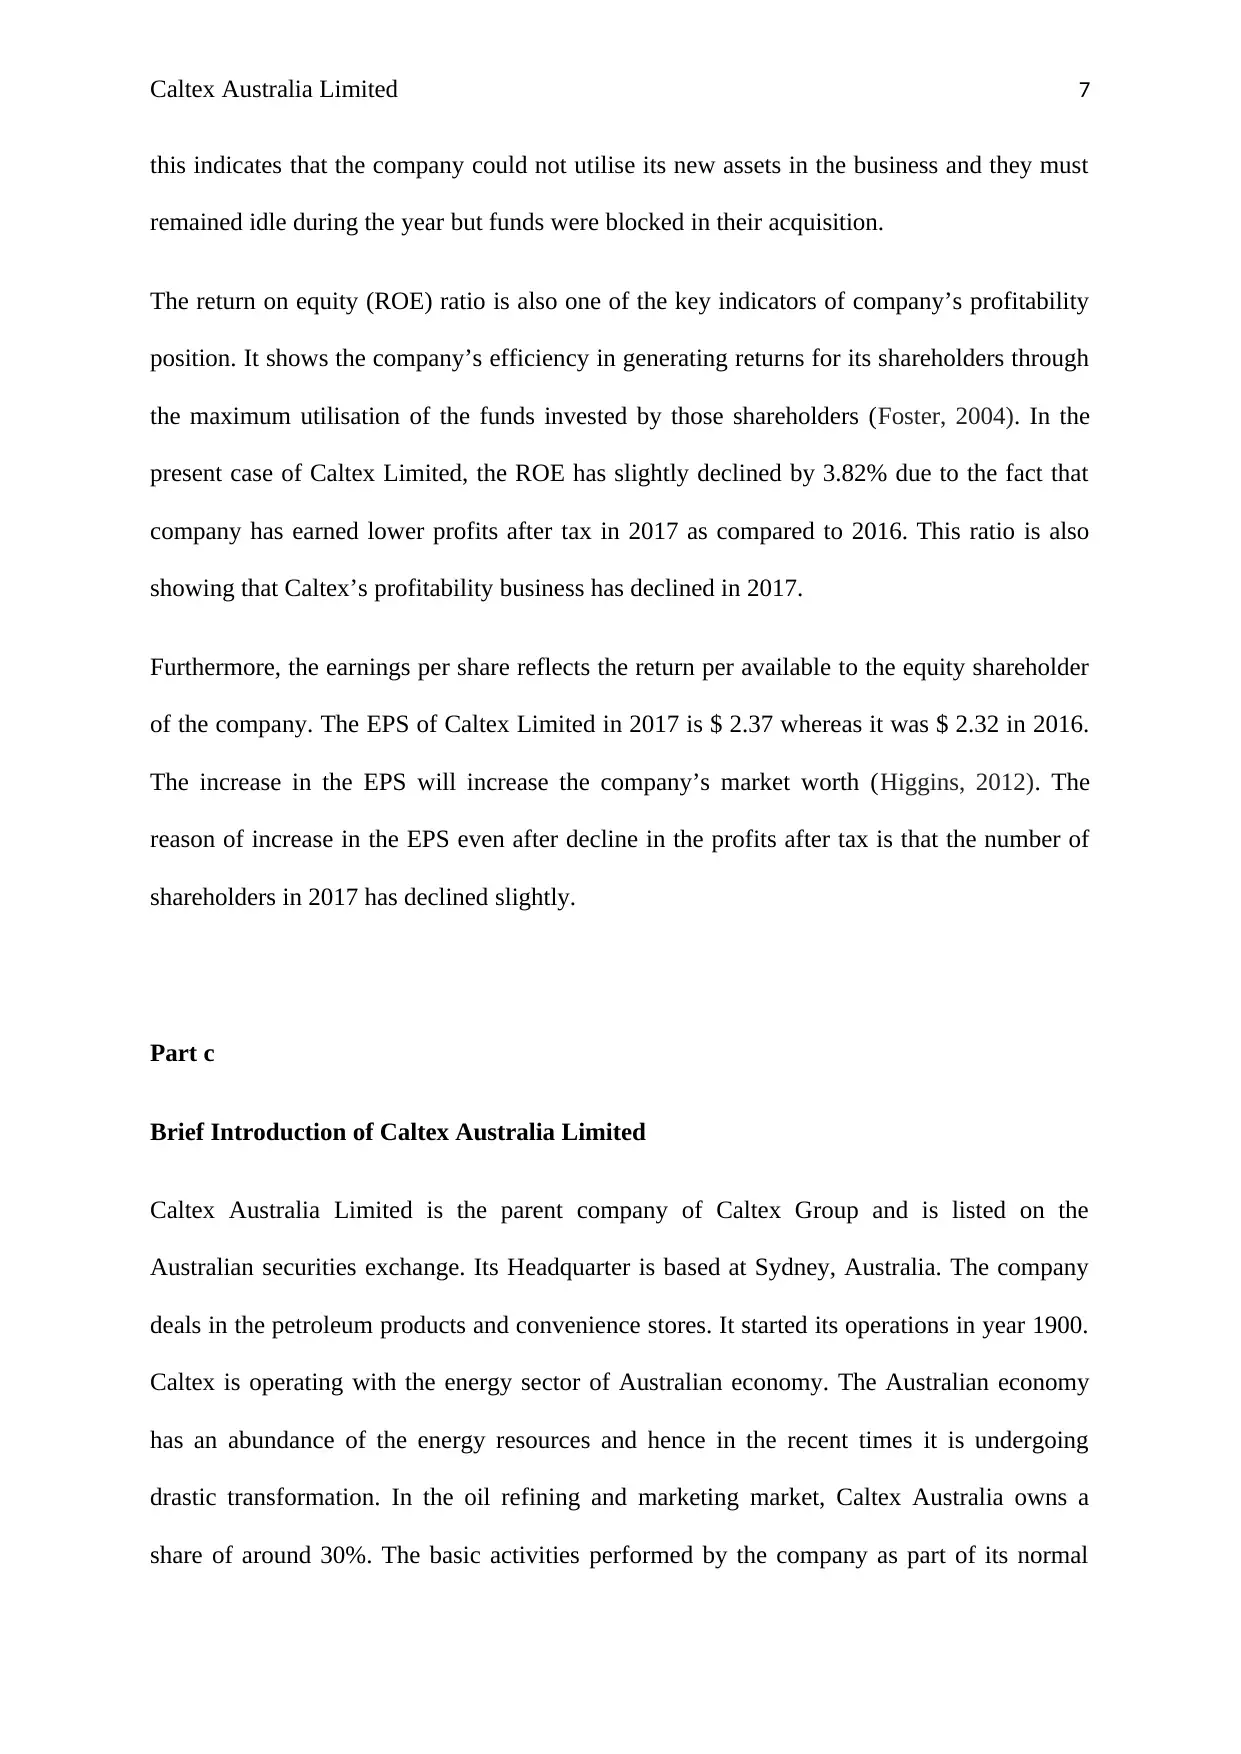
this indicates that the company could not utilise its new assets in the business and they must
remained idle during the year but funds were blocked in their acquisition.
The return on equity (ROE) ratio is also one of the key indicators of company’s profitability
position. It shows the company’s efficiency in generating returns for its shareholders through
the maximum utilisation of the funds invested by those shareholders (Foster, 2004). In the
present case of Caltex Limited, the ROE has slightly declined by 3.82% due to the fact that
company has earned lower profits after tax in 2017 as compared to 2016. This ratio is also
showing that Caltex’s profitability business has declined in 2017.
Furthermore, the earnings per share reflects the return per available to the equity shareholder
of the company. The EPS of Caltex Limited in 2017 is $ 2.37 whereas it was $ 2.32 in 2016.
The increase in the EPS will increase the company’s market worth (Higgins, 2012). The
reason of increase in the EPS even after decline in the profits after tax is that the number of
shareholders in 2017 has declined slightly.
Part c
Brief Introduction of Caltex Australia Limited
Caltex Australia Limited is the parent company of Caltex Group and is listed on the
Australian securities exchange. Its Headquarter is based at Sydney, Australia. The company
deals in the petroleum products and convenience stores. It started its operations in year 1900.
Caltex is operating with the energy sector of Australian economy. The Australian economy
has an abundance of the energy resources and hence in the recent times it is undergoing
drastic transformation. In the oil refining and marketing market, Caltex Australia owns a
share of around 30%. The basic activities performed by the company as part of its normal
Caltex Australia Limited 8
business operations are refinement, distribution and selling of various petroleum products in
mainly three countries: Australia New Zealand and Singapore. Caltex is presently operating
through its two segments: Supply & Marketing Segment and Lytton Segment (Bloomberg,
2018). The former segment is involved in the selling of fuels and lubricants, various
speciality products and the goods of convenience stores both within the country and in the
overseas market through the network of around 2000 Caltex and Amphol brand gas stations.
The distribution of the products under this segment is done through different channels such as
depots, pipelines, transportation fleet etc. The basic functioning of Lytton segment involves
refining of crude oil into variety of petroleum products such as fuel, diesel, greases and
speciality products such as liquefied petroleum gases. In 2015, Caltex has acquired 50% of
the total stake of Chevron Inc. This segment has performed strongly and contributed to the
financial performance of the company in 2017. The company has earned a total of profit after
tax of $ 619 million during the financial year 2017. The major competitors of Caltex Limited
are: Exxon Mobil Corporation, Royal Dutch Shell Plc., BP P.L.C, Ford Motors Company,
Cenovus Energy and Mazda Motor Corporation (D&B Hoovers, 2018) (Datafox, 2018).
Part 4
Corporate governance statement of Caltex Australia Limited
The board of directors of Caltex Australia is committed to highly strong corporate
governance standards as per its corporate governance statement for 2017. The statement of
corporate governance of Caltex Limited summarises all its practices, undertaken during the
financial year 2017, in the areas of corporate governance. It also includes those practices
which are undertaken by the company in compliance with the Principles and
Recommendations of council of ASX Corporate Governance. The said statement is signed-
off by the Board of the company (Caltex Australia, 2017).
⊘ This is a preview!⊘
Do you want full access?
Subscribe today to unlock all pages.
Trusted by 1+ million students worldwide
Caltex Australia Limited 9
As per the corporate governance statement issued by its Board as on 21st March, 2018, the
company has adhered to all the ASX principles. The statement shows that company had 7
directors at its Board out of which 6 were independent, non-executive and MD and CEO of
Caltex and one was the chairman who was also independent (Caltex Australia, 2017).
Further, the company has various committees to oversee the functions of company in
different areas. These committees are: Nomination Committee, Audit Committee, Human
Resource Committee and OHS $ Environmental Risk Management Committee (Caltex
Australia, 2017).
Board at Caltex reviews its risk management system on at-least annual basis to check its
appropriateness. Further, the board is entrusted with the duty of meeting its social economic
and environmental duties (Caltex Australia, 2017).
At Caltex, the board embraces large belief in maintaining the diversity at the workplace to
promote gender equality. It has also been awarded for its gender equality initiatives. The
female representation in 2017 is reported at 42% and it was 29% in 2016. Also, the company
has strong two-way communication structure for its investors so as to protect their interests
(Caltex Australia, 2017).
Recently, Caltex was accused of underpaying its service station operators and other
employees. The Fairfax media investigation into Caltex’s work culture, had revealed that the
company is exploiting its employees across its service networks by pressurising them to work
overtime with even half of the legal pay rates. Also, the company could not take any
appropriate action for the suspicions of wage fraud. The central franchisee model of the
company is found to be flawed to a significant extent. These practices are not in line with
desired ethical behaviour on part of Caltex (Ferguson & Christodoulou, 2016)
Paraphrase This Document
Need a fresh take? Get an instant paraphrase of this document with our AI Paraphraser
Caltex Australia Limited 10
Part 5
Conclusion:
All the three ratios discussed above are clearly reflecting that the liquidity position of
Caltex’s business has declined in 2017 as compared to 2016. Though, the company is
maintaining more current assets than its current liabilities but yet it might have to face
liquidity crunch in the market due to limited availability of quick assets particularly the cash
and cash equivalent balances. Further, the profitability position of Caltex is also declined in
2017 as compared to 2016 and it has been analysed from various different angles. Therefore,
it can be the overall financial performance of the company has weakened in 2017. However,
after reviewing the corporate governance statement of Caltex, it could be said that it is
effectively complying with the good corporate governance principles but not in the areas of
protection of its labour rights. The ethical issue that Caltex has recently been faced in 2016
signifies that company is not ethically behaving with its employees.
Caltex Australia Limited 11
References:
Caltex Australia, 2017. Corporate governance structure. Available at:
https://www.caltex.com.au/our-company/ investor-centre/corporate-governance Accessed on
220.9.2018.
Bloomberg, 2018. Company Overview of Caltex Australia Limited. Available:
https://www.bloomberg.com/research/stocks/private/snapshot.asp?privcapId=877088
Accessed on 220.9.2018.
D&B Hoovers, 2018. Caltex Australia Limited. Available:
http://www.hoovers.com/company-information/cs/company-
profile.caltex_australia_limited.3210fd7b064fe735.html Accessed on 220.9.2018.
Datafox, 2018. Caltex Australia Competitors. Available: https://datafox.com/caltex-australia
Accessed on 220.9.2018.
Cull, R., Demirgu¨ ç‐Kunt, A. and Morduch, J., 2007. Financial performance and outreach: A
global analysis of leading microbanks. The Economic Journal, 117(517), pp.F107-F133.
Foster, G., 2004. Financial Statement Analysis, 2/e. Pearson Education India.
Higgins, R.C., 2012. Analysis for financial management. McGraw-Hill/Irwin.
Penman, S.H. and Penman, S.H., 2001. Financial statement analysis and security valuation.
New York, NY: McGraw-Hill/Irwin.
Wall Street Mojo, 2018. Current Ratio v/s Quick Ratio. Available:
https://www.wallstreetmojo.com/current-ratio-vs-quick-ratio/ Accessed on 220.9.2018.
⊘ This is a preview!⊘
Do you want full access?
Subscribe today to unlock all pages.
Trusted by 1+ million students worldwide
1 out of 13
Related Documents


Your All-in-One AI-Powered Toolkit for Academic Success.
+13062052269
info@desklib.com
Available 24*7 on WhatsApp / Email
![[object Object]](/_next/static/media/star-bottom.7253800d.svg)
Unlock your academic potential
Copyright © 2020–2026 A2Z Services. All Rights Reserved. Developed and managed by ZUCOL.