Detailed Financial Analysis of Caltex Australia for HI5002 Finance
VerifiedAdded on 2022/11/14
|23
|3898
|463
Report
AI Summary
This report presents a detailed financial analysis of Caltex Australia, an ASX-listed company, examining its performance using ratio analysis, cash management assessment, sensitivity analysis, and risk identification (systematic and unsystematic). The analysis includes profitability ratios (operating profit, net profit, and return on equity) and operating efficiency ratios (inventory turnover, account receivable turnover, and asset turnover). The report further assesses cash management, applies capital budgeting and sensitivity analysis, and identifies systematic and unsystematic risks impacting Caltex's performance. A dividend payout ratio is calculated to identify the company's dividend policy. The findings suggest that Caltex Australia is not in a high state of growth, exhibiting weak profitability and efficiency. The report concludes with a recommendation letter for institutional investors, offering insights to aid their investment decisions.

Finance for business - Masters
1
1
Paraphrase This Document
Need a fresh take? Get an instant paraphrase of this document with our AI Paraphraser
Abstract
This report has been undertaken to examine the financial performance of selected ASX
listed entity, that is, Caltex Australia. The financial performance as examined through the use of
analysis of ratios, cash management, sensitivity, dividend payout, systematic and unsystematic
risks ahs reflected that the company is presently not in a high state of growth and development, It
has weak profitability, cash management and efficiency position and therefore an investor need
to examine the future financial performance before taking any significant investment decision.
2
Contents
Abstract............................................................................................................................................2
1. Introduction..................................................................................................................................4
2. Financial Analysis of Caltex Australia........................................................................................4
2.1: Description of the Company.................................................................................................4
2.2: Use of Ratio Analysis to evaluate the financial performance of Caltex Australia...............5
2.3: Cash Management Analysis...............................................................................................10
Part 2.4: Application of capital budgeting and sensitivity analysis...........................................11
2.5 Identification and Discussion of Systematic and Un-systematic Risk Impacting the
Performance of Caltex Australia...............................................................................................16
Unsystematic Risk.....................................................................................................................16
Systematic Risks........................................................................................................................17
Part 2.6: Calculation of dividend payout ratio and identification of dividend policy of Caltex
Australia Limited.......................................................................................................................19
3. Recommendation Letter.............................................................................................................21
4. Conclusion.................................................................................................................................22
References......................................................................................................................................23
3
⊘ This is a preview!⊘
Do you want full access?
Subscribe today to unlock all pages.
Trusted by 1+ million students worldwide
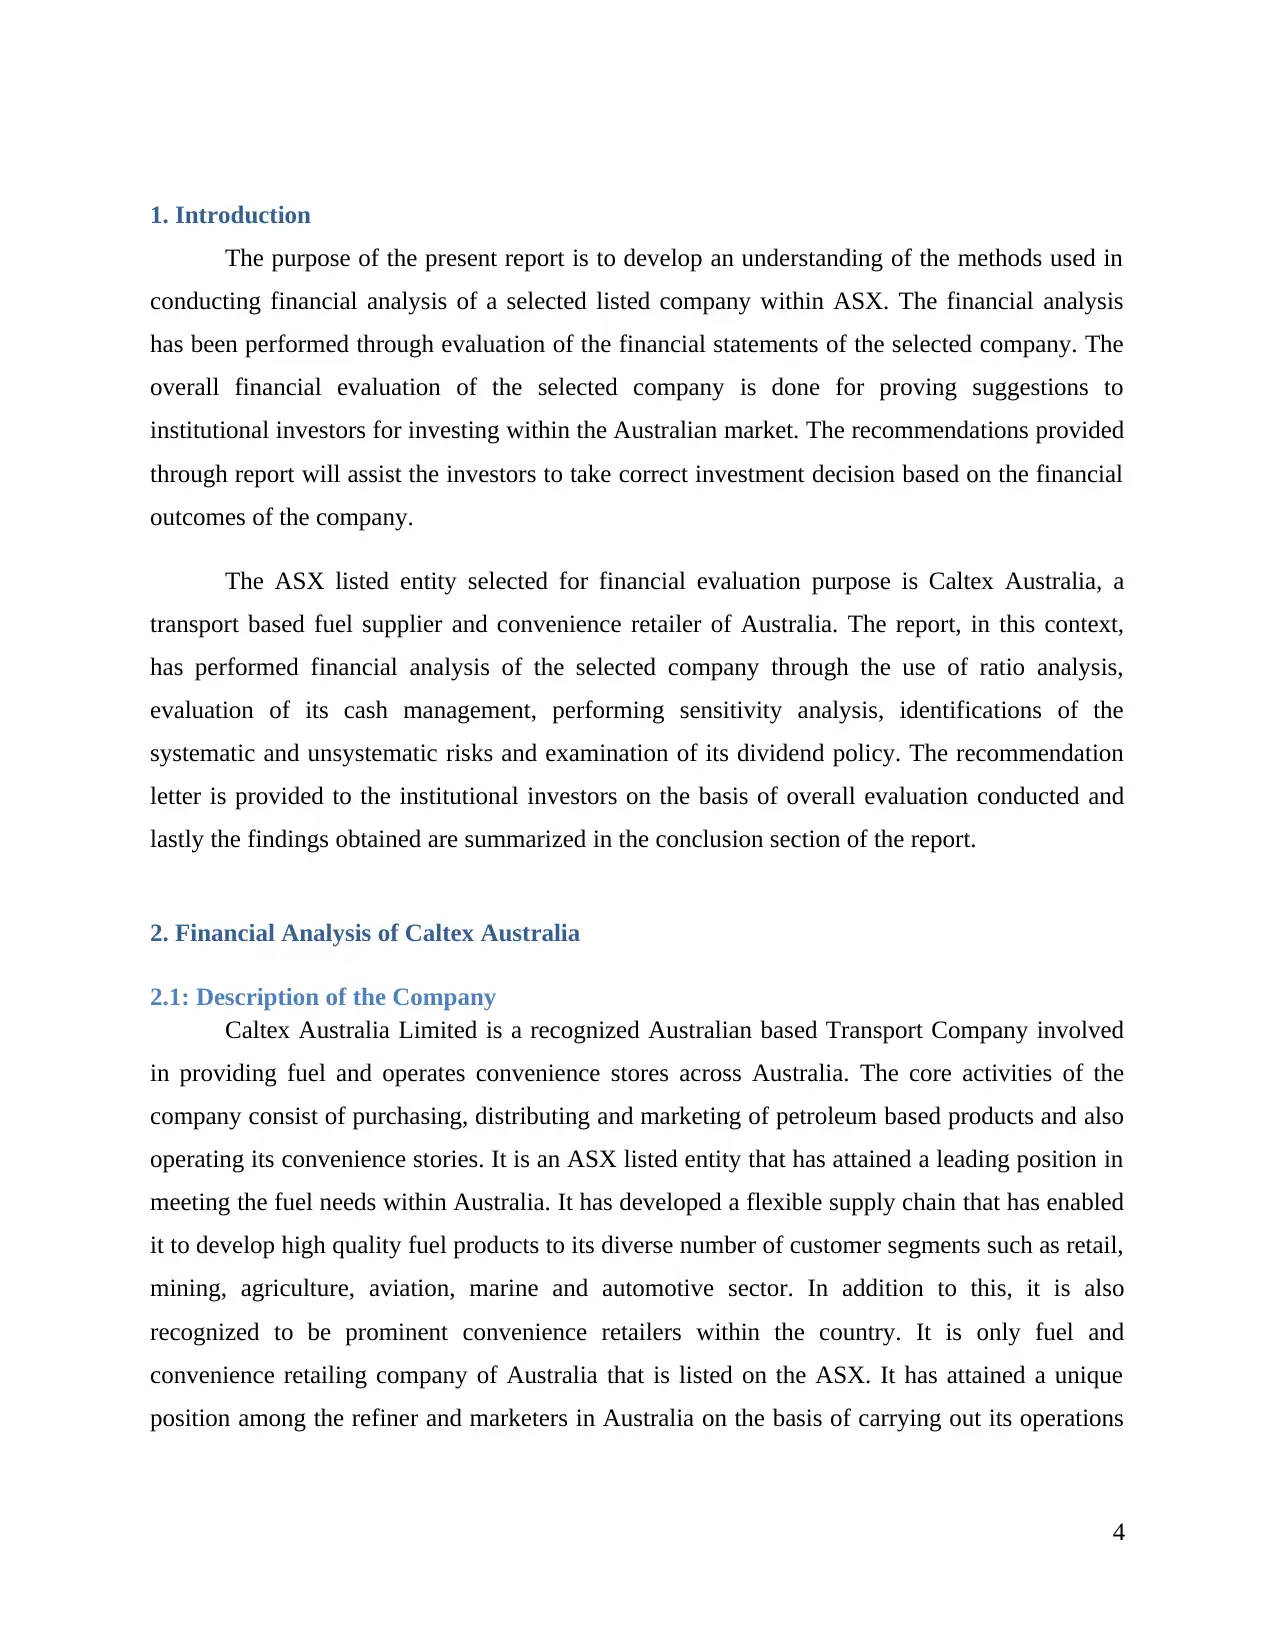
1. Introduction
The purpose of the present report is to develop an understanding of the methods used in
conducting financial analysis of a selected listed company within ASX. The financial analysis
has been performed through evaluation of the financial statements of the selected company. The
overall financial evaluation of the selected company is done for proving suggestions to
institutional investors for investing within the Australian market. The recommendations provided
through report will assist the investors to take correct investment decision based on the financial
outcomes of the company.
The ASX listed entity selected for financial evaluation purpose is Caltex Australia, a
transport based fuel supplier and convenience retailer of Australia. The report, in this context,
has performed financial analysis of the selected company through the use of ratio analysis,
evaluation of its cash management, performing sensitivity analysis, identifications of the
systematic and unsystematic risks and examination of its dividend policy. The recommendation
letter is provided to the institutional investors on the basis of overall evaluation conducted and
lastly the findings obtained are summarized in the conclusion section of the report.
2. Financial Analysis of Caltex Australia
2.1: Description of the Company
Caltex Australia Limited is a recognized Australian based Transport Company involved
in providing fuel and operates convenience stores across Australia. The core activities of the
company consist of purchasing, distributing and marketing of petroleum based products and also
operating its convenience stories. It is an ASX listed entity that has attained a leading position in
meeting the fuel needs within Australia. It has developed a flexible supply chain that has enabled
it to develop high quality fuel products to its diverse number of customer segments such as retail,
mining, agriculture, aviation, marine and automotive sector. In addition to this, it is also
recognized to be prominent convenience retailers within the country. It is only fuel and
convenience retailing company of Australia that is listed on the ASX. It has attained a unique
position among the refiner and marketers in Australia on the basis of carrying out its operations
4
Paraphrase This Document
Need a fresh take? Get an instant paraphrase of this document with our AI Paraphraser
in an independent manner and all the decision-taking is with management and the Board (Caltex
Australia: Our Company, 2019).
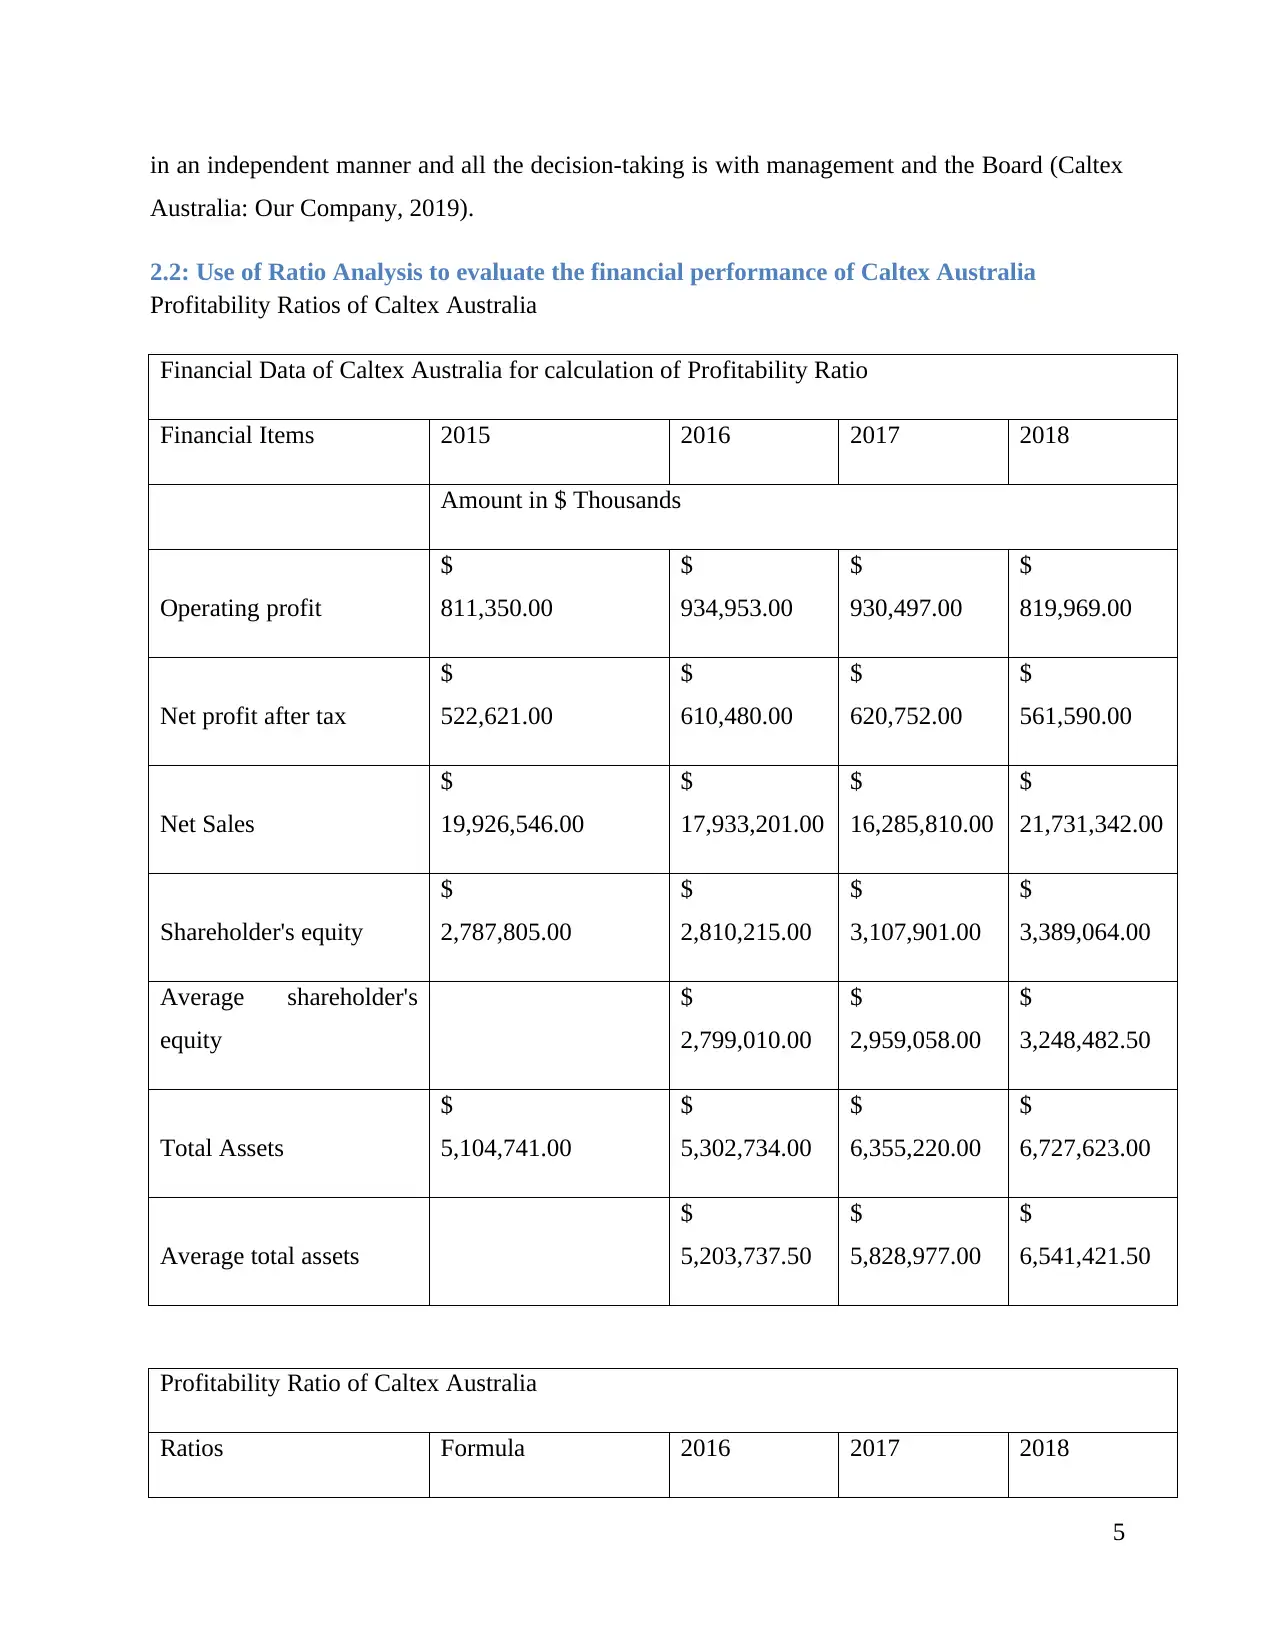
2.2: Use of Ratio Analysis to evaluate the financial performance of Caltex Australia
Profitability Ratios of Caltex Australia
Financial Data of Caltex Australia for calculation of Profitability Ratio
Financial Items 2015 2016 2017 2018
Amount in $ Thousands
Operating profit
$
811,350.00
$
934,953.00
$
930,497.00
$
819,969.00
Net profit after tax
$
522,621.00
$
610,480.00
$
620,752.00
$
561,590.00
Net Sales
$
19,926,546.00
$
17,933,201.00
$
16,285,810.00
$
21,731,342.00
Shareholder's equity
$
2,787,805.00
$
2,810,215.00
$
3,107,901.00
$
3,389,064.00
Average shareholder's
equity
$
2,799,010.00
$
2,959,058.00
$
3,248,482.50
Total Assets
$
5,104,741.00
$
5,302,734.00
$
6,355,220.00
$
6,727,623.00
Average total assets
$
5,203,737.50
$
5,828,977.00
$
6,541,421.50
Profitability Ratio of Caltex Australia
Ratios Formula 2016 2017 2018
5
Australia: Our Company, 2019).
2.2: Use of Ratio Analysis to evaluate the financial performance of Caltex Australia
Profitability Ratios of Caltex Australia
Financial Data of Caltex Australia for calculation of Profitability Ratio
Financial Items 2015 2016 2017 2018
Amount in $ Thousands
Operating profit
$
811,350.00
$
934,953.00
$
930,497.00
$
819,969.00
Net profit after tax
$
522,621.00
$
610,480.00
$
620,752.00
$
561,590.00
Net Sales
$
19,926,546.00
$
17,933,201.00
$
16,285,810.00
$
21,731,342.00
Shareholder's equity
$
2,787,805.00
$
2,810,215.00
$
3,107,901.00
$
3,389,064.00
Average shareholder's
equity
$
2,799,010.00
$
2,959,058.00
$
3,248,482.50
Total Assets
$
5,104,741.00
$
5,302,734.00
$
6,355,220.00
$
6,727,623.00
Average total assets
$
5,203,737.50
$
5,828,977.00
$
6,541,421.50
Profitability Ratio of Caltex Australia
Ratios Formula 2016 2017 2018
5
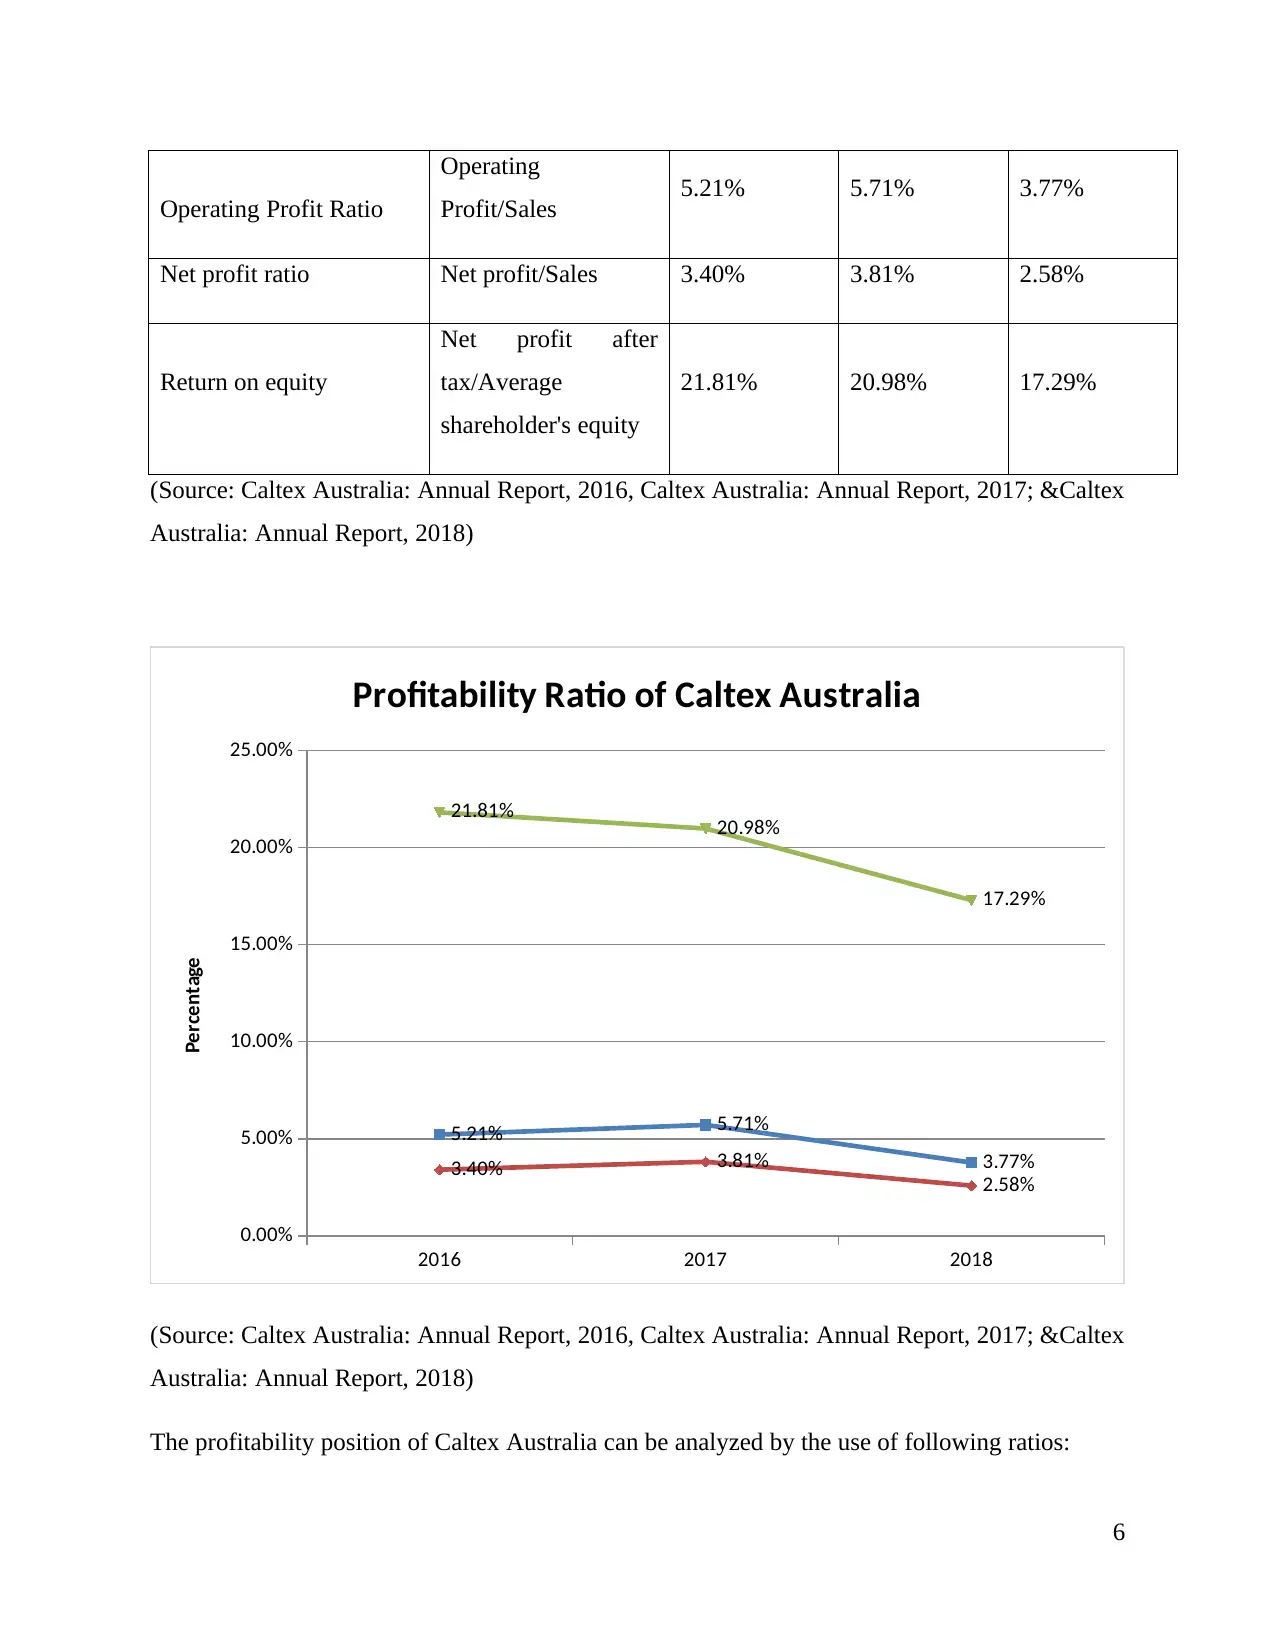
Operating Profit Ratio
Operating
Profit/Sales 5.21% 5.71% 3.77%
Net profit ratio Net profit/Sales 3.40% 3.81% 2.58%
Return on equity
Net profit after
tax/Average
shareholder's equity
21.81% 20.98% 17.29%
(Source: Caltex Australia: Annual Report, 2016, Caltex Australia: Annual Report, 2017; &Caltex
Australia: Annual Report, 2018)
2016 2017 2018
0.00%
5.00%
10.00%
15.00%
20.00%
25.00%
5.21% 5.71%
3.77%3.40% 3.81%
2.58%
21.81% 20.98%
17.29%
Profitability Ratio of Caltex Australia
Percentage
(Source: Caltex Australia: Annual Report, 2016, Caltex Australia: Annual Report, 2017; &Caltex
Australia: Annual Report, 2018)
The profitability position of Caltex Australia can be analyzed by the use of following ratios:
6
⊘ This is a preview!⊘
Do you want full access?
Subscribe today to unlock all pages.
Trusted by 1+ million students worldwide
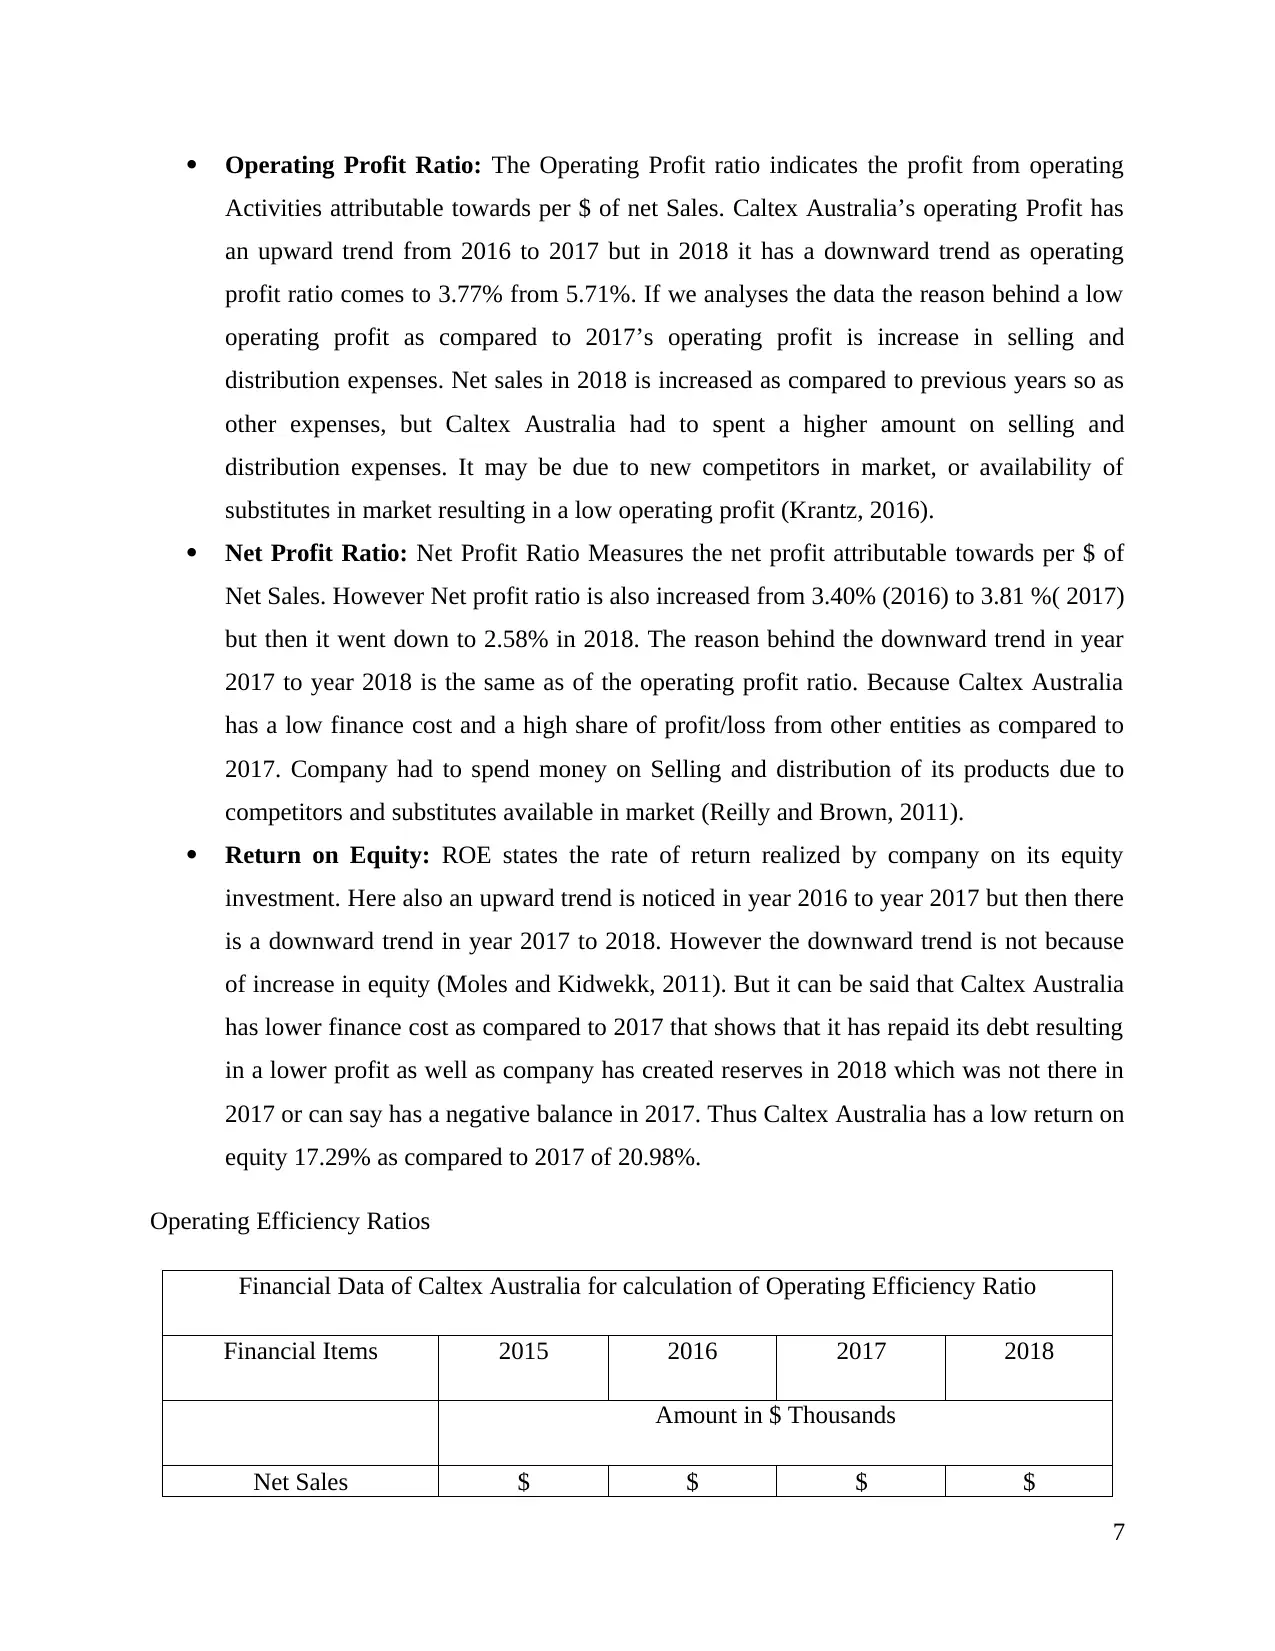
Operating Profit Ratio: The Operating Profit ratio indicates the profit from operating
Activities attributable towards per $ of net Sales. Caltex Australia’s operating Profit has
an upward trend from 2016 to 2017 but in 2018 it has a downward trend as operating
profit ratio comes to 3.77% from 5.71%. If we analyses the data the reason behind a low
operating profit as compared to 2017’s operating profit is increase in selling and
distribution expenses. Net sales in 2018 is increased as compared to previous years so as
other expenses, but Caltex Australia had to spent a higher amount on selling and
distribution expenses. It may be due to new competitors in market, or availability of
substitutes in market resulting in a low operating profit (Krantz, 2016).
Net Profit Ratio: Net Profit Ratio Measures the net profit attributable towards per $ of
Net Sales. However Net profit ratio is also increased from 3.40% (2016) to 3.81 %( 2017)
but then it went down to 2.58% in 2018. The reason behind the downward trend in year
2017 to year 2018 is the same as of the operating profit ratio. Because Caltex Australia
has a low finance cost and a high share of profit/loss from other entities as compared to
2017. Company had to spend money on Selling and distribution of its products due to
competitors and substitutes available in market (Reilly and Brown, 2011).
Return on Equity: ROE states the rate of return realized by company on its equity
investment. Here also an upward trend is noticed in year 2016 to year 2017 but then there
is a downward trend in year 2017 to 2018. However the downward trend is not because
of increase in equity (Moles and Kidwekk, 2011). But it can be said that Caltex Australia
has lower finance cost as compared to 2017 that shows that it has repaid its debt resulting
in a lower profit as well as company has created reserves in 2018 which was not there in
2017 or can say has a negative balance in 2017. Thus Caltex Australia has a low return on
equity 17.29% as compared to 2017 of 20.98%.
Operating Efficiency Ratios
Financial Data of Caltex Australia for calculation of Operating Efficiency Ratio
Financial Items 2015 2016 2017 2018
Amount in $ Thousands
Net Sales $ $ $ $
7
Paraphrase This Document
Need a fresh take? Get an instant paraphrase of this document with our AI Paraphraser
19,926,546.00 17,933,201.00 16,285,810.00 21,731,342.00
Account Receivables
$
681,542.00
$
747,585.00
$
922,420.00
$
1,184,025.00
Average account
receivable
$
714,563.50
$
835,002.50
$
1,053,222.50
Total Assets
$
5,104,741.00
$
5,302,734.00
$
6,355,220.00
$
6,727,623.00
Average total assets
$
5,203,737.50
$
5,828,977.00
$
6,541,421.50
Cost of Goods Sold
$
12,903,682.00
$
11,154,208.00
$
14,125,384.00
$
19,606,994.00
Inventory
$
969,885.00
$
1,080,920.00
$
1,694,915.00
$
1,616,125.00
Average Inventory
$
1,025,402.50
$
1,387,917.50
$
1,655,520.00
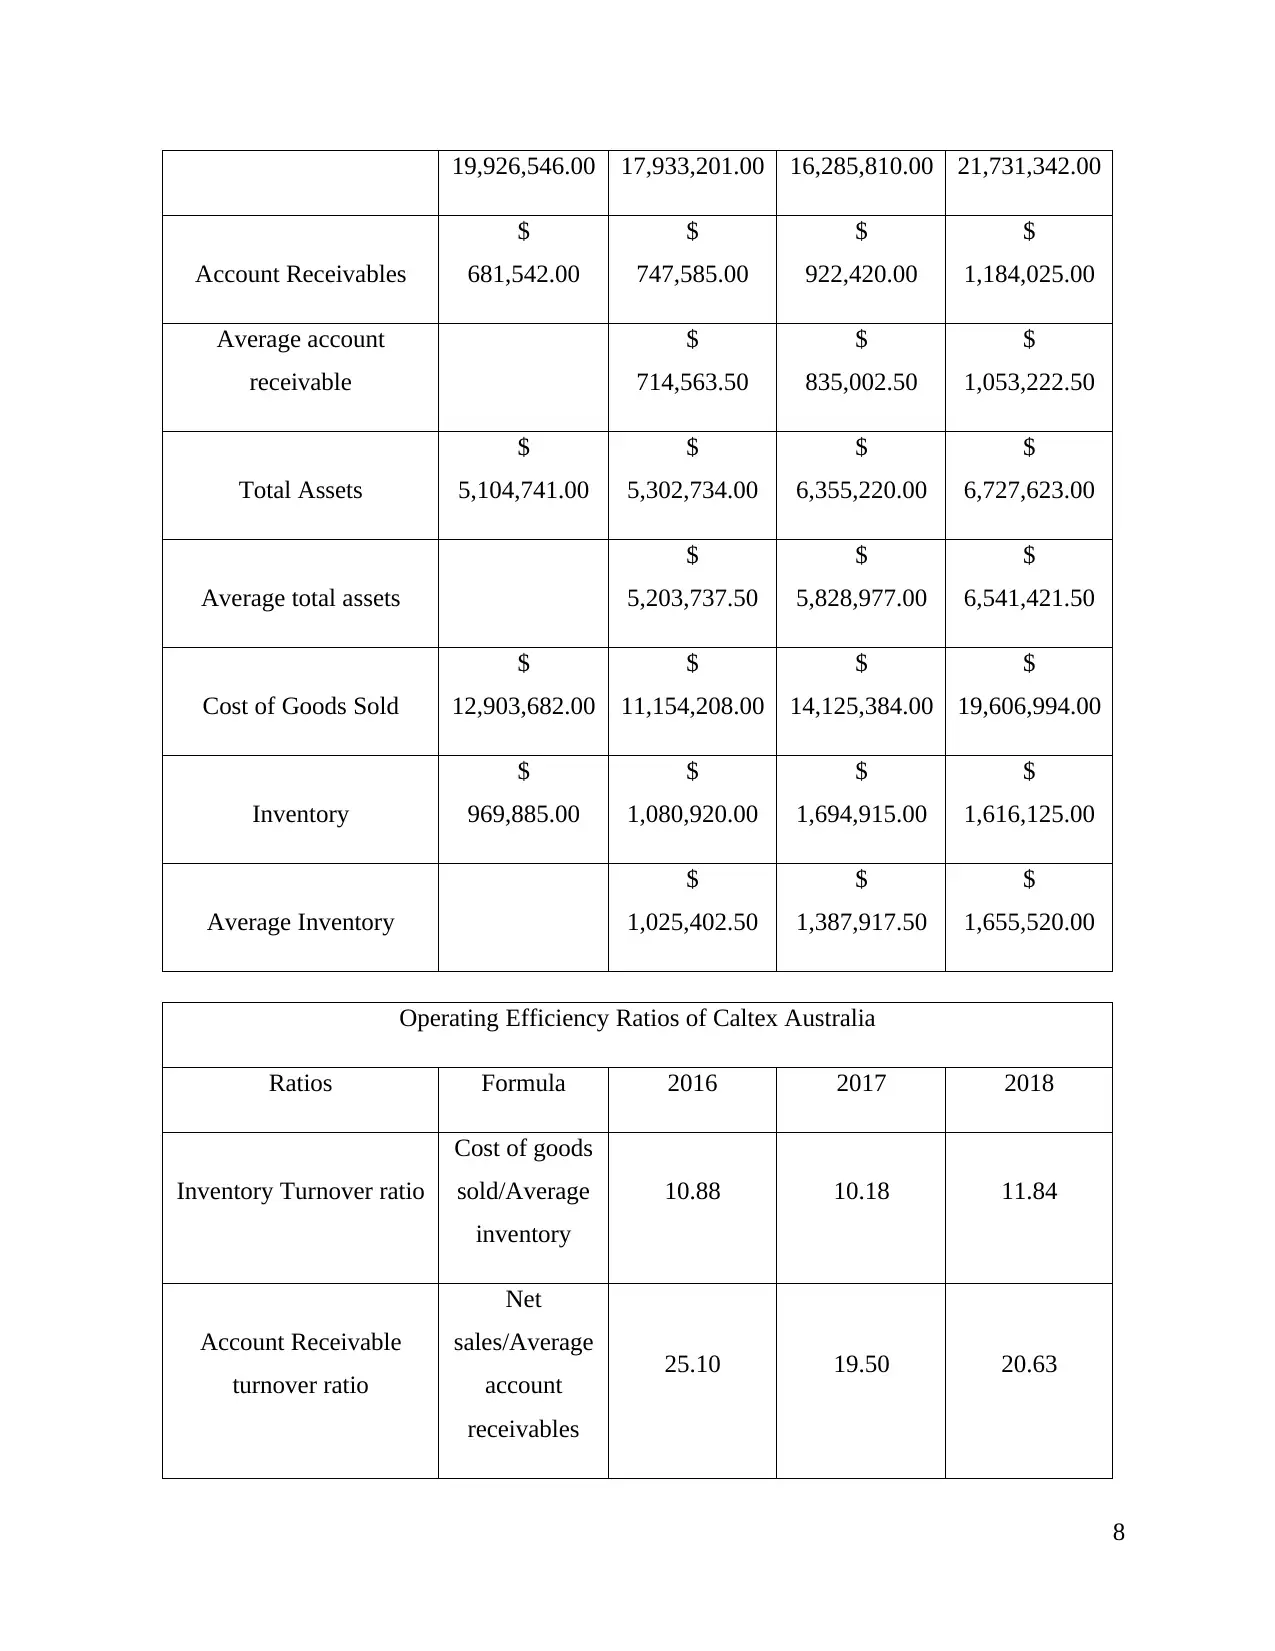
Operating Efficiency Ratios of Caltex Australia
Ratios Formula 2016 2017 2018
Inventory Turnover ratio
Cost of goods
sold/Average
inventory
10.88 10.18 11.84
Account Receivable
turnover ratio
Net
sales/Average
account
receivables
25.10 19.50 20.63
8
Account Receivables
$
681,542.00
$
747,585.00
$
922,420.00
$
1,184,025.00
Average account
receivable
$
714,563.50
$
835,002.50
$
1,053,222.50
Total Assets
$
5,104,741.00
$
5,302,734.00
$
6,355,220.00
$
6,727,623.00
Average total assets
$
5,203,737.50
$
5,828,977.00
$
6,541,421.50
Cost of Goods Sold
$
12,903,682.00
$
11,154,208.00
$
14,125,384.00
$
19,606,994.00
Inventory
$
969,885.00
$
1,080,920.00
$
1,694,915.00
$
1,616,125.00
Average Inventory
$
1,025,402.50
$
1,387,917.50
$
1,655,520.00
Operating Efficiency Ratios of Caltex Australia
Ratios Formula 2016 2017 2018
Inventory Turnover ratio
Cost of goods
sold/Average
inventory
10.88 10.18 11.84
Account Receivable
turnover ratio
Net
sales/Average
account
receivables
25.10 19.50 20.63
8
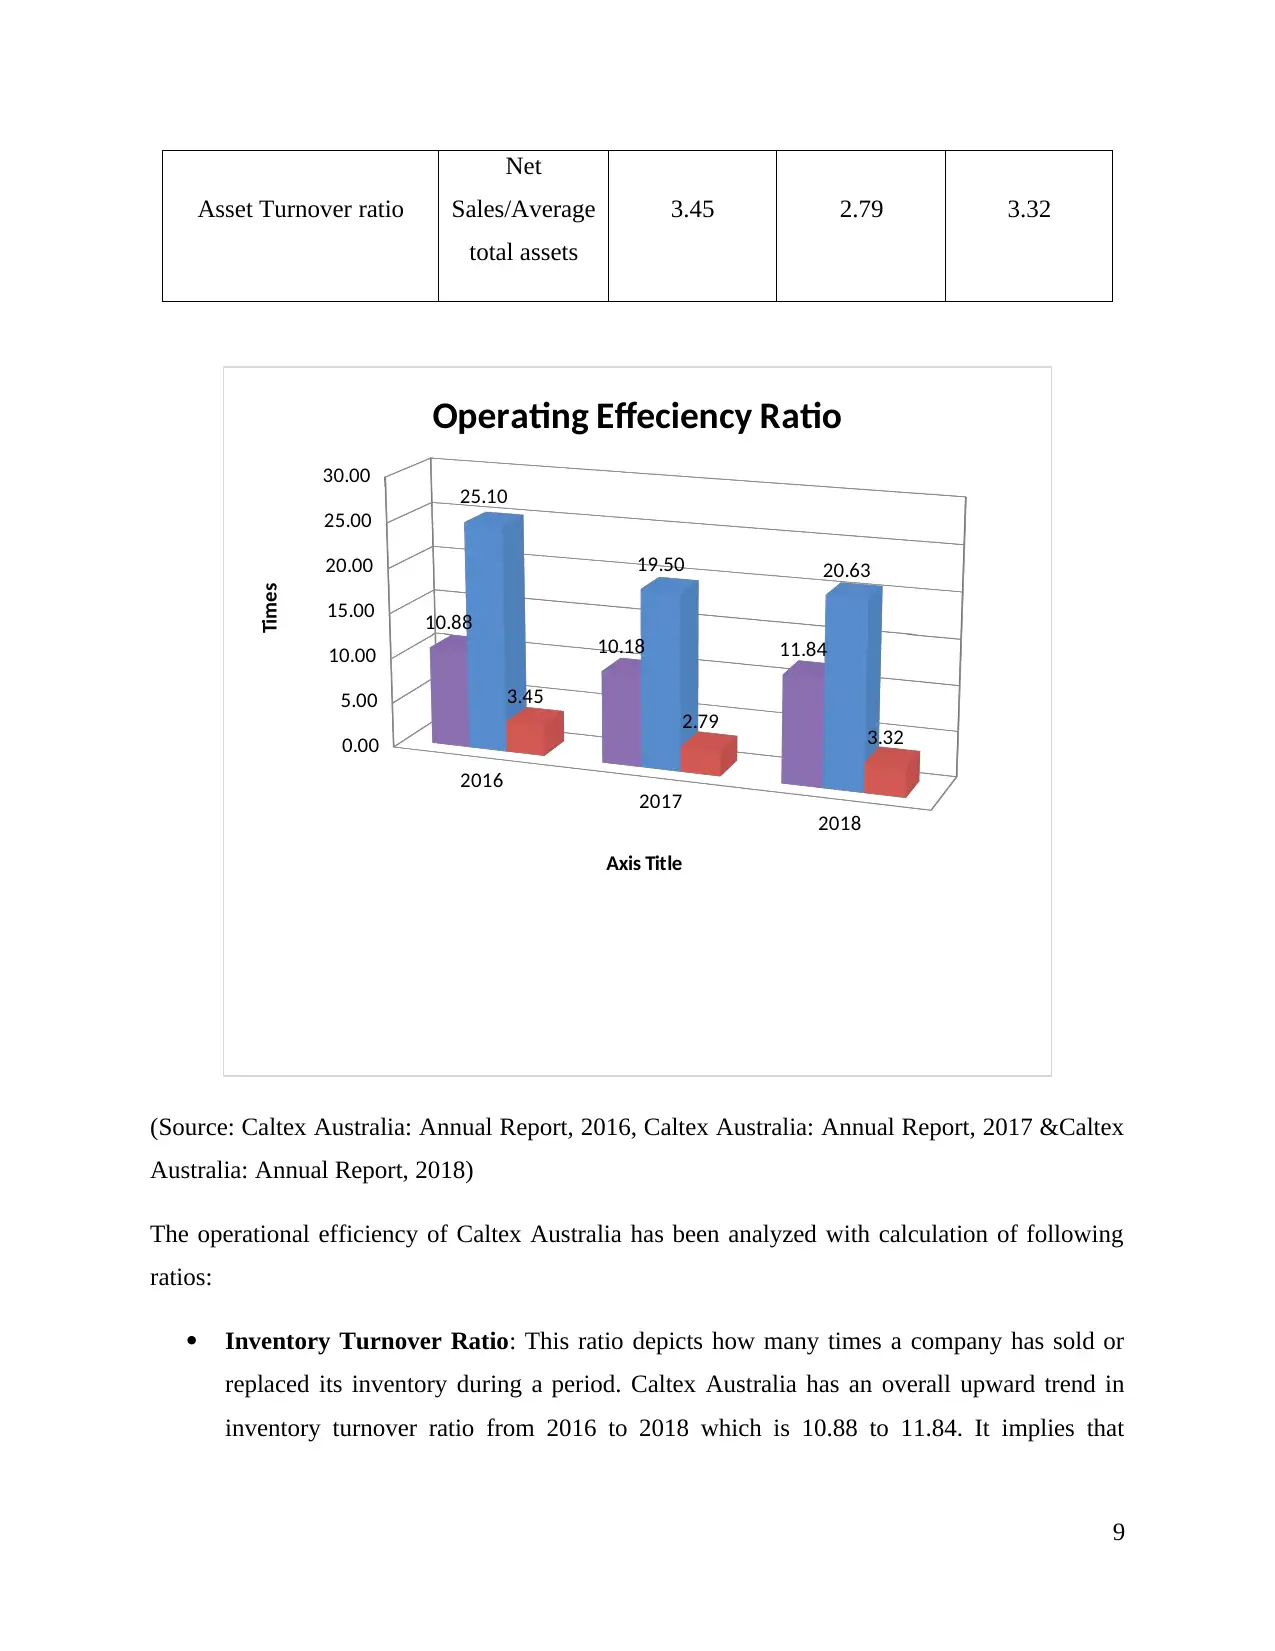
Asset Turnover ratio
Net
Sales/Average
total assets
3.45 2.79 3.32
2016
2017
2018
0.00
5.00
10.00
15.00
20.00
25.00
30.00
10.88
10.18 11.84
25.10
19.50 20.63
3.45
2.79 3.32
Operating Effeciency Ratio
Axis Title
Times
(Source: Caltex Australia: Annual Report, 2016, Caltex Australia: Annual Report, 2017 &Caltex
Australia: Annual Report, 2018)
The operational efficiency of Caltex Australia has been analyzed with calculation of following
ratios:
Inventory Turnover Ratio: This ratio depicts how many times a company has sold or
replaced its inventory during a period. Caltex Australia has an overall upward trend in
inventory turnover ratio from 2016 to 2018 which is 10.88 to 11.84. It implies that
9
⊘ This is a preview!⊘
Do you want full access?
Subscribe today to unlock all pages.
Trusted by 1+ million students worldwide
company is very good at replacing its inventory regularly which will result in low cost of
holding and storage and improve its profitability in long run (Bragg, 2010).
Account Receivable Ratio: Account Receivable ratio depicts number of times a
company can realize payment from its average debtors in a year. If we look into the chart
we notice a downward trend but actually company is improving its efficiency. In 2016
this ratio was 25.10 times which comes to 19.50 times in 2017 but in 2018 company has
efficiently collected its debtors and it comes to 20.63. In 2017 the downward trend is
noticed because of loss of $14 million and in 2018 its $12 million.
Asset Turnover Ratio: This ratio shows company’s ability to best use of its assets to
generate revenue. A downward trend is noticed in past three years (2016-2018) which
may be due to the abnormal loss company has faced in 2017 and 2018. But overall
company is improving its efficiency and using its resources at its best to generate revenue
(Feldman and Libman, 2011).
2.3: Cash Management Analysis
Marketable securities are regarded as the liquid instruments of the company that can be
quickly transferred into cash for meeting the current financial obligations. The liquidity of
marketable securities is due to the fact that they possess the maturity of less than a year and
therefore can be quickly transferred into cash for meeting the financial obligations (Gibson,
2011). As analyzed form the balance sheet of Caltex Australia, the current assets of the company
includes cash and cash equivalents and receivables as marketable securities that presents the
assets that can be quickly transferred into cash. The cash and cash equivalents of the company
has depicted a decline over the past three financial years from 2016-2018 as analyzed from the
financial reports of the company over the selected time period. The cash and cash equivalents
have decreased from 116,606 to 6,142 over the selected financial period. On the other hand, its
account receivables have depicted a large increase over the selected time period as reflected in
the current assets of the company within its balance sheet. It has largely increased from 554,769
to 1,184,025 over the selected financial period (Caltex Australia: Annual Reports, 2019). These
means that the company need to quickly realize its accounts receivable for improving the future
cash flow position as it is holding less cash equivalents. The decrease in the cash equivalents can
results in causing a liquidity risk within the company due to its inability to meet the current
10
Paraphrase This Document
Need a fresh take? Get an instant paraphrase of this document with our AI Paraphraser
obligations. The cash realized from its accounts receivables can provide large assistance to the
company in meeting its future financial obligations (Brigham and Michael, 2013).
Part 2.4: Application of capital budgeting and sensitivity analysis
Project Life 4 Years
Cost of Equipment 2,000,000.00$
Reisdual Value 200,000.00$
Depreciation Method Straight Line
Life of Equipment 4 years
Depreciation of Equipment per
year 450,000.00$
Initial Working Capital 600,000.00$
Recovery of working capital 600,000.00$
Selling Units per year 300000 per year
Selling Price 20.00$
Variable Cost 12.00$
Fixed Cost 300,000.00$
Discount Rate 10%
Tax Rate 30%
Data Given
11

Particulars Year 0 Year 1 Year 2 Year 3 Year 4
Cash Inflows
Selling Units 300000 300000 300000 300000
Selling price 20.00$ 20.00$ 20.00$ 20.00$
Net Cash Inflows 6,000,000.00$ 6,000,000.00$ 6,000,000.00$ 6,000,000.00$
Cash Outflows
Variable Cost 3,600,000.00$ 3,600,000.00$ 3,600,000.00$ 3,600,000.00$
Fixed Cost 300,000.00$ 300,000.00$ 300,000.00$ 300,000.00$
Depreciation 450,000.00$ 450,000.00$ 450,000.00$ 450,000.00$
Total Cash outflows 4,350,000.00$ 4,350,000.00$ 4,350,000.00$ 4,350,000.00$
Cash flows before tax 1,650,000.00$ 1,650,000.00$ 1,650,000.00$ 1,650,000.00$
Less: Tax @ 30% 495,000.00$ 495,000.00$ 495,000.00$ 495,000.00$
Cash Flows after tax 1,155,000.00$ 1,155,000.00$ 1,155,000.00$ 1,155,000.00$
Add: Depreciation 450,000.00$ 450,000.00$ 450,000.00$ 450,000.00$
Cash Flows before
depreciation after tax 1,605,000.00$ 1,605,000.00$ 1,605,000.00$ 1,605,000.00$
Initial Equiment Cost (2,000,000.00)$
Salvage Value 200,000.00$
Working Capital
Initial Requirement (600,000.00)$
Recovery 600,000.00$
Net Cash Flows (2,600,000.00)$ 1,605,000.00$ 1,605,000.00$ 1,605,000.00$ 2,405,000.00$
Statement of Cash flows
Years Cash flows PVF @ 10% PV @ 10%
0 (2,600,000.00)$ 1.000 (2,600,000.000)$
1 1,605,000.00$ 0.909 1,459,090.909$
2 1,605,000.00$ 0.826 1,326,446.281$
3 1,605,000.00$ 0.751 1,205,860.255$
4 2,405,000.00$ 0.683 1,642,647.360$
NPV 3,034,044.806$
Project NPV when there is no change in value drivers
12
⊘ This is a preview!⊘
Do you want full access?
Subscribe today to unlock all pages.
Trusted by 1+ million students worldwide
1 out of 23
Related Documents


Your All-in-One AI-Powered Toolkit for Academic Success.
+13062052269
info@desklib.com
Available 24*7 on WhatsApp / Email
![[object Object]](/_next/static/media/star-bottom.7253800d.svg)
Unlock your academic potential
Copyright © 2020–2026 A2Z Services. All Rights Reserved. Developed and managed by ZUCOL.