Accounting for Management Decisions: Caltex Financial Analysis Report
VerifiedAdded on 2022/08/21
|14
|2514
|13
Report
AI Summary
This report provides a comprehensive financial analysis of Caltex Australia, assessing its performance based on key financial results, liquidity, solvency, utilization, profitability, and market-based ratios. The analysis includes an overview of Caltex's background, directors, and remuneration practices. It also examines the competitive landscape using Porter's Five Forces, evaluating supplier power, buyer power, the threat of new entrants, substitutes, and rivalry within the industry. The report delves into key financial results, including earnings per share and sales volumes, and evaluates various financial ratios to assess Caltex's financial health and efficiency. The analysis covers liquidity, solvency, utilization, profitability, and market-based metrics, providing insights into the company's financial performance over the analyzed period. Based on the evaluation, the report concludes with an investment recommendation, guiding potential investors on whether to buy, hold, or sell Caltex shares.
Running head: ACCOUNTING FOR MANAGEMENT DECISION
Accounting for management decision
Name of the Student
Name of the University
Author Note
Accounting for management decision
Name of the Student
Name of the University
Author Note
Paraphrase This Document
Need a fresh take? Get an instant paraphrase of this document with our AI Paraphraser
ACCOUNTING FOR MANAGEMENT DECISION
Table of Contents
a) Background:........................................................................................................................2
b) Analysis of competitors of industry:...................................................................................3
c) Key financial results...........................................................................................................4
d) Key ratios:...........................................................................................................................4
e) Recommendation:...............................................................................................................9
References list:.........................................................................................................................10
Appendix:.................................................................................................................................12
ACCOUNTING FOR MANAGEMENT DECISION
a) Background:
a. Caltex is an iconic, proud and leading company of Australia which is engaged in
transporting fuel with a network of 1900 affiliated states. The company serve more than three
customers every week by its evolving range of convenience products and complicated supply
chain. It imports, refines and market the lubricants and fuels and meeting one third of the fuel
requirement of Australia (Caltex, 2020). Convenience is being taken to the whole new level
by way of embracing technologies.
b. Julian Segal is the chief financial officer and managing director of Caltex Australia
limited. For the workplace gender equality agency, managing director became a pay equity
ambassador. The board of directors of Caltex Australia comprises of Julian Segal, Steven
Gregg, Trevor Bourne, Melinda Conrad, Mark Chellew, Barbara Ward AM and Bruce
Morgan (Caltex, 2020).
c. Remuneration report is prepared by the directors of the company by adhering with the
section 300 A of the Corporation Act. As required by this section, information presented in
the remuneration report has been done. Fees of non-executive directors are fixed and for
chairing the board, the chairman of the company receives fee and no other fees are paid to
him. A base fee and an additional fees is received by the non-executive directors. In order to
retain and attract quality candidates in the market, remuneration elements are set at the
competitive elements. For removing the distinction in pay due to difference in gender,
reviewing of remuneration is done on a like for like job level.
d. Significant progress has been made by Caltex by the execution of infrastructure, fuels and
convenience retail strategies. The company have nearly doubled its earning per share over the
past five years and this has helped the organization in maintaining the position and
establishing the international footprints. Caltex has been set up for the sustainable growth
⊘ This is a preview!⊘
Do you want full access?
Subscribe today to unlock all pages.
Trusted by 1+ million students worldwide
ACCOUNTING FOR MANAGEMENT DECISION
over the year 2019-2024 as it made significant progress in the execution of convenience retail
and fuel and infrastructure strategies. So far, the strategic partnership of Caltex with
Woolworths has been the most considerable step taken by the company in the retail strategy.
b) Analysis of competitors of industry:
a. Supplier power- The supply chain of Caltex Australia is complex and the company works
actively with the suppliers on private label packaging and packaging designs. Supplier’s
bargaining force is weaker for Caltex as they can easily switch to other suppliers as the
products are less differentiated and switching cost is low (Vetrov et al., 2017). Reasonable
pricing is provided by suppliers as the profits is closely associated with the suppliers pricing.
b. Buyer power- Bargaining power of buyers is weaker because of difficulties in switching
and they are less sensitive to price as they base their decisions on quality of products sold.
c. Threat of new entrants- The threat faced by new entrants is low as achieving economies
of scale is difficult and cost advantage cannot be easily reaped. Higher requirements of
capital also makes it difficult for the new entrants to enter the industry (Zainudin & Hashim,
2016).
d. Substitutes- Threat of substitutes is low as there is fewer availability of substitutes in the
industry of operation of Caltex. It is also less likely of buyers switching to the substitute
products as the products are sold by the firm at comparatively lower price.
e. Rivalries- The market space in which Caltex operates is highly competitive and the
increased competition from the existing competitors could adversely impact the operations.
Therefore, it can be said that rivalries from the existing competitors is high as the increased
competition is likely to adversely impact Caltex.
Paraphrase This Document
Need a fresh take? Get an instant paraphrase of this document with our AI Paraphraser
ACCOUNTING FOR MANAGEMENT DECISION
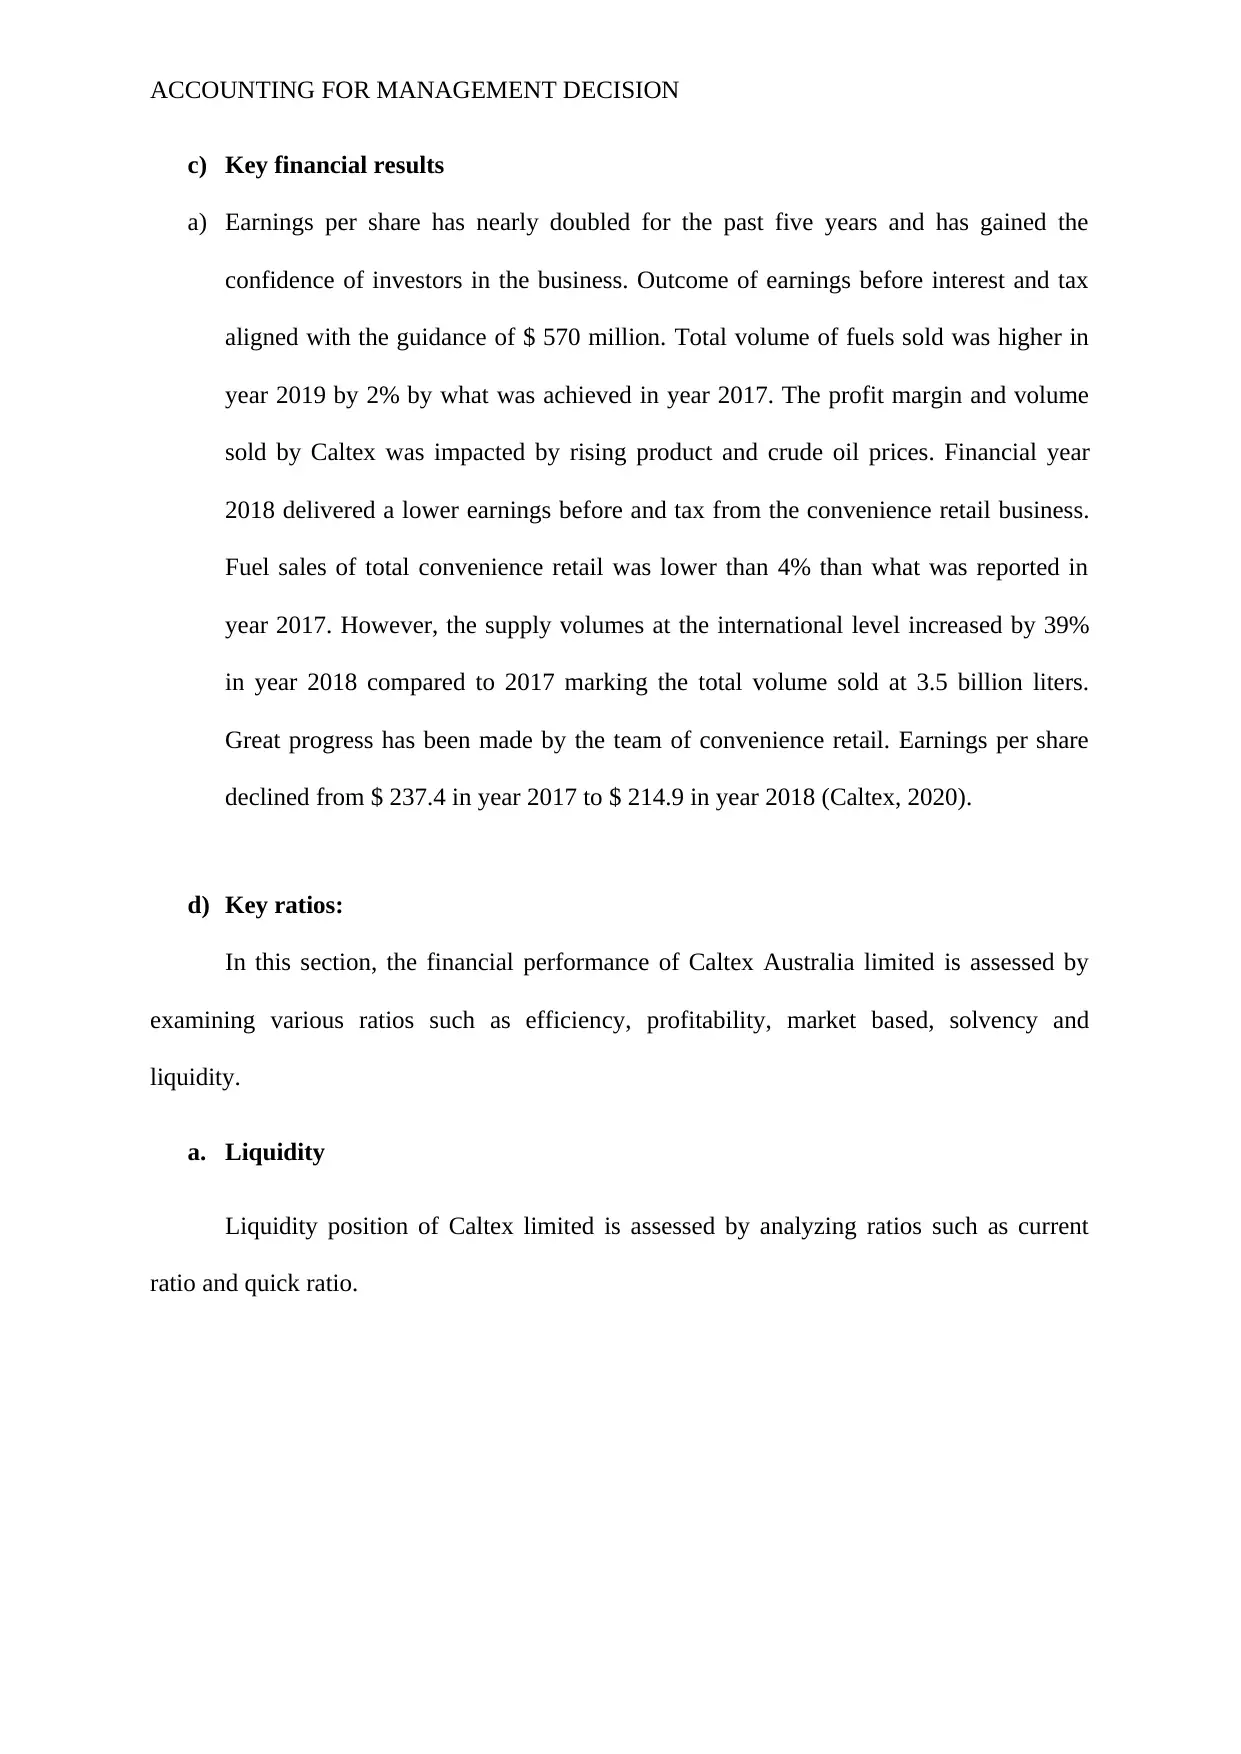
c) Key financial results
a) Earnings per share has nearly doubled for the past five years and has gained the
confidence of investors in the business. Outcome of earnings before interest and tax
aligned with the guidance of $ 570 million. Total volume of fuels sold was higher in
year 2019 by 2% by what was achieved in year 2017. The profit margin and volume
sold by Caltex was impacted by rising product and crude oil prices. Financial year
2018 delivered a lower earnings before and tax from the convenience retail business.
Fuel sales of total convenience retail was lower than 4% than what was reported in
year 2017. However, the supply volumes at the international level increased by 39%
in year 2018 compared to 2017 marking the total volume sold at 3.5 billion liters.
Great progress has been made by the team of convenience retail. Earnings per share
declined from $ 237.4 in year 2017 to $ 214.9 in year 2018 (Caltex, 2020).
d) Key ratios:
In this section, the financial performance of Caltex Australia limited is assessed by
examining various ratios such as efficiency, profitability, market based, solvency and
liquidity.
a. Liquidity
Liquidity position of Caltex limited is assessed by analyzing ratios such as current
ratio and quick ratio.
ACCOUNTING FOR MANAGEMENT DECISION
2018 2017 2016
0.00
0.20
0.40
0.60
0.80
1.00
1.20
1.40
1.60
1.31
1.16
1.43
0.6 0.4
0.7 Current Ratio
Quick Ratio
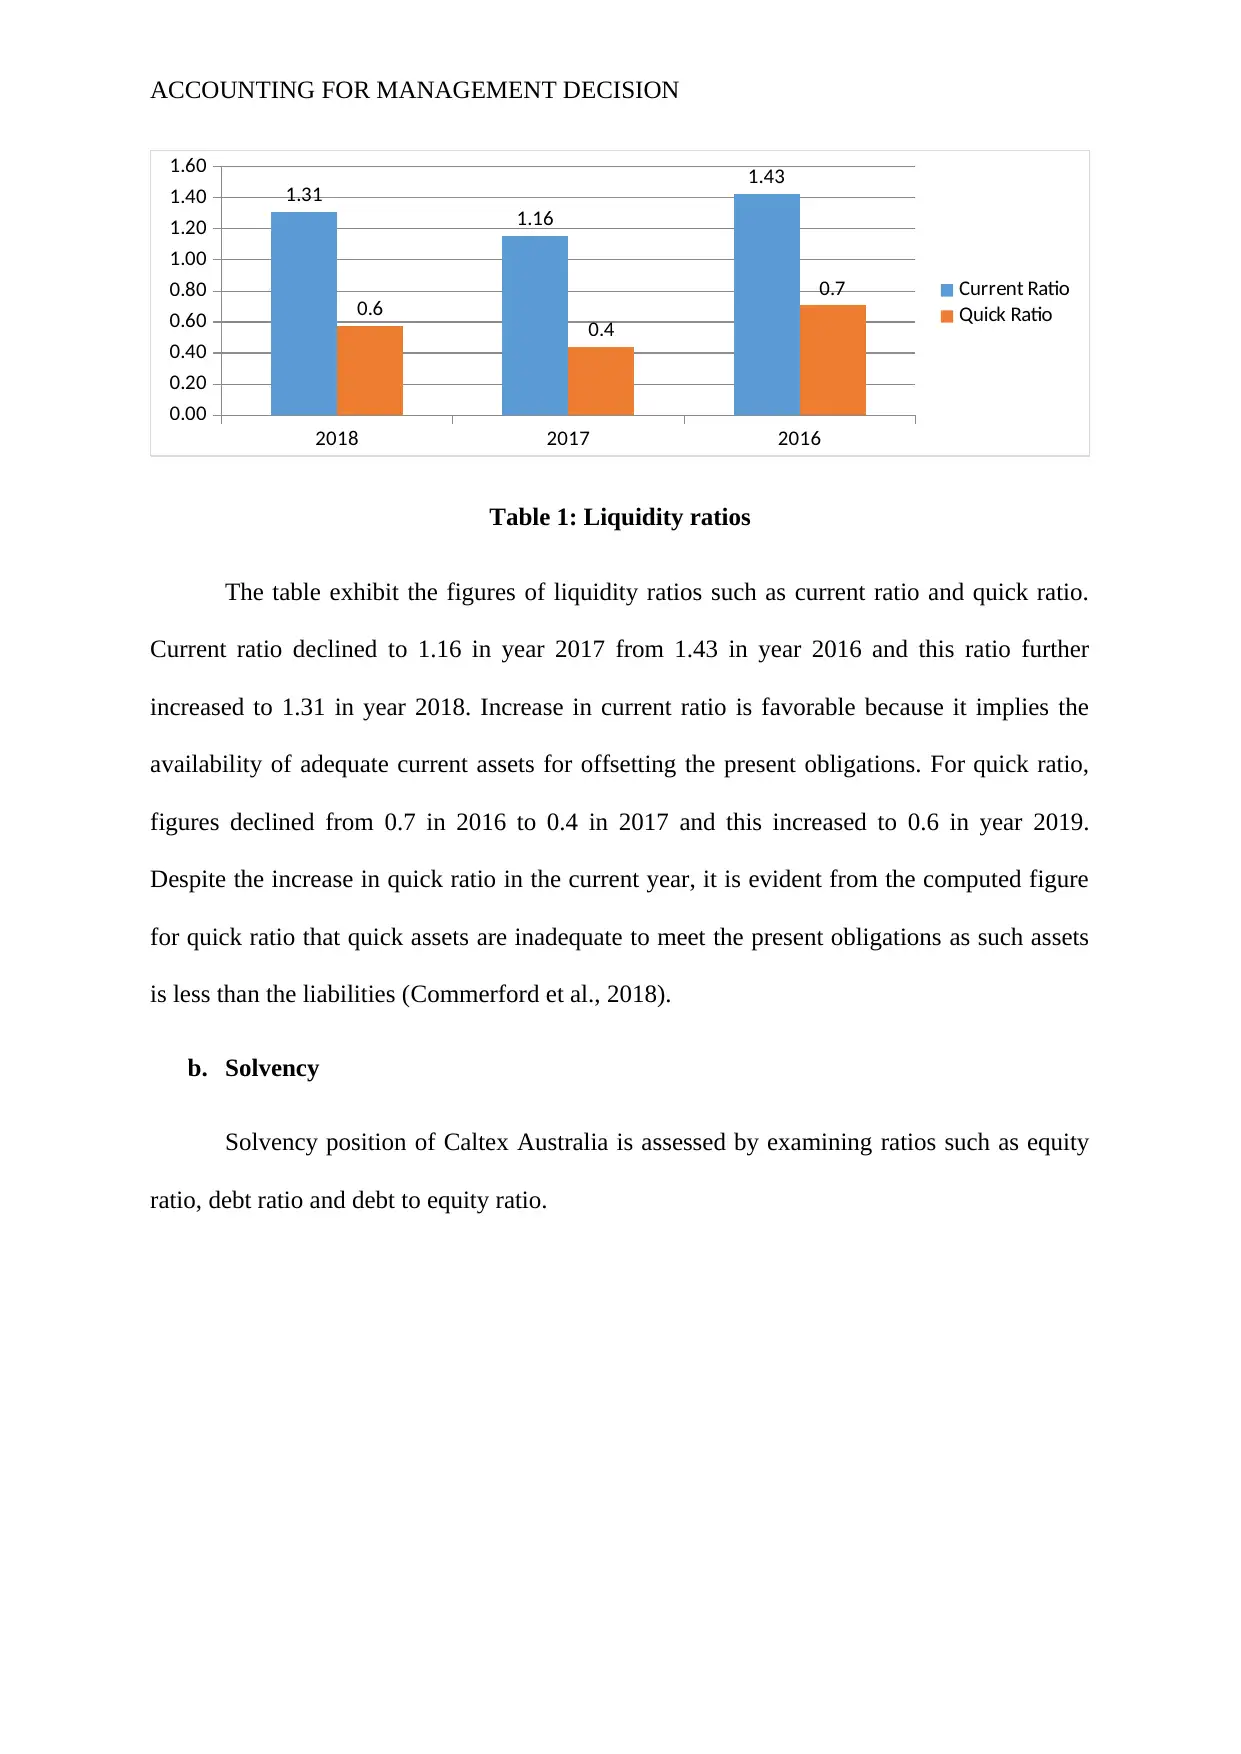
Table 1: Liquidity ratios
The table exhibit the figures of liquidity ratios such as current ratio and quick ratio.
Current ratio declined to 1.16 in year 2017 from 1.43 in year 2016 and this ratio further
increased to 1.31 in year 2018. Increase in current ratio is favorable because it implies the
availability of adequate current assets for offsetting the present obligations. For quick ratio,
figures declined from 0.7 in 2016 to 0.4 in 2017 and this increased to 0.6 in year 2019.
Despite the increase in quick ratio in the current year, it is evident from the computed figure
for quick ratio that quick assets are inadequate to meet the present obligations as such assets
is less than the liabilities (Commerford et al., 2018).
b. Solvency
Solvency position of Caltex Australia is assessed by examining ratios such as equity
ratio, debt ratio and debt to equity ratio.
2018 2017 2016
0.00
0.20
0.40
0.60
0.80
1.00
1.20
1.40
1.60
1.31
1.16
1.43
0.6 0.4
0.7 Current Ratio
Quick Ratio
Table 1: Liquidity ratios
The table exhibit the figures of liquidity ratios such as current ratio and quick ratio.
Current ratio declined to 1.16 in year 2017 from 1.43 in year 2016 and this ratio further
increased to 1.31 in year 2018. Increase in current ratio is favorable because it implies the
availability of adequate current assets for offsetting the present obligations. For quick ratio,
figures declined from 0.7 in 2016 to 0.4 in 2017 and this increased to 0.6 in year 2019.
Despite the increase in quick ratio in the current year, it is evident from the computed figure
for quick ratio that quick assets are inadequate to meet the present obligations as such assets
is less than the liabilities (Commerford et al., 2018).
b. Solvency
Solvency position of Caltex Australia is assessed by examining ratios such as equity
ratio, debt ratio and debt to equity ratio.
⊘ This is a preview!⊘
Do you want full access?
Subscribe today to unlock all pages.
Trusted by 1+ million students worldwide
ACCOUNTING FOR MANAGEMENT DECISION
2018 2017 2016
0.00
0.20
0.40
0.60
0.80
1.00
1.20
0.99 1.04
0.89
0.50 0.51 0.47
0.50 0.49 0.53 Debt to Equity Ratio
Debt Ratio
Equity Ratio
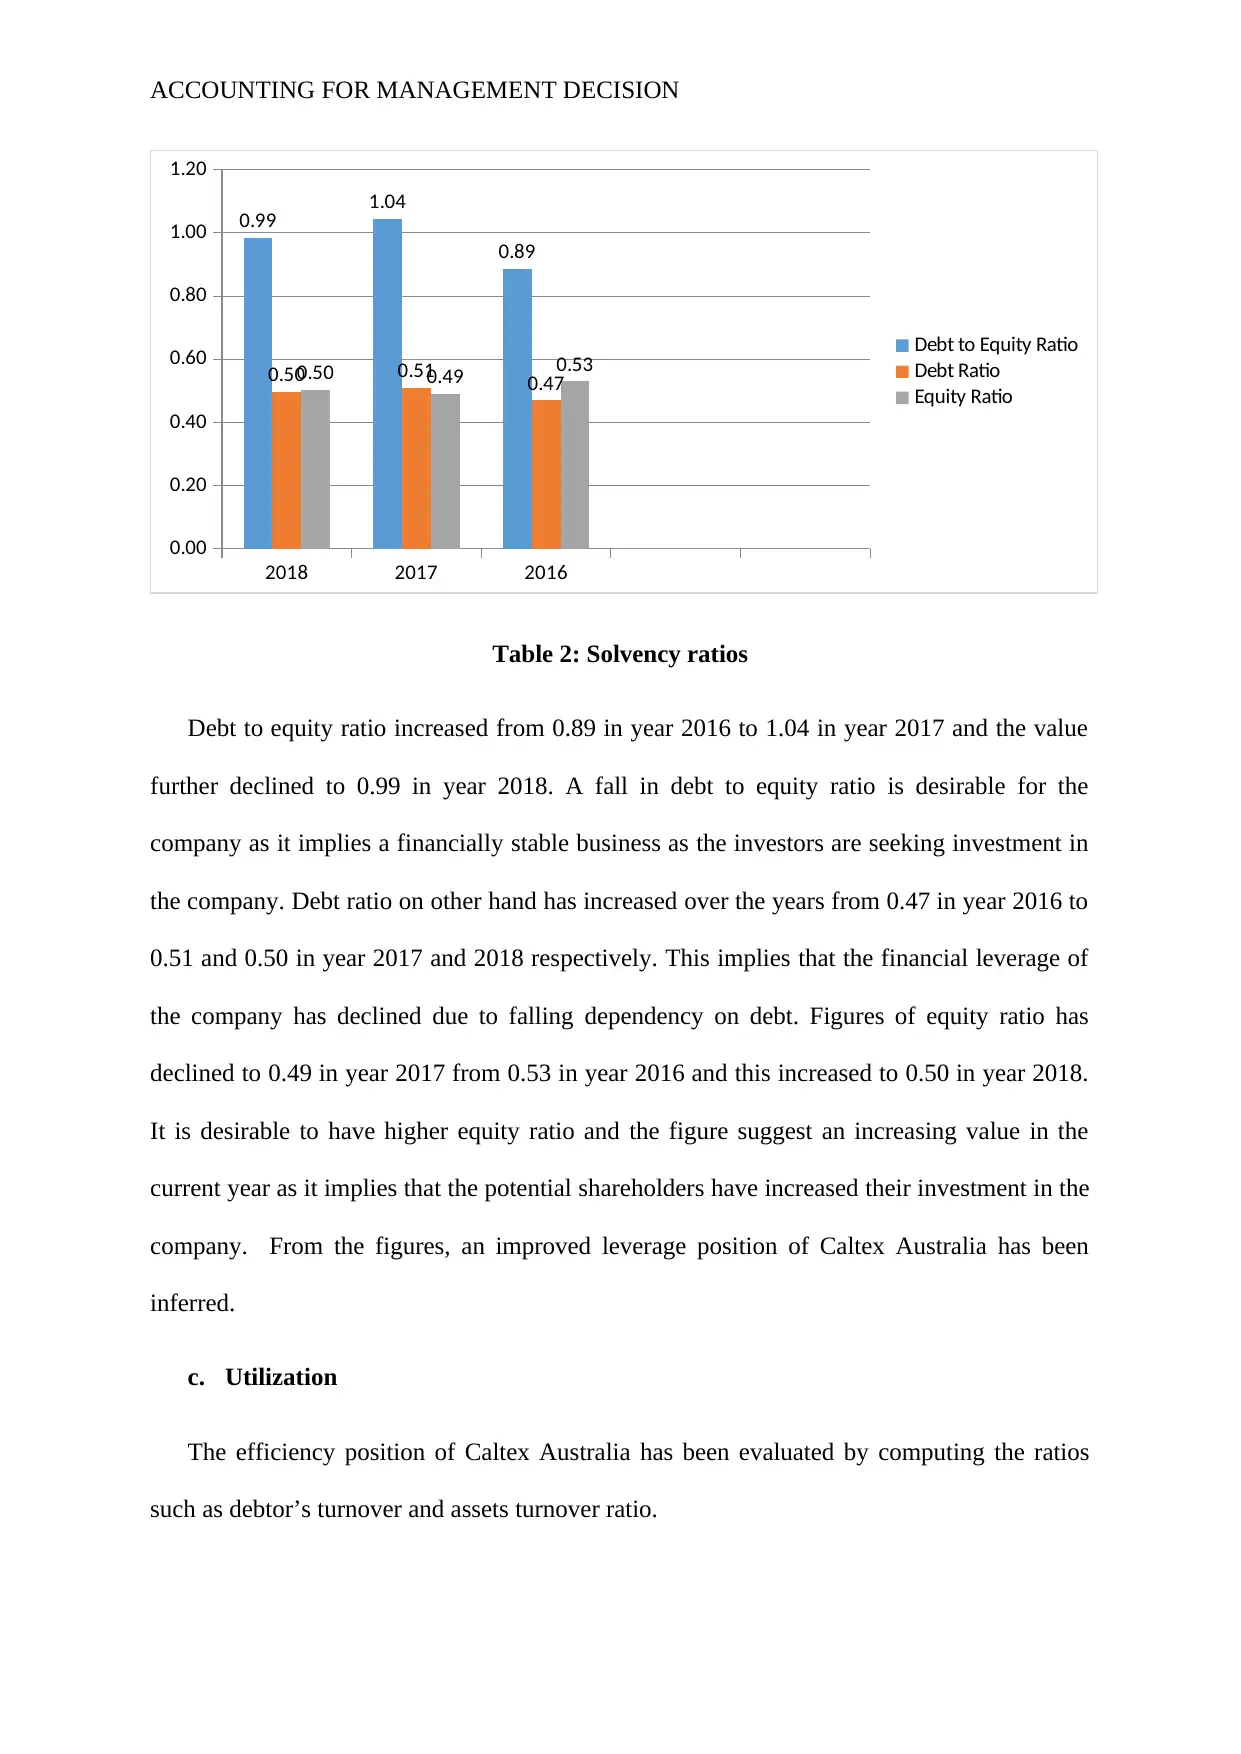
Table 2: Solvency ratios
Debt to equity ratio increased from 0.89 in year 2016 to 1.04 in year 2017 and the value
further declined to 0.99 in year 2018. A fall in debt to equity ratio is desirable for the
company as it implies a financially stable business as the investors are seeking investment in
the company. Debt ratio on other hand has increased over the years from 0.47 in year 2016 to
0.51 and 0.50 in year 2017 and 2018 respectively. This implies that the financial leverage of
the company has declined due to falling dependency on debt. Figures of equity ratio has
declined to 0.49 in year 2017 from 0.53 in year 2016 and this increased to 0.50 in year 2018.
It is desirable to have higher equity ratio and the figure suggest an increasing value in the
current year as it implies that the potential shareholders have increased their investment in the
company. From the figures, an improved leverage position of Caltex Australia has been
inferred.
c. Utilization
The efficiency position of Caltex Australia has been evaluated by computing the ratios
such as debtor’s turnover and assets turnover ratio.
2018 2017 2016
0.00
0.20
0.40
0.60
0.80
1.00
1.20
0.99 1.04
0.89
0.50 0.51 0.47
0.50 0.49 0.53 Debt to Equity Ratio
Debt Ratio
Equity Ratio
Table 2: Solvency ratios
Debt to equity ratio increased from 0.89 in year 2016 to 1.04 in year 2017 and the value
further declined to 0.99 in year 2018. A fall in debt to equity ratio is desirable for the
company as it implies a financially stable business as the investors are seeking investment in
the company. Debt ratio on other hand has increased over the years from 0.47 in year 2016 to
0.51 and 0.50 in year 2017 and 2018 respectively. This implies that the financial leverage of
the company has declined due to falling dependency on debt. Figures of equity ratio has
declined to 0.49 in year 2017 from 0.53 in year 2016 and this increased to 0.50 in year 2018.
It is desirable to have higher equity ratio and the figure suggest an increasing value in the
current year as it implies that the potential shareholders have increased their investment in the
company. From the figures, an improved leverage position of Caltex Australia has been
inferred.
c. Utilization
The efficiency position of Caltex Australia has been evaluated by computing the ratios
such as debtor’s turnover and assets turnover ratio.
Paraphrase This Document
Need a fresh take? Get an instant paraphrase of this document with our AI Paraphraser
ACCOUNTING FOR MANAGEMENT DECISION
2018 2017 2016
0.00
5.00
10.00
15.00
20.00
25.00
30.00
18.35 17.66
23.99
3.23 2.56 3.38
Debtors Turnover
Total Asset turnover
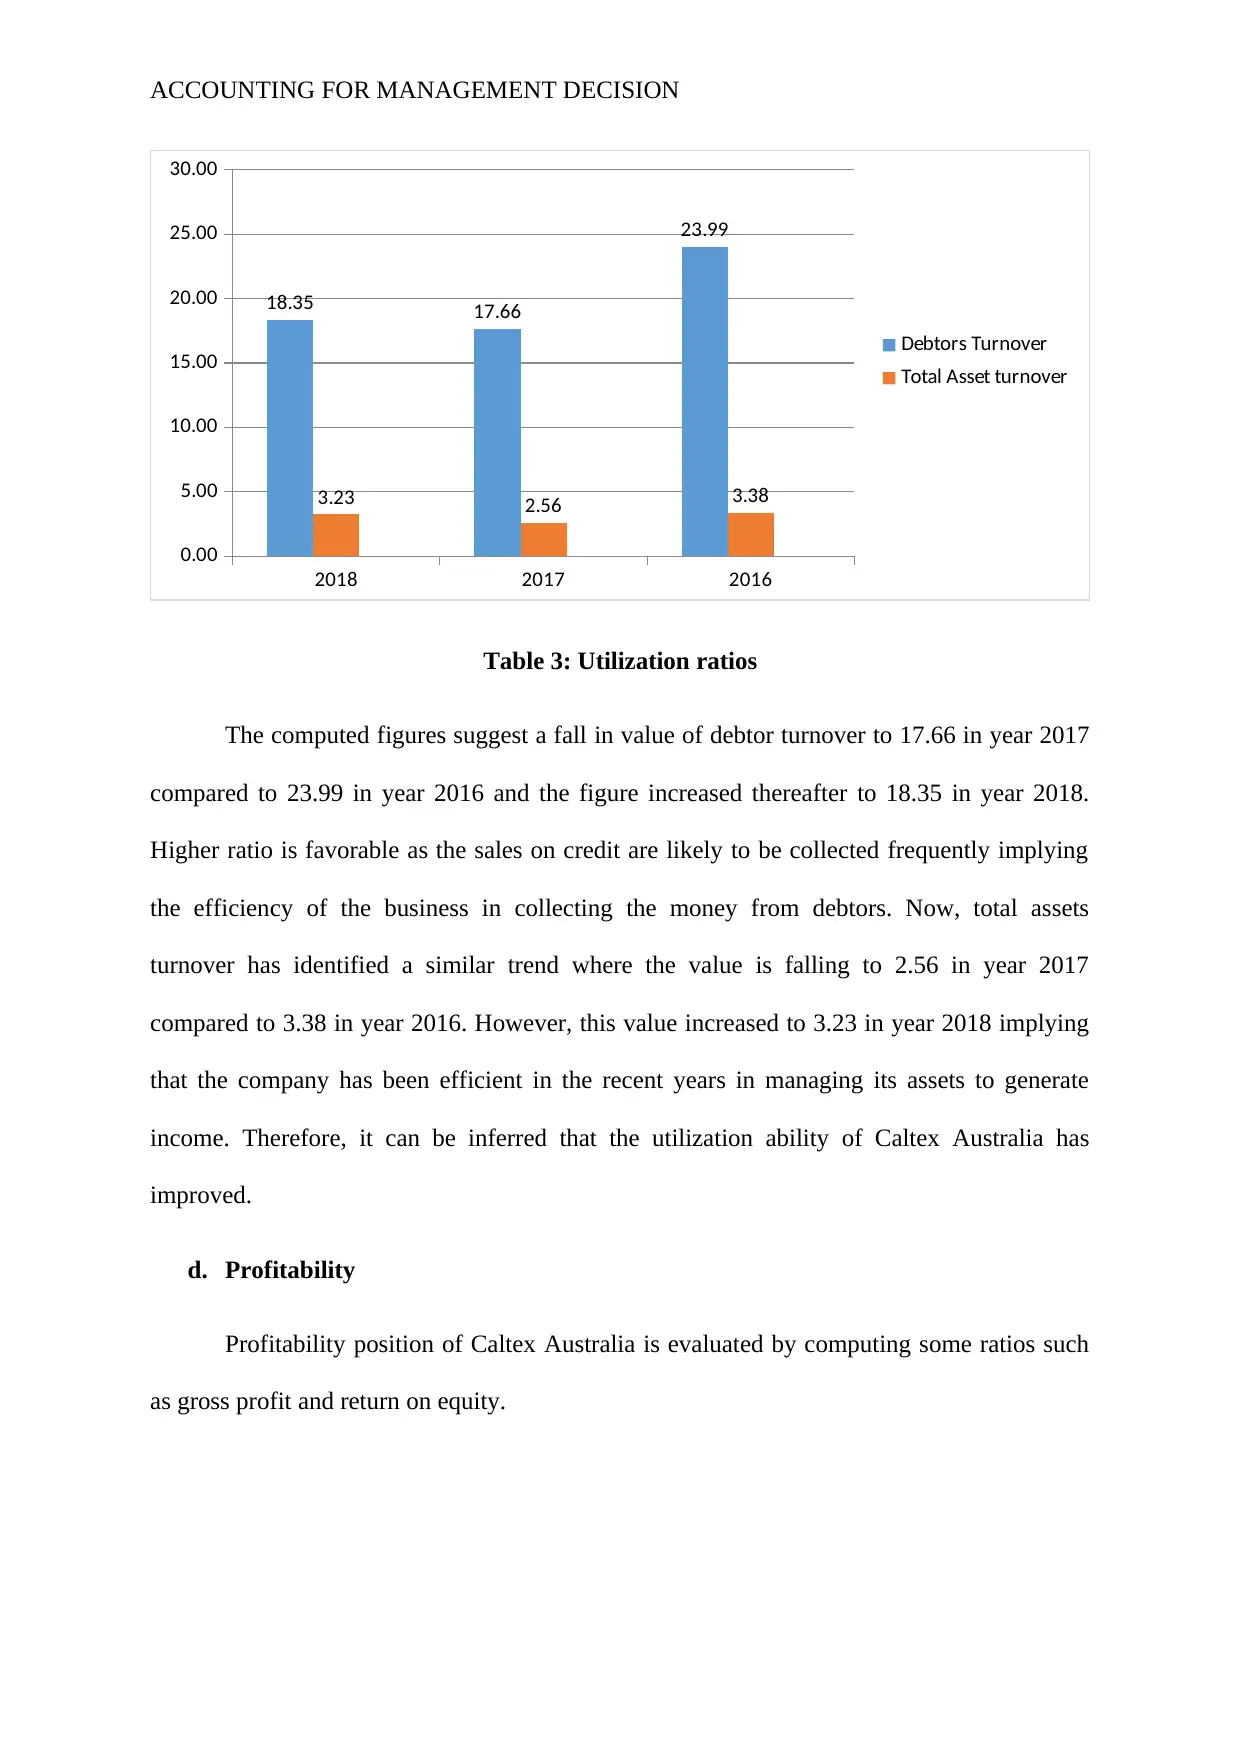
Table 3: Utilization ratios
The computed figures suggest a fall in value of debtor turnover to 17.66 in year 2017
compared to 23.99 in year 2016 and the figure increased thereafter to 18.35 in year 2018.
Higher ratio is favorable as the sales on credit are likely to be collected frequently implying
the efficiency of the business in collecting the money from debtors. Now, total assets
turnover has identified a similar trend where the value is falling to 2.56 in year 2017
compared to 3.38 in year 2016. However, this value increased to 3.23 in year 2018 implying
that the company has been efficient in the recent years in managing its assets to generate
income. Therefore, it can be inferred that the utilization ability of Caltex Australia has
improved.
d. Profitability
Profitability position of Caltex Australia is evaluated by computing some ratios such
as gross profit and return on equity.
2018 2017 2016
0.00
5.00
10.00
15.00
20.00
25.00
30.00
18.35 17.66
23.99
3.23 2.56 3.38
Debtors Turnover
Total Asset turnover
Table 3: Utilization ratios
The computed figures suggest a fall in value of debtor turnover to 17.66 in year 2017
compared to 23.99 in year 2016 and the figure increased thereafter to 18.35 in year 2018.
Higher ratio is favorable as the sales on credit are likely to be collected frequently implying
the efficiency of the business in collecting the money from debtors. Now, total assets
turnover has identified a similar trend where the value is falling to 2.56 in year 2017
compared to 3.38 in year 2016. However, this value increased to 3.23 in year 2018 implying
that the company has been efficient in the recent years in managing its assets to generate
income. Therefore, it can be inferred that the utilization ability of Caltex Australia has
improved.
d. Profitability
Profitability position of Caltex Australia is evaluated by computing some ratios such
as gross profit and return on equity.
ACCOUNTING FOR MANAGEMENT DECISION
2018 2017 2016
0.00%
5.00%
10.00%
15.00%
20.00%
25.00%
9.78%
13.27%
11.11%
16.57%
19.97%
21.72%
Gross Profit Margin Return on Equity
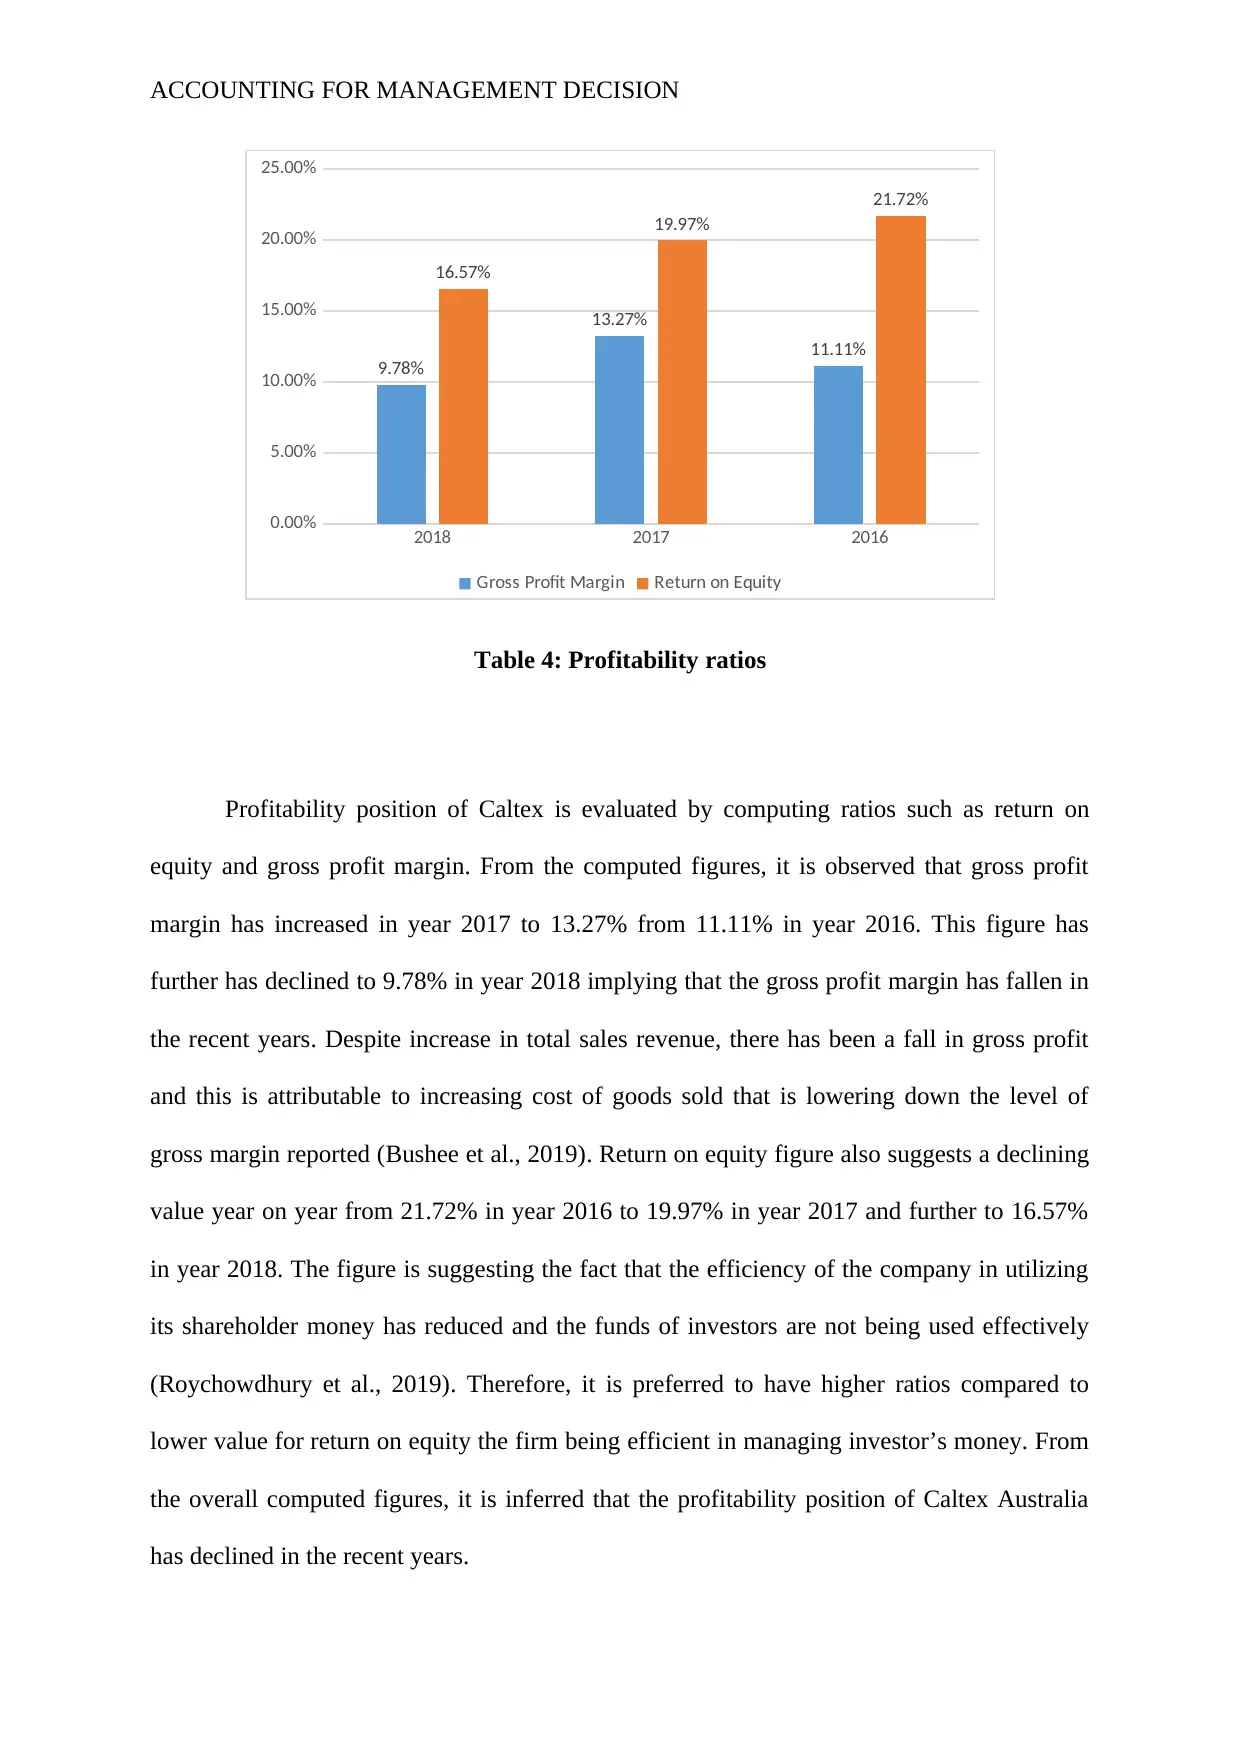
Table 4: Profitability ratios
Profitability position of Caltex is evaluated by computing ratios such as return on
equity and gross profit margin. From the computed figures, it is observed that gross profit
margin has increased in year 2017 to 13.27% from 11.11% in year 2016. This figure has
further has declined to 9.78% in year 2018 implying that the gross profit margin has fallen in
the recent years. Despite increase in total sales revenue, there has been a fall in gross profit
and this is attributable to increasing cost of goods sold that is lowering down the level of
gross margin reported (Bushee et al., 2019). Return on equity figure also suggests a declining
value year on year from 21.72% in year 2016 to 19.97% in year 2017 and further to 16.57%
in year 2018. The figure is suggesting the fact that the efficiency of the company in utilizing
its shareholder money has reduced and the funds of investors are not being used effectively
(Roychowdhury et al., 2019). Therefore, it is preferred to have higher ratios compared to
lower value for return on equity the firm being efficient in managing investor’s money. From
the overall computed figures, it is inferred that the profitability position of Caltex Australia
has declined in the recent years.
2018 2017 2016
0.00%
5.00%
10.00%
15.00%
20.00%
25.00%
9.78%
13.27%
11.11%
16.57%
19.97%
21.72%
Gross Profit Margin Return on Equity
Table 4: Profitability ratios
Profitability position of Caltex is evaluated by computing ratios such as return on
equity and gross profit margin. From the computed figures, it is observed that gross profit
margin has increased in year 2017 to 13.27% from 11.11% in year 2016. This figure has
further has declined to 9.78% in year 2018 implying that the gross profit margin has fallen in
the recent years. Despite increase in total sales revenue, there has been a fall in gross profit
and this is attributable to increasing cost of goods sold that is lowering down the level of
gross margin reported (Bushee et al., 2019). Return on equity figure also suggests a declining
value year on year from 21.72% in year 2016 to 19.97% in year 2017 and further to 16.57%
in year 2018. The figure is suggesting the fact that the efficiency of the company in utilizing
its shareholder money has reduced and the funds of investors are not being used effectively
(Roychowdhury et al., 2019). Therefore, it is preferred to have higher ratios compared to
lower value for return on equity the firm being efficient in managing investor’s money. From
the overall computed figures, it is inferred that the profitability position of Caltex Australia
has declined in the recent years.
⊘ This is a preview!⊘
Do you want full access?
Subscribe today to unlock all pages.
Trusted by 1+ million students worldwide
ACCOUNTING FOR MANAGEMENT DECISION
e. Market based
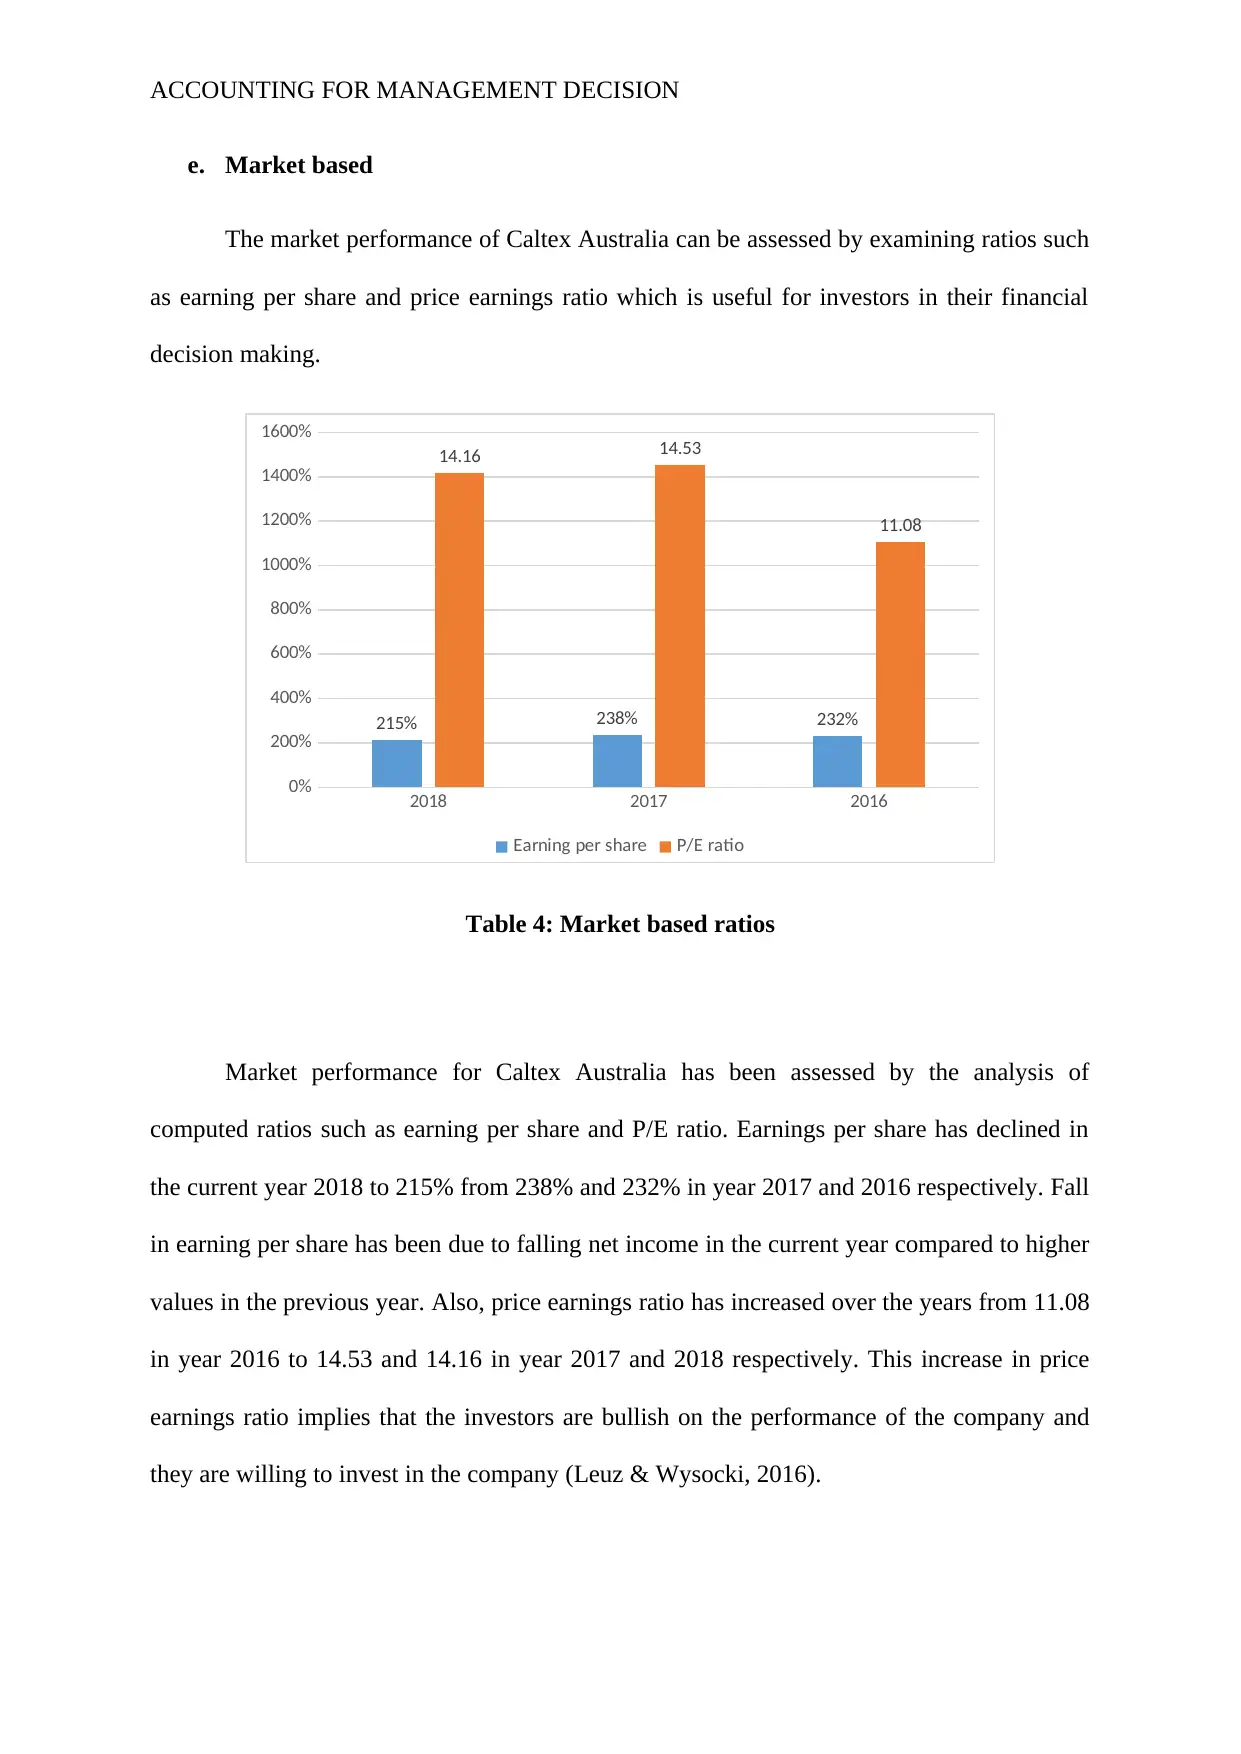
The market performance of Caltex Australia can be assessed by examining ratios such
as earning per share and price earnings ratio which is useful for investors in their financial
decision making.
2018 2017 2016
0%
200%
400%
600%
800%
1000%
1200%
1400%
1600%
215% 238% 232%
14.16 14.53
11.08
Earning per share P/E ratio
Table 4: Market based ratios
Market performance for Caltex Australia has been assessed by the analysis of
computed ratios such as earning per share and P/E ratio. Earnings per share has declined in
the current year 2018 to 215% from 238% and 232% in year 2017 and 2016 respectively. Fall
in earning per share has been due to falling net income in the current year compared to higher
values in the previous year. Also, price earnings ratio has increased over the years from 11.08
in year 2016 to 14.53 and 14.16 in year 2017 and 2018 respectively. This increase in price
earnings ratio implies that the investors are bullish on the performance of the company and
they are willing to invest in the company (Leuz & Wysocki, 2016).
e. Market based
The market performance of Caltex Australia can be assessed by examining ratios such
as earning per share and price earnings ratio which is useful for investors in their financial
decision making.
2018 2017 2016
0%
200%
400%
600%
800%
1000%
1200%
1400%
1600%
215% 238% 232%
14.16 14.53
11.08
Earning per share P/E ratio
Table 4: Market based ratios
Market performance for Caltex Australia has been assessed by the analysis of
computed ratios such as earning per share and P/E ratio. Earnings per share has declined in
the current year 2018 to 215% from 238% and 232% in year 2017 and 2016 respectively. Fall
in earning per share has been due to falling net income in the current year compared to higher
values in the previous year. Also, price earnings ratio has increased over the years from 11.08
in year 2016 to 14.53 and 14.16 in year 2017 and 2018 respectively. This increase in price
earnings ratio implies that the investors are bullish on the performance of the company and
they are willing to invest in the company (Leuz & Wysocki, 2016).
Paraphrase This Document
Need a fresh take? Get an instant paraphrase of this document with our AI Paraphraser
ACCOUNTING FOR MANAGEMENT DECISION
e) Recommendation:
a. From the overall analysis of the figures relating to various ratios identifying the
performance of company, it has been ascertained that Caltex has become more
efficient in generating income and have improved their financial leverage. However,
there has been fall in the profitability level and earnings per share paid to the
shareholders. Nonetheless, price earnings ratios have improved year on year and the
figures being recorded at 14.53 in year 2017 compared to 14.16 in year 2018.
Although, the profitability of Caltex has declined recently, investors are bullish on
their investment in the shares of the company. Therefore, it is recommended to the
exiting investors to hold the shares and the new investors should hold on to buy the
shares.
References list:
Bushee, B. J., Goodman, T. H., & Sunder, S. V. (2019). Financial reporting quality,
investment horizon, and institutional investor trading strategies. The Accounting
Review, 94(3), 87-112.
Caltex. (2020). Annual Reports & Reviews | Caltex Australia. [online] Available at:
https://www.caltex.com.au/our-company/investor-centre/annual-reports-and-reviews
[Accessed 31 Jan. 2020].
ACCOUNTING FOR MANAGEMENT DECISION
Chychyla, R., Leone, A. J., & Minutti-Meza, M. (2019). Complexity of financial reporting
standards and accounting expertise. Journal of Accounting and Economics, 67(1), 226-253.
Commerford, B. P., Hatfield, R. C., & Houston, R. W. (2018). The effect of real earnings
management on auditor scrutiny of management's other financial reporting decisions. The
accounting review, 93(5), 145-163.
Hassan, O. A., & Marston, C. (2019). Corporate Financial Disclosure Measurement in the
Empirical Accounting Literature: A Review Article. The International Journal of
Accounting, 54(02), 1950006.
Ioan, È. A., Ioana, G. A., & Andreea, M. P. (2018). Influence of Managerial Accounting in
the Decision Making Process. Ovidius University Annals, Economic Sciences Series, 18(2),
707-711.
Koo, D. S., Ramalingegowda, S., & Yu, Y. (2017). The effect of financial reporting quality
on corporate dividend policy. Review of Accounting Studies, 22(2), 753-790.
Leuz, C., & Wysocki, P. D. (2016). The economics of disclosure and financial reporting
regulation: Evidence and suggestions for future research. Journal of accounting
research, 54(2), 525-622.
Richardson, A. J. (2017). The relationship between management and financial accounting as
professions and technologies of practice. In The Role of the Management Accountant (pp.
246-261). Routledge.
Roychowdhury, S., Shroff, N., & Verdi, R. S. (2019). The effects of financial reporting and
disclosure on corporate investment: A review. Journal of Accounting and Economics, 68(2-
3), 101246.
⊘ This is a preview!⊘
Do you want full access?
Subscribe today to unlock all pages.
Trusted by 1+ million students worldwide
1 out of 14
Related Documents


Your All-in-One AI-Powered Toolkit for Academic Success.
+13062052269
info@desklib.com
Available 24*7 on WhatsApp / Email
![[object Object]](/_next/static/media/star-bottom.7253800d.svg)
Unlock your academic potential
Copyright © 2020–2026 A2Z Services. All Rights Reserved. Developed and managed by ZUCOL.