Applied Finance Project Report: Financial Analysis of Caltex Australia
VerifiedAdded on 2023/03/17
|33
|6656
|26
Report
AI Summary
This report provides a comprehensive financial analysis of Caltex Australia, examining its corporate governance structure, including the role of the CEO and ownership distribution. It assesses the company's risk and return profile, including historical risk parameters, cost of equity, and default risk. The report further delves into earnings and cash flow, analyzing existing investments and competitive strengths, while also evaluating financing sources, including the benefits and costs of debt. Additionally, it investigates Caltex Australia's dividend policy, historical dividend trends, and firm characteristics. The analysis incorporates peer group comparisons and valuation methods such as FCFF, DDM, and PE approaches to determine the company's investment potential. The report concludes with recommendations based on the findings, offering a detailed overview of Caltex Australia's financial health and investment prospects.
Running Head: Applied Finance
1
Project Report: Applied Finance
1
Project Report: Applied Finance
Paraphrase This Document
Need a fresh take? Get an instant paraphrase of this document with our AI Paraphraser
Applied Finance
2
Executive summary:
Identification over the financial statemenent and market performance of an
organization is quite important before making any decision about the investment in the
company. In the report, various financial key indicators of the company has been studied in
order to identify the investment level of Caltex Australia. The study explains that risk and
return position of the company is quite better in the industry. Further, the ownership structure
and rules have been managed by the company according to Australian policies only. The
other factors also define about better position of the company. the report concludes that the
investment into the company would offer higher return to the investors.
Applied Finance
3
Contents
Corporate governance.......................................................................................................5
Chief executive officer.................................................................................................5
Ownership structure......................................................................................................6
Conflict between bondholders and shareholders..........................................................7
Financial market consideration.....................................................................................8
Social constraints..........................................................................................................9
Recommendation on corporate governance..................................................................9
Risk and return................................................................................................................10
Estimating historical risk parameters..........................................................................10
Estimating default risk and cost of debt.....................................................................12
Estimating cost of capital............................................................................................14
Earnings and cash flow...................................................................................................15
Analyzing existing investment...................................................................................15
Assessing competitive strength...................................................................................18
Sustainability and competitive strength......................................................................20
Financial sources............................................................................................................20
Assessing current financing........................................................................................20
Benefit of debt............................................................................................................21
Cost of debt.................................................................................................................22
Dividend policy..............................................................................................................23
Historical dividend policy analysis.............................................................................23
Firm characteristics.....................................................................................................23
Cash/ trust nexus.........................................................................................................24
⊘ This is a preview!⊘
Do you want full access?
Subscribe today to unlock all pages.
Trusted by 1+ million students worldwide
Applied Finance
4
Peer group...................................................................................................................24
Valuation.........................................................................................................................25
FCFF approach...........................................................................................................25
DDM approach...........................................................................................................26
PE approach................................................................................................................26
Conclusion:.....................................................................................................................27
References.......................................................................................................................28
Appendix.........................................................................................................................30
Paraphrase This Document
Need a fresh take? Get an instant paraphrase of this document with our AI Paraphraser
Applied Finance
5
Corporate governance:
Corporate governance structure of Caltex Australia has been studied in the report. The
study explains that a number of guidelines have been set by the business in order to manage
the corporate governance structure of the company. Company follows a straight style to
manage the corporate governance of the company.
Chief executive officer:
Chief executive officer (CEO) of the company is Julian Segal. He has been the chief
executive officer if Caltex Australia since December, 2016. He is also one of the boards of
director members of the company and commercially driver senior manager whose main focus
is towards the innovation solution and customer centric solution to the customers which
improves the operational efficiency and overall performance of the company (Annual report,
2018).
Julian Segal is not connected as family to the business. He has been appointed as CEO
of the comapny because of his efficiency level and great performance in the organization. He
has worked in the organization from a long time and has experience of nearly 30 years in
various firms which have helped Julian to be at CEO position (Annual report, 2018). CEO is
the only person who also holds a set in non executive officers of the company.
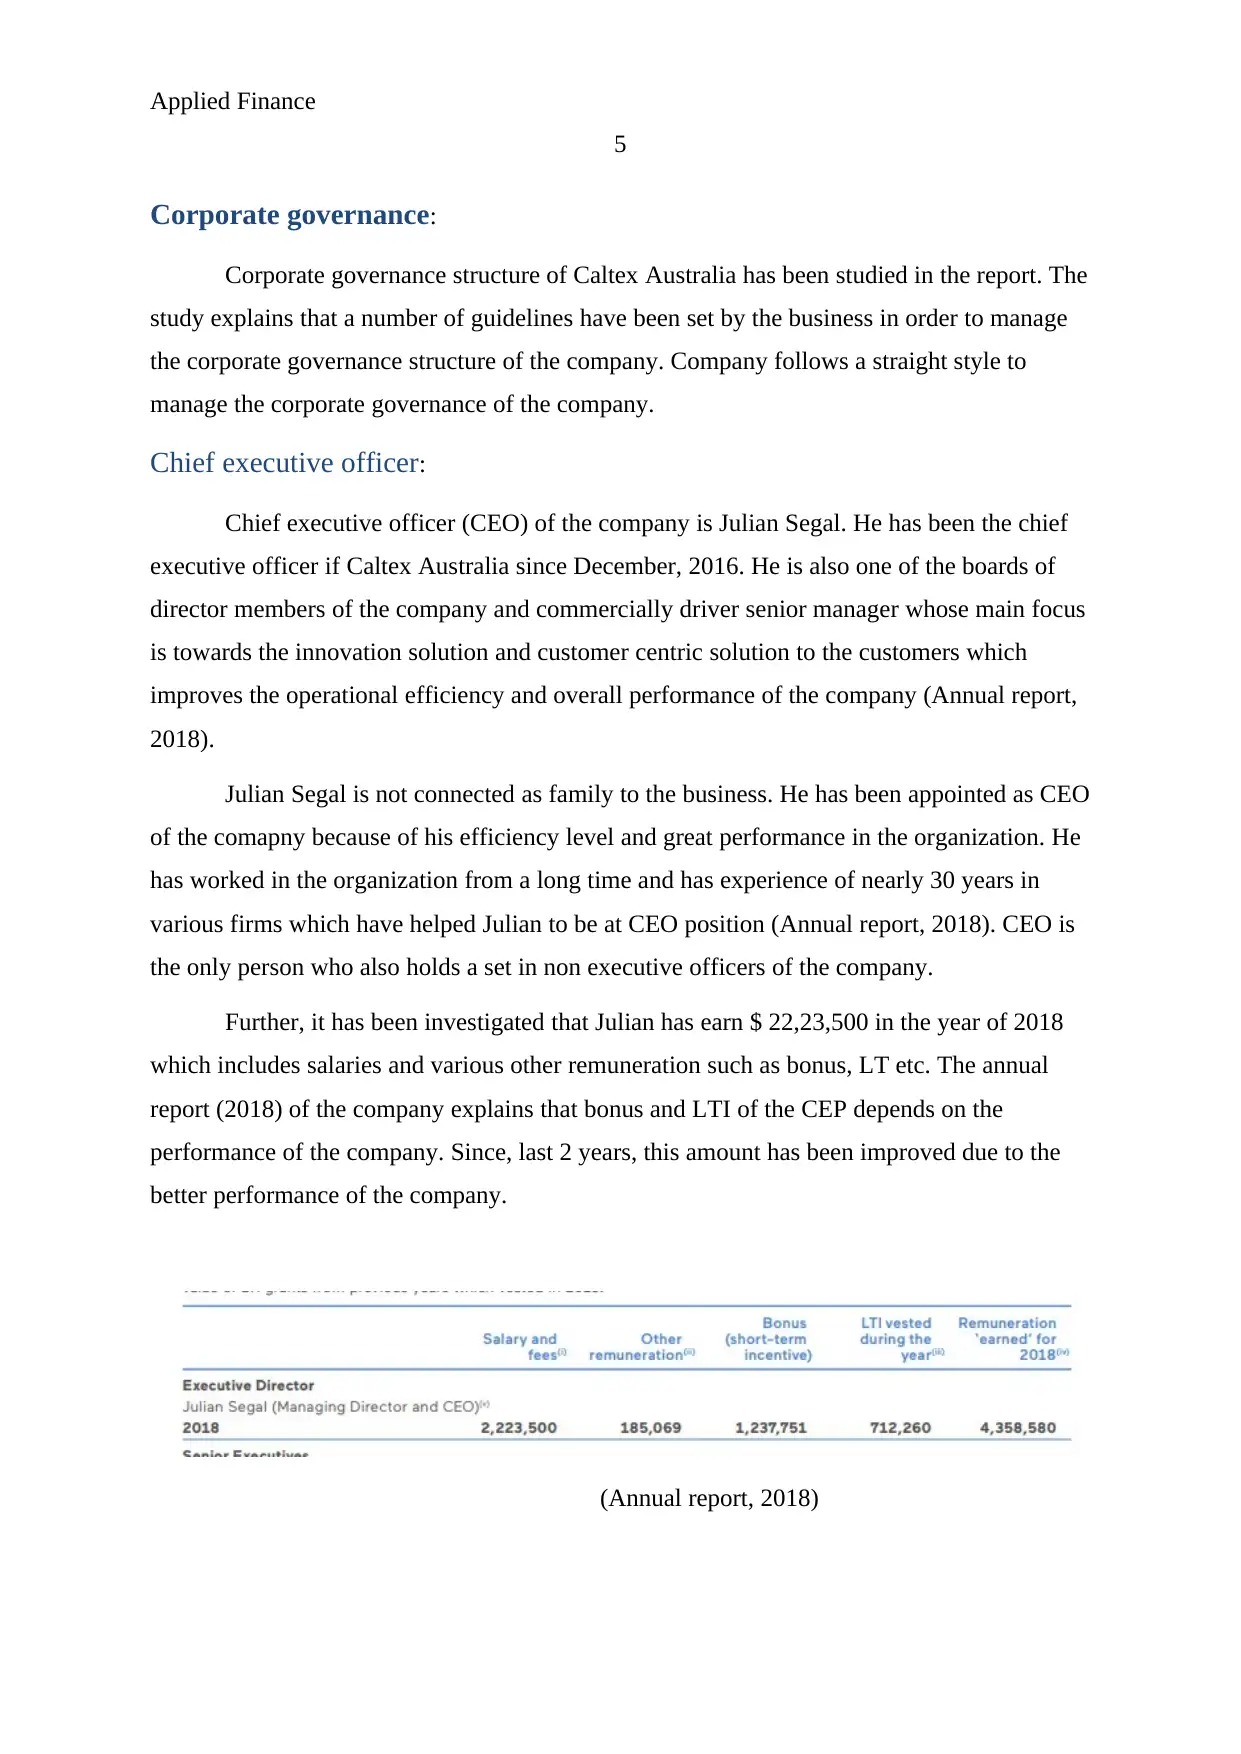
Further, it has been investigated that Julian has earn $ 22,23,500 in the year of 2018
which includes salaries and various other remuneration such as bonus, LT etc. The annual
report (2018) of the company explains that bonus and LTI of the CEP depends on the
performance of the company. Since, last 2 years, this amount has been improved due to the
better performance of the company.
(Annual report, 2018)
5
Corporate governance:
Corporate governance structure of Caltex Australia has been studied in the report. The
study explains that a number of guidelines have been set by the business in order to manage
the corporate governance structure of the company. Company follows a straight style to
manage the corporate governance of the company.
Chief executive officer:
Chief executive officer (CEO) of the company is Julian Segal. He has been the chief
executive officer if Caltex Australia since December, 2016. He is also one of the boards of
director members of the company and commercially driver senior manager whose main focus
is towards the innovation solution and customer centric solution to the customers which
improves the operational efficiency and overall performance of the company (Annual report,
2018).
Julian Segal is not connected as family to the business. He has been appointed as CEO
of the comapny because of his efficiency level and great performance in the organization. He
has worked in the organization from a long time and has experience of nearly 30 years in
various firms which have helped Julian to be at CEO position (Annual report, 2018). CEO is
the only person who also holds a set in non executive officers of the company.
Further, it has been investigated that Julian has earn $ 22,23,500 in the year of 2018
which includes salaries and various other remuneration such as bonus, LT etc. The annual
report (2018) of the company explains that bonus and LTI of the CEP depends on the
performance of the company. Since, last 2 years, this amount has been improved due to the
better performance of the company.
(Annual report, 2018)
Applied Finance
6
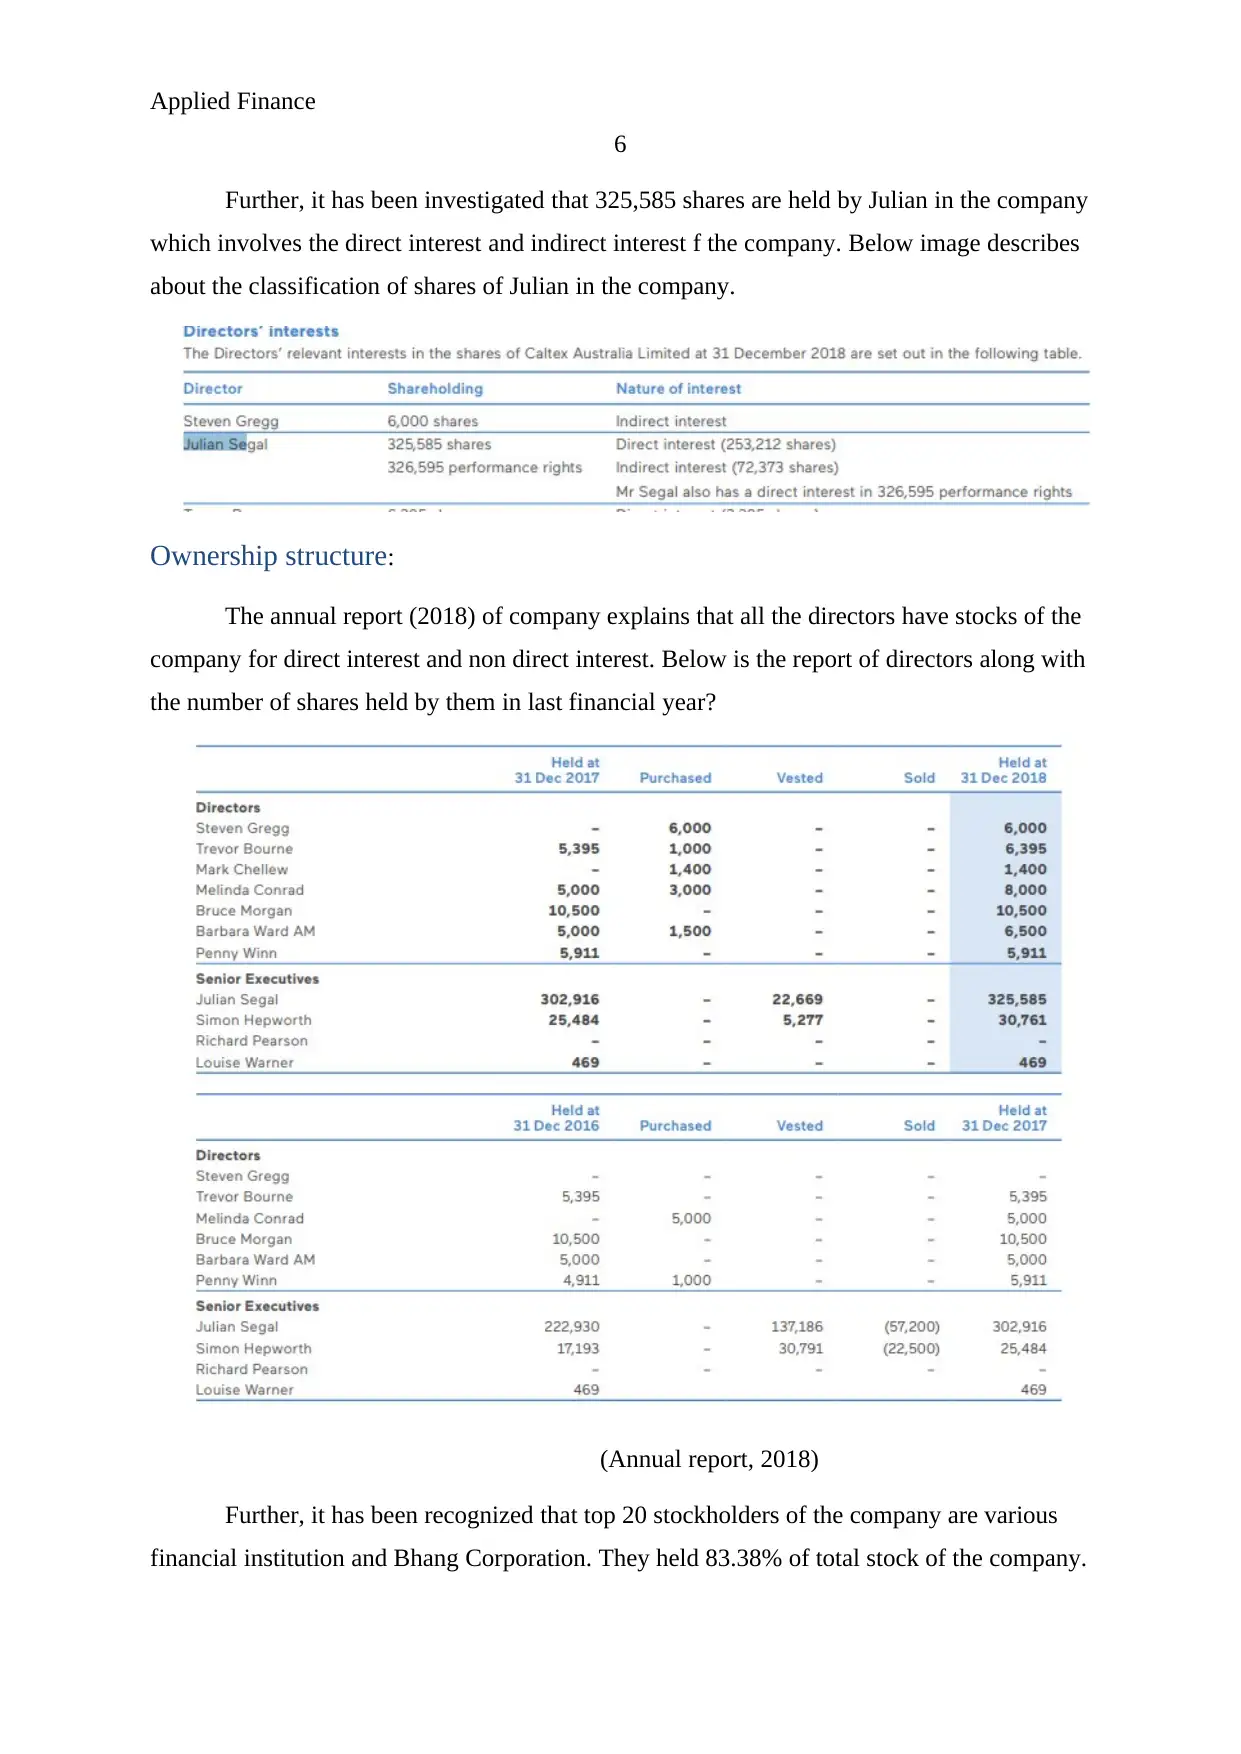
Further, it has been investigated that 325,585 shares are held by Julian in the company
which involves the direct interest and indirect interest f the company. Below image describes
about the classification of shares of Julian in the company.
Ownership structure:
The annual report (2018) of company explains that all the directors have stocks of the
company for direct interest and non direct interest. Below is the report of directors along with
the number of shares held by them in last financial year?
(Annual report, 2018)
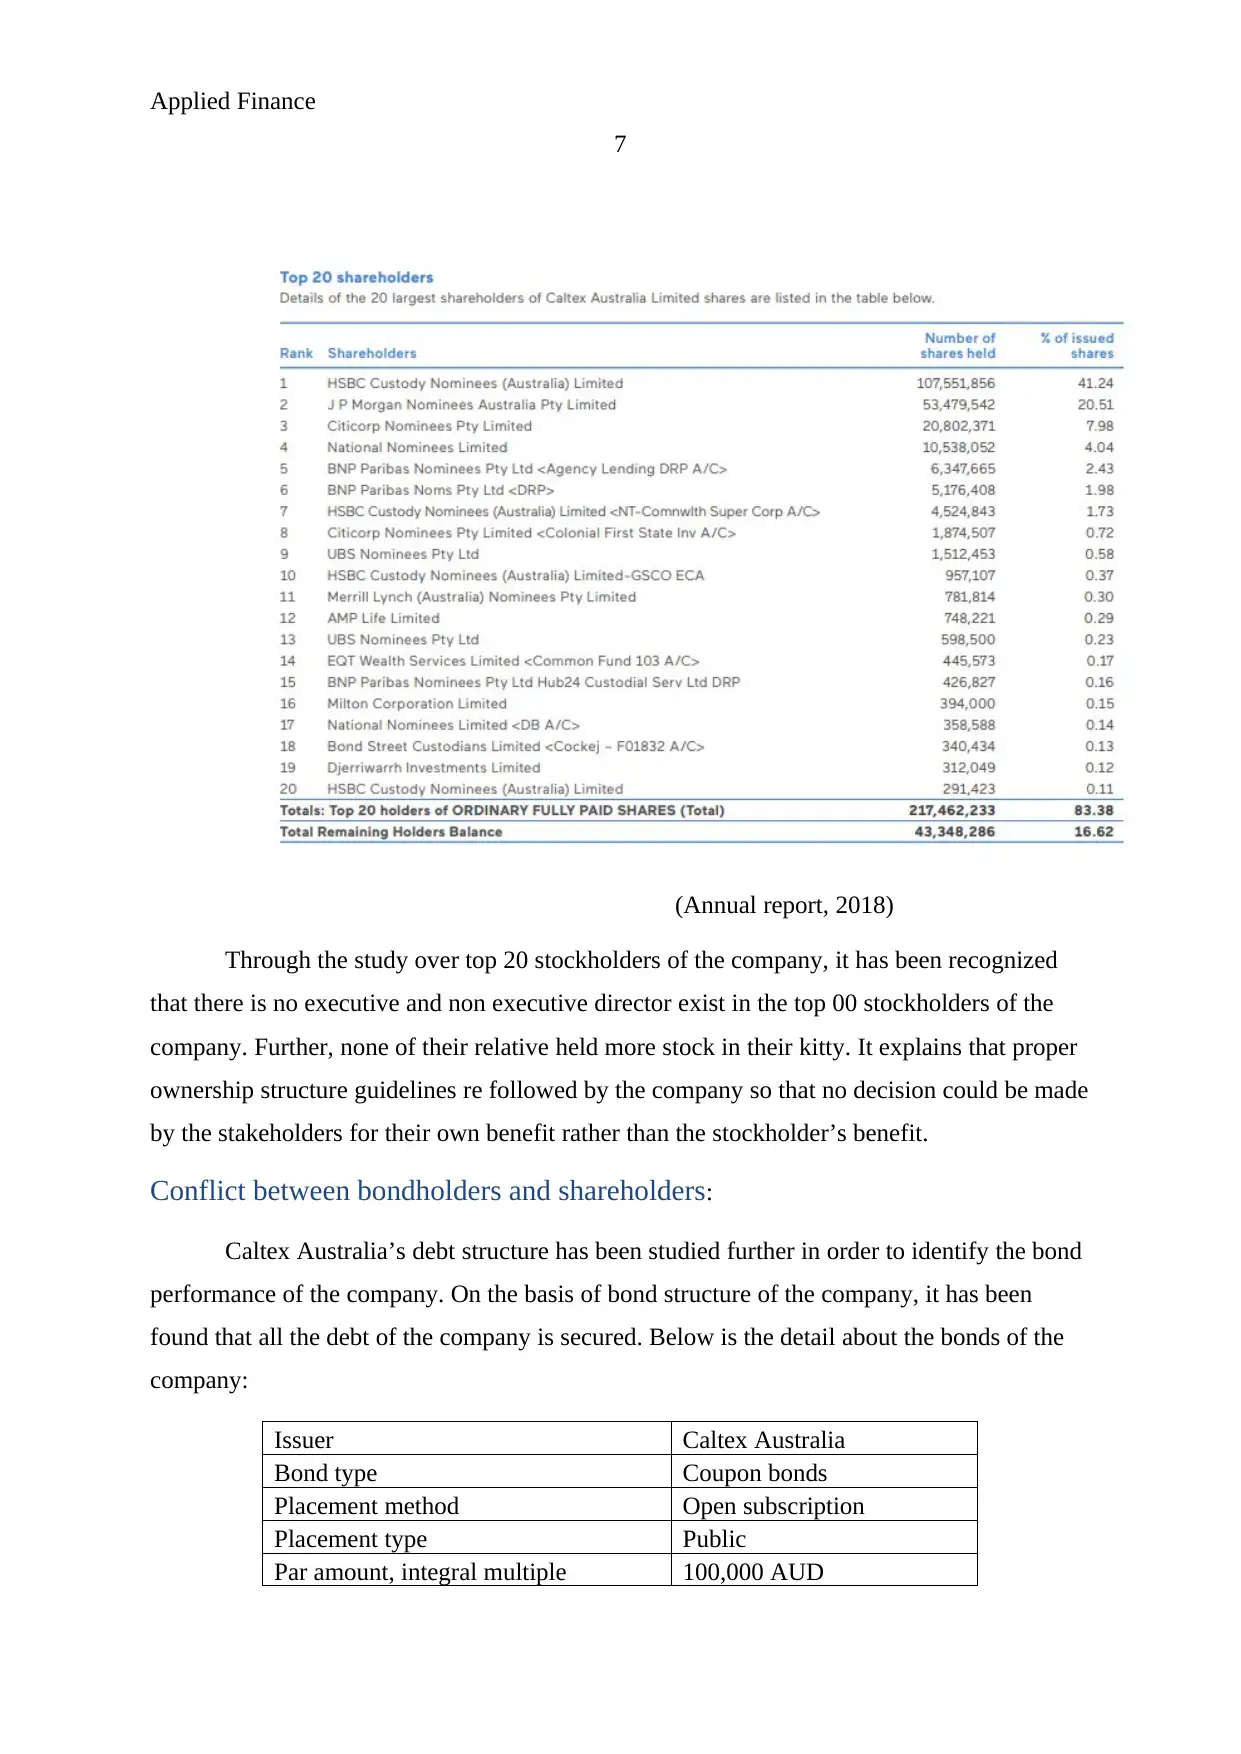
Further, it has been recognized that top 20 stockholders of the company are various
financial institution and Bhang Corporation. They held 83.38% of total stock of the company.
6
Further, it has been investigated that 325,585 shares are held by Julian in the company
which involves the direct interest and indirect interest f the company. Below image describes
about the classification of shares of Julian in the company.
Ownership structure:
The annual report (2018) of company explains that all the directors have stocks of the
company for direct interest and non direct interest. Below is the report of directors along with
the number of shares held by them in last financial year?
(Annual report, 2018)
Further, it has been recognized that top 20 stockholders of the company are various
financial institution and Bhang Corporation. They held 83.38% of total stock of the company.
⊘ This is a preview!⊘
Do you want full access?
Subscribe today to unlock all pages.
Trusted by 1+ million students worldwide
Applied Finance
7
(Annual report, 2018)
Through the study over top 20 stockholders of the company, it has been recognized
that there is no executive and non executive director exist in the top 00 stockholders of the
company. Further, none of their relative held more stock in their kitty. It explains that proper
ownership structure guidelines re followed by the company so that no decision could be made
by the stakeholders for their own benefit rather than the stockholder’s benefit.
Conflict between bondholders and shareholders:
Caltex Australia’s debt structure has been studied further in order to identify the bond
performance of the company. On the basis of bond structure of the company, it has been
found that all the debt of the company is secured. Below is the detail about the bonds of the
company:
Issuer Caltex Australia
Bond type Coupon bonds
Placement method Open subscription
Placement type Public
Par amount, integral multiple 100,000 AUD
Paraphrase This Document
Need a fresh take? Get an instant paraphrase of this document with our AI Paraphraser
Applied Finance
8
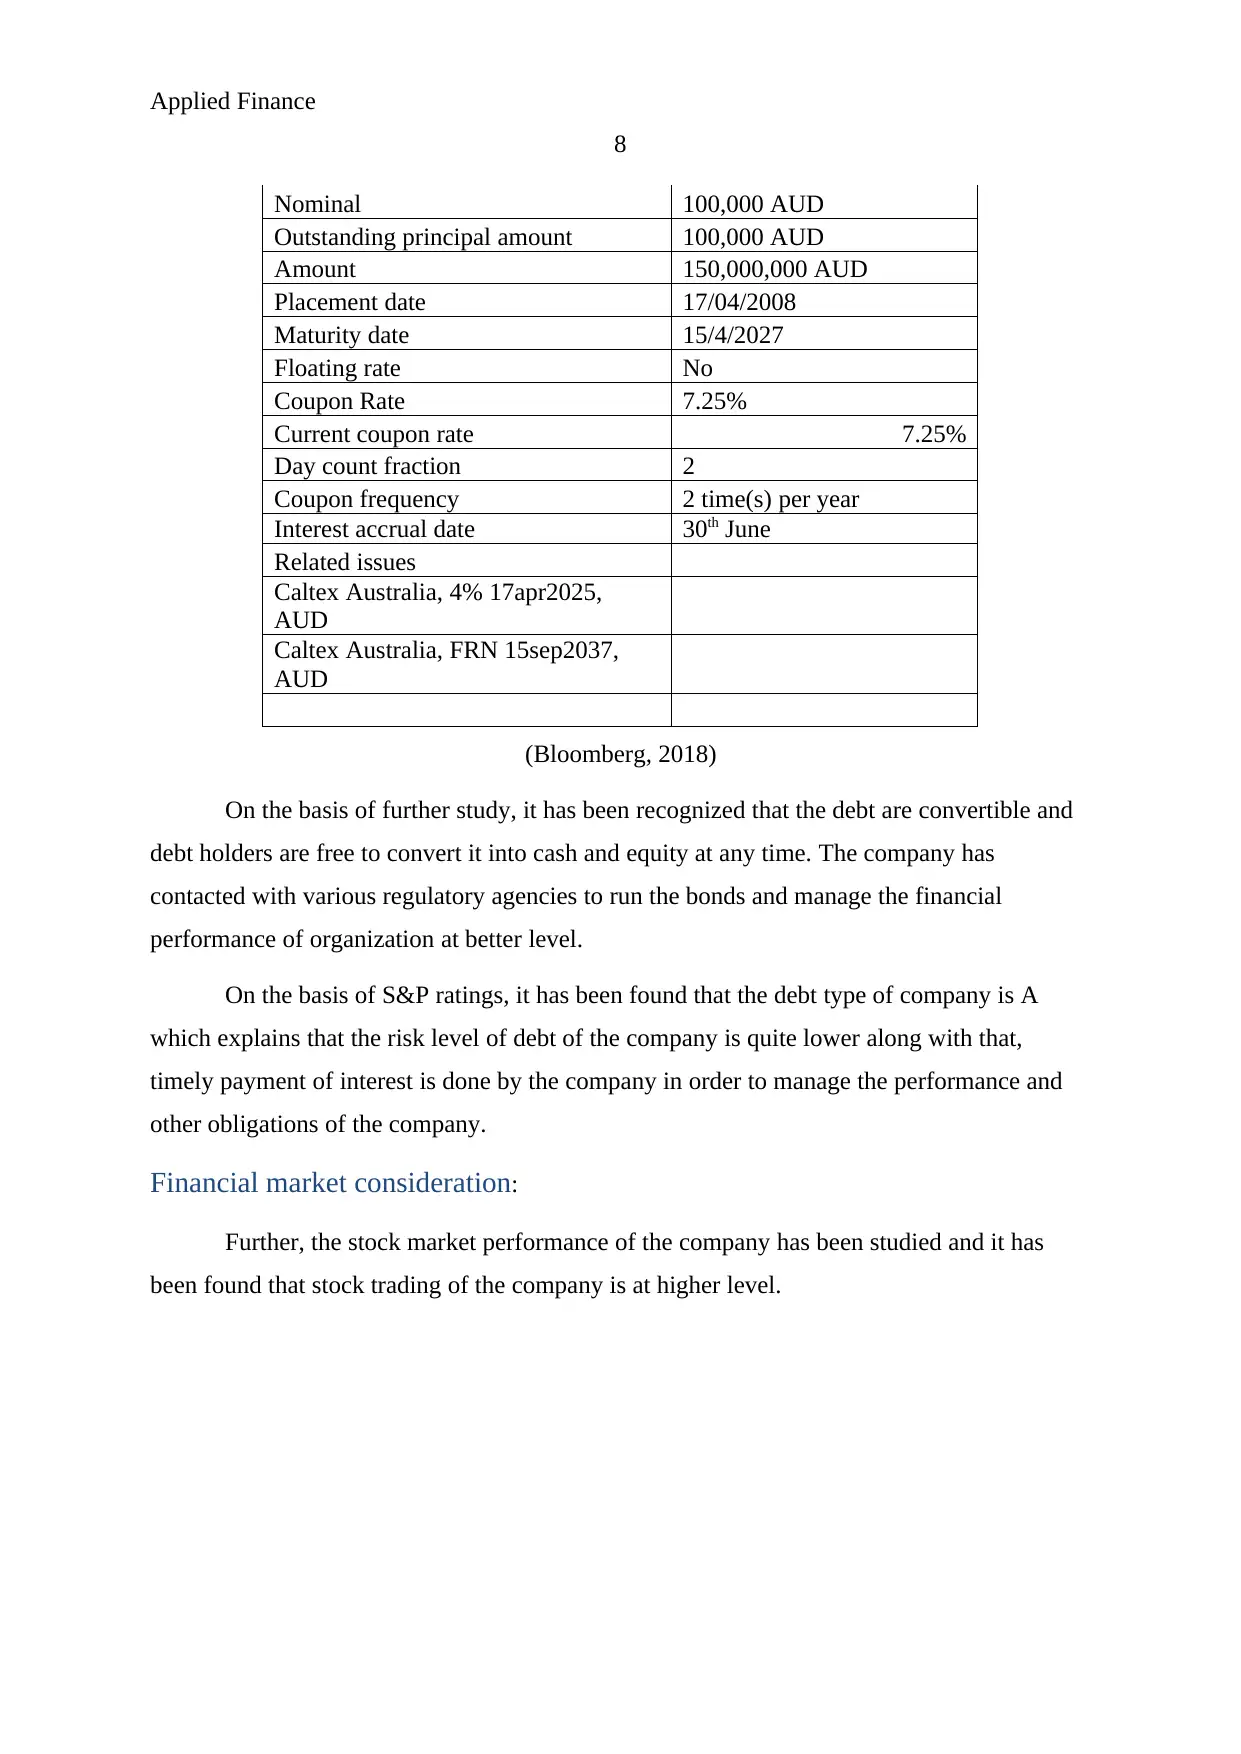
Nominal 100,000 AUD
Outstanding principal amount 100,000 AUD
Amount 150,000,000 AUD
Placement date 17/04/2008
Maturity date 15/4/2027
Floating rate No
Coupon Rate 7.25%
Current coupon rate 7.25%
Day count fraction 2
Coupon frequency 2 time(s) per year
Interest accrual date 30th June
Related issues
Caltex Australia, 4% 17apr2025,
AUD
Caltex Australia, FRN 15sep2037,
AUD
(Bloomberg, 2018)
On the basis of further study, it has been recognized that the debt are convertible and
debt holders are free to convert it into cash and equity at any time. The company has
contacted with various regulatory agencies to run the bonds and manage the financial
performance of organization at better level.
On the basis of S&P ratings, it has been found that the debt type of company is A
which explains that the risk level of debt of the company is quite lower along with that,
timely payment of interest is done by the company in order to manage the performance and
other obligations of the company.
Financial market consideration:
Further, the stock market performance of the company has been studied and it has
been found that stock trading of the company is at higher level.
8
Nominal 100,000 AUD
Outstanding principal amount 100,000 AUD
Amount 150,000,000 AUD
Placement date 17/04/2008
Maturity date 15/4/2027
Floating rate No
Coupon Rate 7.25%
Current coupon rate 7.25%
Day count fraction 2
Coupon frequency 2 time(s) per year
Interest accrual date 30th June
Related issues
Caltex Australia, 4% 17apr2025,
AUD
Caltex Australia, FRN 15sep2037,
AUD
(Bloomberg, 2018)
On the basis of further study, it has been recognized that the debt are convertible and
debt holders are free to convert it into cash and equity at any time. The company has
contacted with various regulatory agencies to run the bonds and manage the financial
performance of organization at better level.
On the basis of S&P ratings, it has been found that the debt type of company is A
which explains that the risk level of debt of the company is quite lower along with that,
timely payment of interest is done by the company in order to manage the performance and
other obligations of the company.
Financial market consideration:
Further, the stock market performance of the company has been studied and it has
been found that stock trading of the company is at higher level.
Applied Finance
9
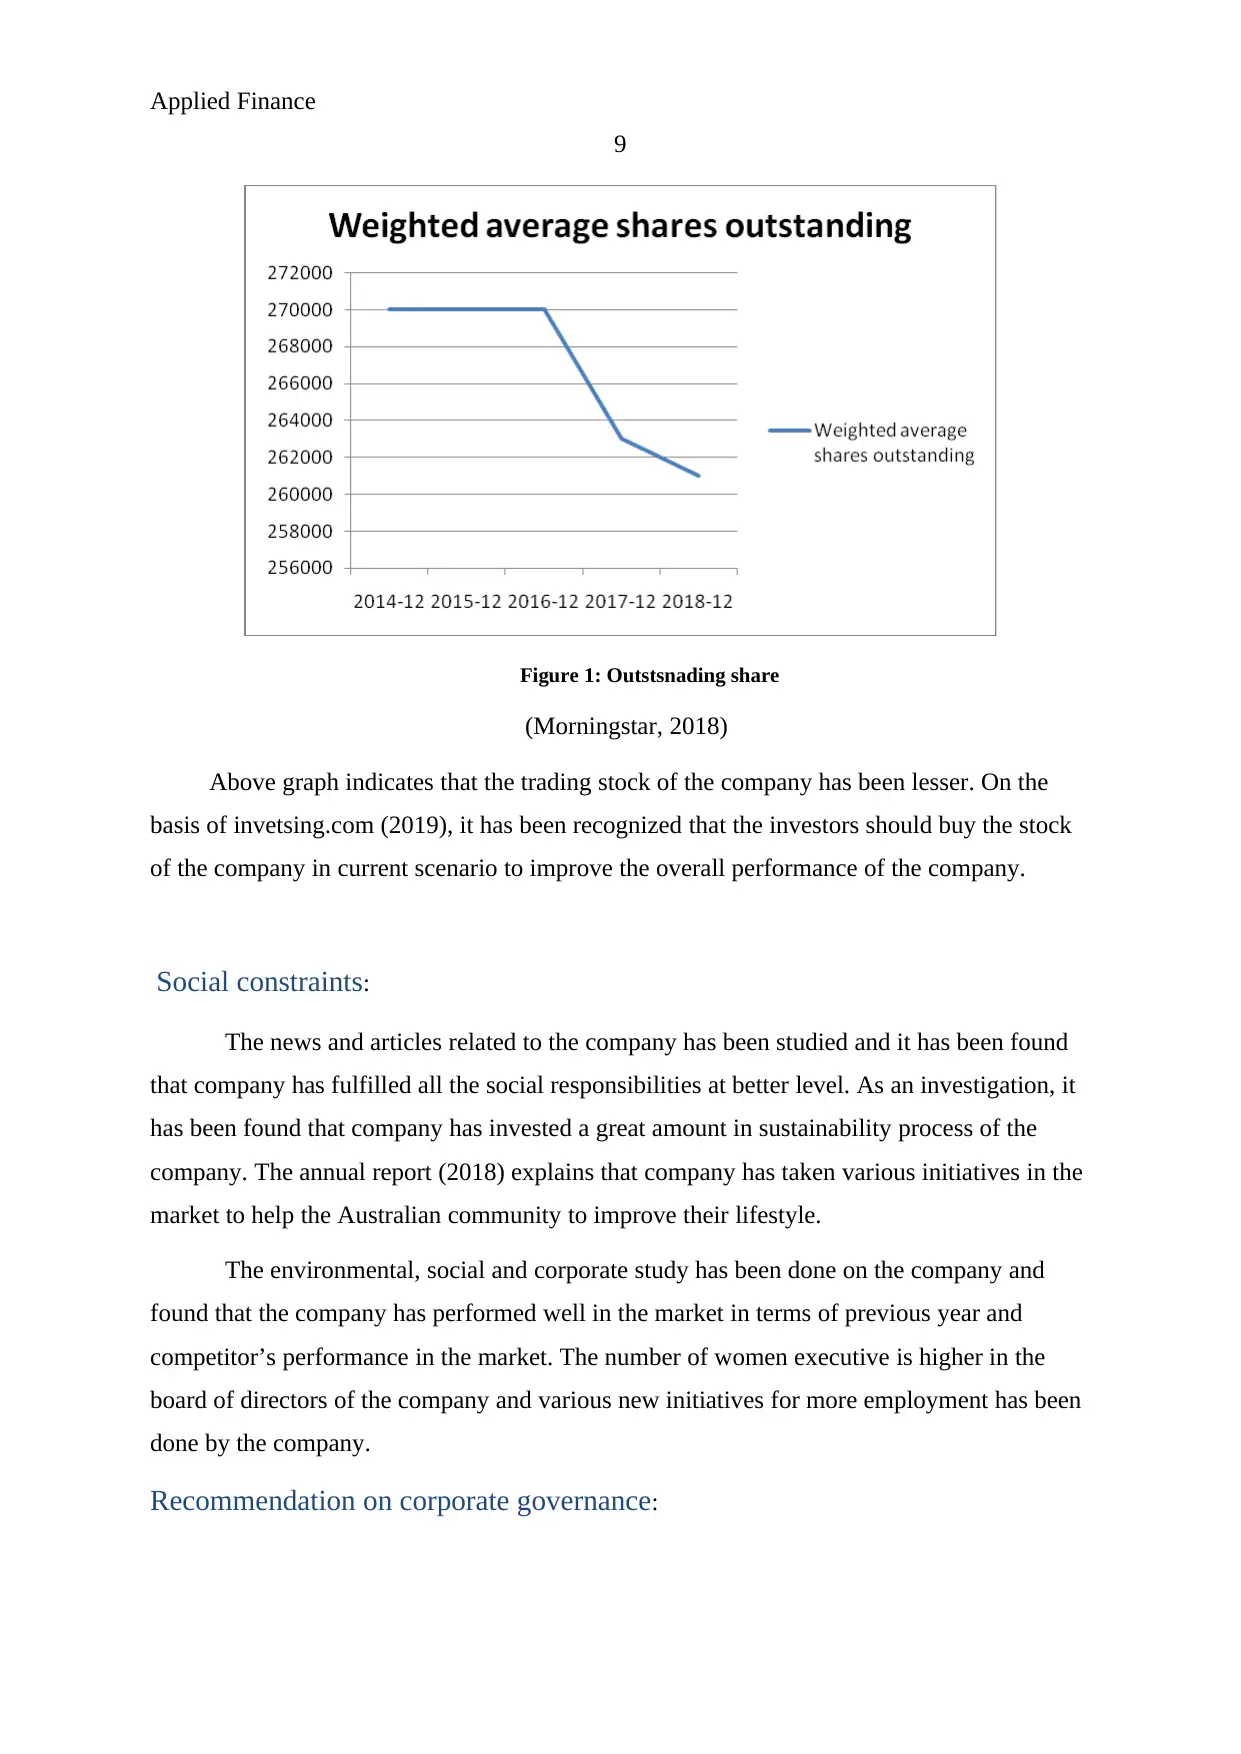
Figure 1: Outstsnading share
(Morningstar, 2018)
Above graph indicates that the trading stock of the company has been lesser. On the
basis of invetsing.com (2019), it has been recognized that the investors should buy the stock
of the company in current scenario to improve the overall performance of the company.
Social constraints:
The news and articles related to the company has been studied and it has been found
that company has fulfilled all the social responsibilities at better level. As an investigation, it
has been found that company has invested a great amount in sustainability process of the
company. The annual report (2018) explains that company has taken various initiatives in the
market to help the Australian community to improve their lifestyle.
The environmental, social and corporate study has been done on the company and
found that the company has performed well in the market in terms of previous year and
competitor’s performance in the market. The number of women executive is higher in the
board of directors of the company and various new initiatives for more employment has been
done by the company.
Recommendation on corporate governance:
9
Figure 1: Outstsnading share
(Morningstar, 2018)
Above graph indicates that the trading stock of the company has been lesser. On the
basis of invetsing.com (2019), it has been recognized that the investors should buy the stock
of the company in current scenario to improve the overall performance of the company.
Social constraints:
The news and articles related to the company has been studied and it has been found
that company has fulfilled all the social responsibilities at better level. As an investigation, it
has been found that company has invested a great amount in sustainability process of the
company. The annual report (2018) explains that company has taken various initiatives in the
market to help the Australian community to improve their lifestyle.
The environmental, social and corporate study has been done on the company and
found that the company has performed well in the market in terms of previous year and
competitor’s performance in the market. The number of women executive is higher in the
board of directors of the company and various new initiatives for more employment has been
done by the company.
Recommendation on corporate governance:
⊘ This is a preview!⊘
Do you want full access?
Subscribe today to unlock all pages.
Trusted by 1+ million students worldwide
Applied Finance
10
On the basis of study over corporate governance of Caltex Australia, it has been found
that few changes in the organization could help the company to improve the management
decision and reduce the agency problem of the company. Further, it is recommended to the
management to improve the stakes in the company to reduce the ownership and governance
issues in the organization.
Risk and return:
Risk and return are the essential factor of an organization. It defines about the total
associated risk with the investment in the company as well as the total return which could be
got by the stakeholders from the company (palicka, 2011). The following analysis has been
done over the stock of Caltex Australia in order to identify the performance of stock of the
company in the market as well as in context with the competitors of the company.
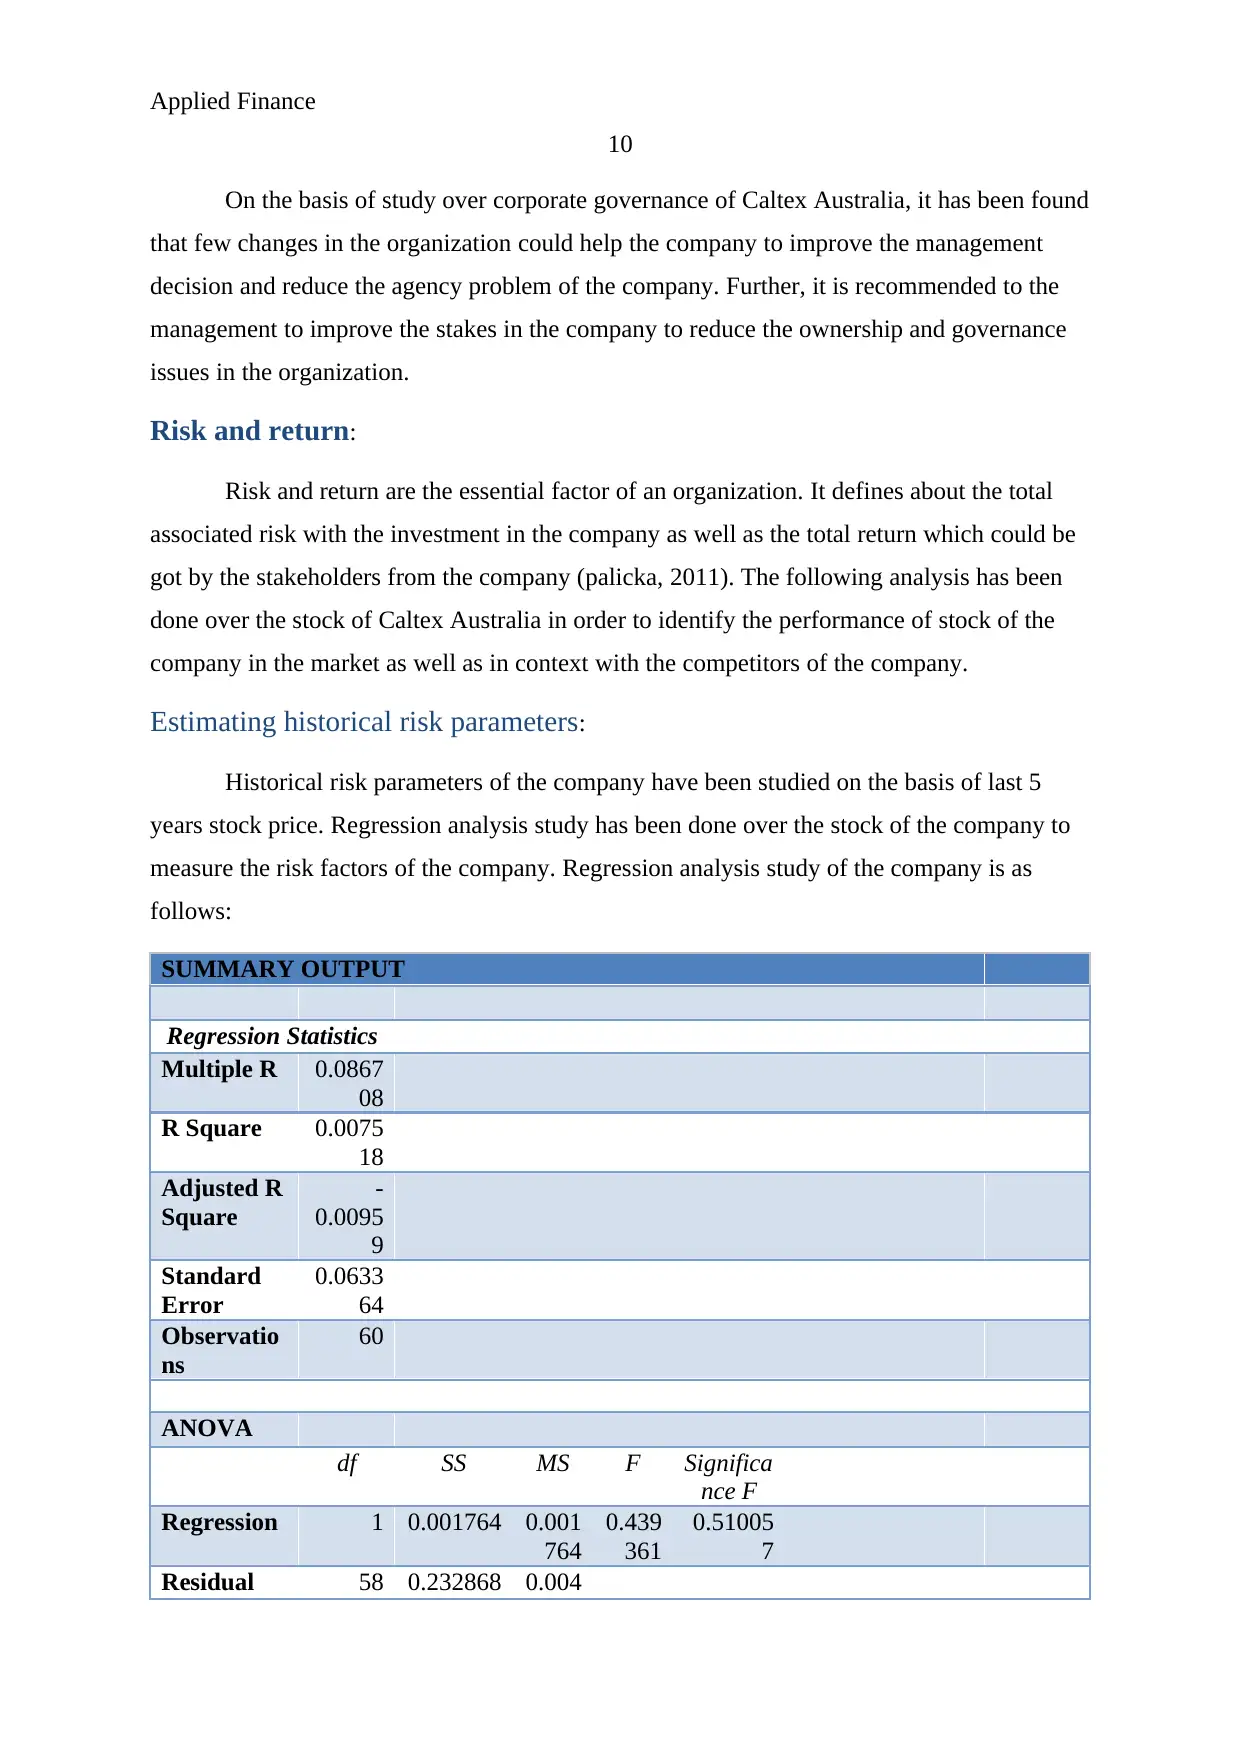
Estimating historical risk parameters:
Historical risk parameters of the company have been studied on the basis of last 5
years stock price. Regression analysis study has been done over the stock of the company to
measure the risk factors of the company. Regression analysis study of the company is as
follows:
SUMMARY OUTPUT
Regression Statistics
Multiple R 0.0867
08
R Square 0.0075
18
Adjusted R
Square
-
0.0095
9
Standard
Error
0.0633
64
Observatio
ns
60
ANOVA
df SS MS F Significa
nce F
Regression 1 0.001764 0.001
764
0.439
361
0.51005
7
Residual 58 0.232868 0.004
10
On the basis of study over corporate governance of Caltex Australia, it has been found
that few changes in the organization could help the company to improve the management
decision and reduce the agency problem of the company. Further, it is recommended to the
management to improve the stakes in the company to reduce the ownership and governance
issues in the organization.
Risk and return:
Risk and return are the essential factor of an organization. It defines about the total
associated risk with the investment in the company as well as the total return which could be
got by the stakeholders from the company (palicka, 2011). The following analysis has been
done over the stock of Caltex Australia in order to identify the performance of stock of the
company in the market as well as in context with the competitors of the company.
Estimating historical risk parameters:
Historical risk parameters of the company have been studied on the basis of last 5
years stock price. Regression analysis study has been done over the stock of the company to
measure the risk factors of the company. Regression analysis study of the company is as
follows:
SUMMARY OUTPUT
Regression Statistics
Multiple R 0.0867
08
R Square 0.0075
18
Adjusted R
Square
-
0.0095
9
Standard
Error
0.0633
64
Observatio
ns
60
ANOVA
df SS MS F Significa
nce F
Regression 1 0.001764 0.001
764
0.439
361
0.51005
7
Residual 58 0.232868 0.004
Paraphrase This Document
Need a fresh take? Get an instant paraphrase of this document with our AI Paraphraser
Applied Finance
11
015
Total 59 0.234632
Coeffic
ients
Standard
Error
t Stat P-
value
Lower
95%
Upper
95%
Lower
95.0%
Upper
95.0%
Intercept 0.0069
05
0.008313 0.830
57
0.409
622
-0.00974 0.0235
46
-
0.00974
0.02354
6
X Variable
1
0.1647
06
0.248484 0.662
843
0.510
057
-0.33269 0.6621 -
0.33269
0.6621
(Yahoo finance, 2019)
On the basis of regression analysis study over Caltex Australia, it has been found that
standard risk of the company is 0.16 which is lesser then 1 and indicates that the volatility in
the stock of the company is lesser then the market index stock price. It further defines that the
associated risk with the company is quite lesser (ASX, 2019). In the last 5 years, the stock
performance of the company has been improved along with the less volatility in the stock
price.
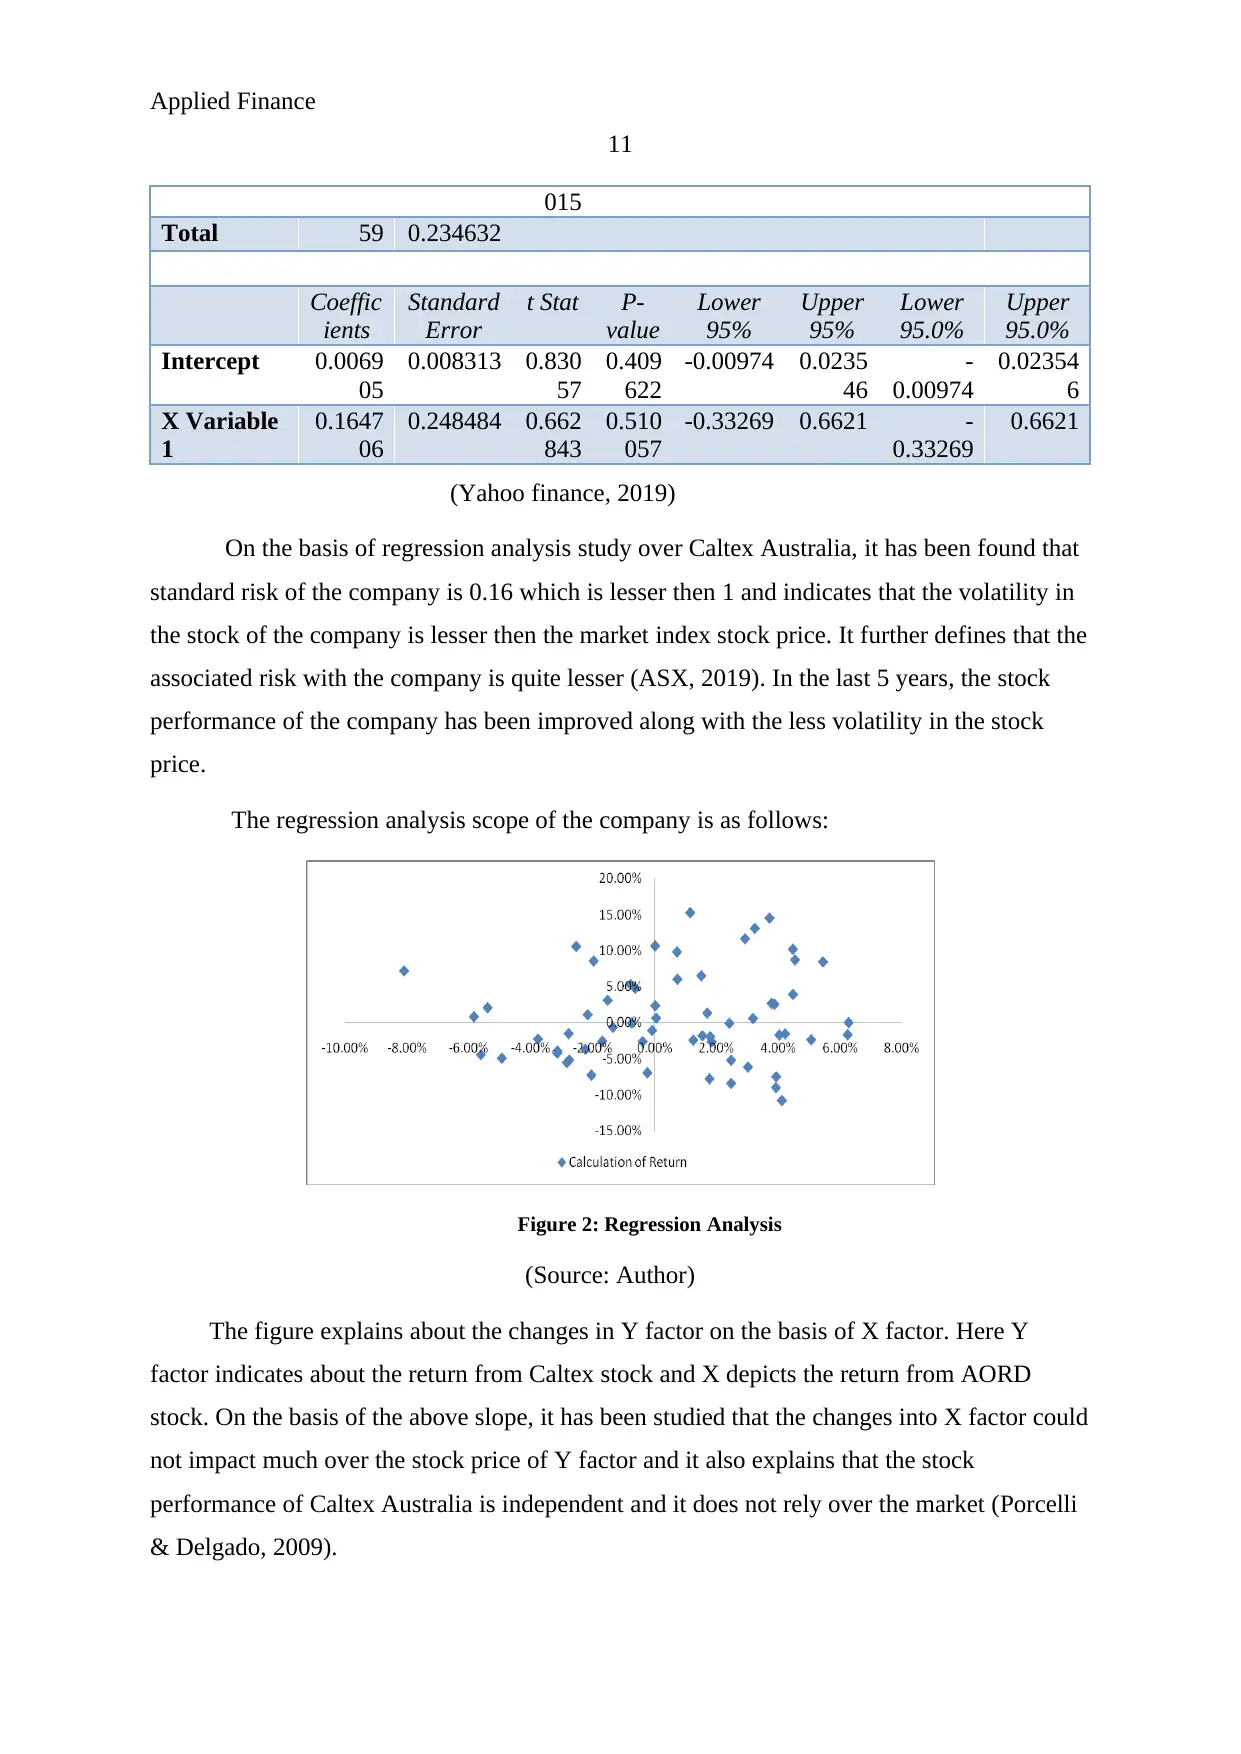
The regression analysis scope of the company is as follows:
Figure 2: Regression Analysis
(Source: Author)
The figure explains about the changes in Y factor on the basis of X factor. Here Y
factor indicates about the return from Caltex stock and X depicts the return from AORD
stock. On the basis of the above slope, it has been studied that the changes into X factor could
not impact much over the stock price of Y factor and it also explains that the stock
performance of Caltex Australia is independent and it does not rely over the market (Porcelli
& Delgado, 2009).
11
015
Total 59 0.234632
Coeffic
ients
Standard
Error
t Stat P-
value
Lower
95%
Upper
95%
Lower
95.0%
Upper
95.0%
Intercept 0.0069
05
0.008313 0.830
57
0.409
622
-0.00974 0.0235
46
-
0.00974
0.02354
6
X Variable
1
0.1647
06
0.248484 0.662
843
0.510
057
-0.33269 0.6621 -
0.33269
0.6621
(Yahoo finance, 2019)
On the basis of regression analysis study over Caltex Australia, it has been found that
standard risk of the company is 0.16 which is lesser then 1 and indicates that the volatility in
the stock of the company is lesser then the market index stock price. It further defines that the
associated risk with the company is quite lesser (ASX, 2019). In the last 5 years, the stock
performance of the company has been improved along with the less volatility in the stock
price.
The regression analysis scope of the company is as follows:
Figure 2: Regression Analysis
(Source: Author)
The figure explains about the changes in Y factor on the basis of X factor. Here Y
factor indicates about the return from Caltex stock and X depicts the return from AORD
stock. On the basis of the above slope, it has been studied that the changes into X factor could
not impact much over the stock price of Y factor and it also explains that the stock
performance of Caltex Australia is independent and it does not rely over the market (Porcelli
& Delgado, 2009).
Applied Finance
12
Further, the beta risk of the company is 0.16 which is lesser then 1 and indicates that
the volatility in the stock of the company is lesser then the market index stock price. On the
basis of the study, it has been found that the risk level of company is attributed to the
industrial and economical factors of the country (Madura, 2014). The overall performance of
the comapny depends on the industry and hence, minor changes into the industry directly
impacts over the stock price of the company. It is important for the investors to identify the
type of risk attributed to the stock in order to measure the overall performance of stock and
prepared a better portfolio.
Overall, risk of the company depends upon the business. In terms of financial
leverage, it has been found that the company has managed the performance at great extent
and no financial leverage risk has been attributed in the company.
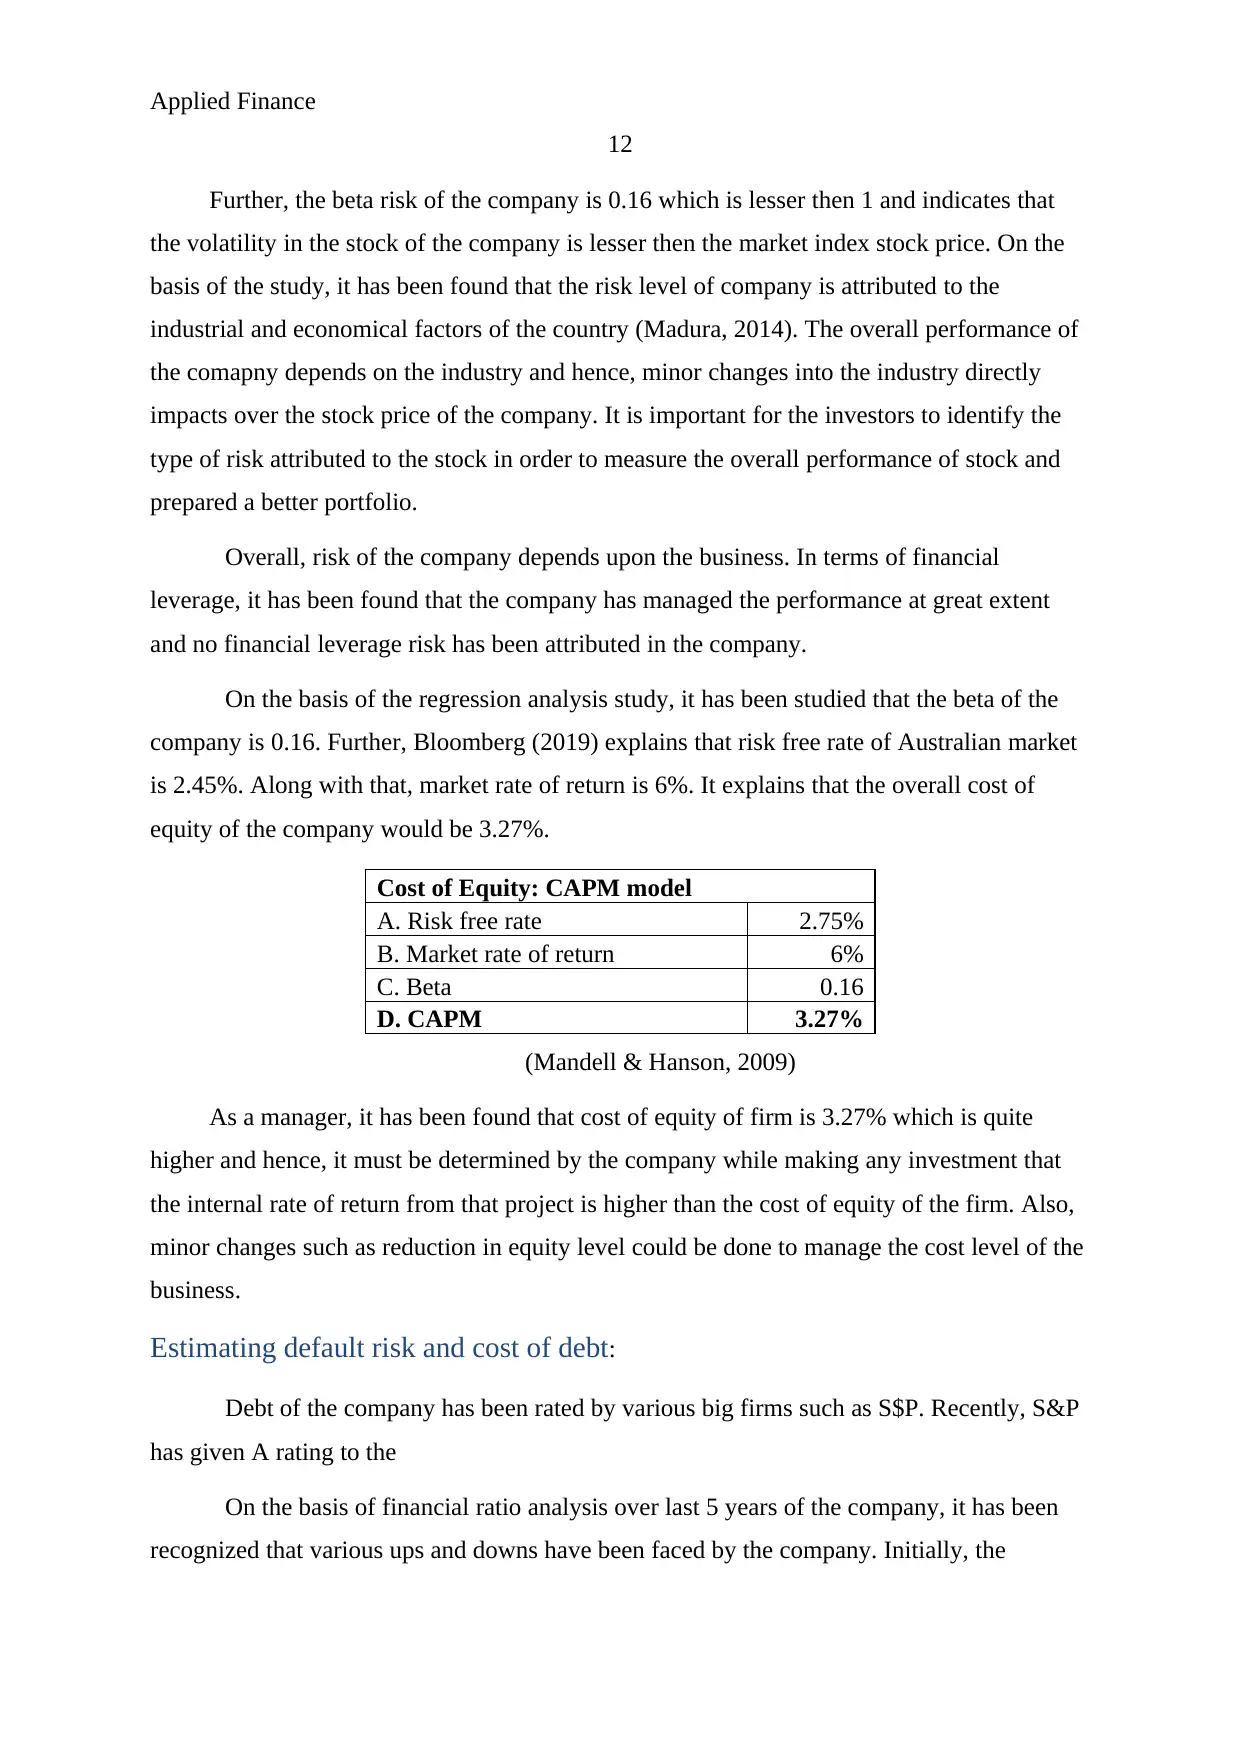
On the basis of the regression analysis study, it has been studied that the beta of the
company is 0.16. Further, Bloomberg (2019) explains that risk free rate of Australian market
is 2.45%. Along with that, market rate of return is 6%. It explains that the overall cost of
equity of the company would be 3.27%.
Cost of Equity: CAPM model
A. Risk free rate 2.75%
B. Market rate of return 6%
C. Beta 0.16
D. CAPM 3.27%
(Mandell & Hanson, 2009)
As a manager, it has been found that cost of equity of firm is 3.27% which is quite
higher and hence, it must be determined by the company while making any investment that
the internal rate of return from that project is higher than the cost of equity of the firm. Also,
minor changes such as reduction in equity level could be done to manage the cost level of the
business.
Estimating default risk and cost of debt:
Debt of the company has been rated by various big firms such as S$P. Recently, S&P
has given A rating to the
On the basis of financial ratio analysis over last 5 years of the company, it has been
recognized that various ups and downs have been faced by the company. Initially, the
12
Further, the beta risk of the company is 0.16 which is lesser then 1 and indicates that
the volatility in the stock of the company is lesser then the market index stock price. On the
basis of the study, it has been found that the risk level of company is attributed to the
industrial and economical factors of the country (Madura, 2014). The overall performance of
the comapny depends on the industry and hence, minor changes into the industry directly
impacts over the stock price of the company. It is important for the investors to identify the
type of risk attributed to the stock in order to measure the overall performance of stock and
prepared a better portfolio.
Overall, risk of the company depends upon the business. In terms of financial
leverage, it has been found that the company has managed the performance at great extent
and no financial leverage risk has been attributed in the company.
On the basis of the regression analysis study, it has been studied that the beta of the
company is 0.16. Further, Bloomberg (2019) explains that risk free rate of Australian market
is 2.45%. Along with that, market rate of return is 6%. It explains that the overall cost of
equity of the company would be 3.27%.
Cost of Equity: CAPM model
A. Risk free rate 2.75%
B. Market rate of return 6%
C. Beta 0.16
D. CAPM 3.27%
(Mandell & Hanson, 2009)
As a manager, it has been found that cost of equity of firm is 3.27% which is quite
higher and hence, it must be determined by the company while making any investment that
the internal rate of return from that project is higher than the cost of equity of the firm. Also,
minor changes such as reduction in equity level could be done to manage the cost level of the
business.
Estimating default risk and cost of debt:
Debt of the company has been rated by various big firms such as S$P. Recently, S&P
has given A rating to the
On the basis of financial ratio analysis over last 5 years of the company, it has been
recognized that various ups and downs have been faced by the company. Initially, the
⊘ This is a preview!⊘
Do you want full access?
Subscribe today to unlock all pages.
Trusted by 1+ million students worldwide
1 out of 33
Related Documents


Your All-in-One AI-Powered Toolkit for Academic Success.
+13062052269
info@desklib.com
Available 24*7 on WhatsApp / Email
![[object Object]](/_next/static/media/star-bottom.7253800d.svg)
Unlock your academic potential
Copyright © 2020–2026 A2Z Services. All Rights Reserved. Developed and managed by ZUCOL.