Analyzing Financial Performance of Caltex Australia Ltd.
VerifiedAdded on 2020/05/28
|29
|2996
|73
AI Summary
This assignment requires students to perform an in-depth financial analysis comparing the performance of Caltex Australia Ltd. and Origin Energy Limited over a three-year period (2014-2016). The task involves analyzing key financial documents such as income statements, balance sheets, and cash flow statements. Students must also compute and compare various liquidity ratios including current ratio, quick ratio, and cash ratio for both companies. Additionally, the assignment demands the creation of horizontal analysis tables to identify significant trends or changes in financial metrics over the specified period. This comparative study aims to highlight differences in financial performance, operational efficiency, and strategic positioning between Caltex Australia Ltd. and Origin Energy Limited.
Running head: ACCOUNTING FOR BUSINESS
Accounting for Business
Name of the Student:
Name of the University:
Author’s Note:
Course ID:
Accounting for Business
Name of the Student:
Name of the University:
Author’s Note:
Course ID:
Paraphrase This Document
Need a fresh take? Get an instant paraphrase of this document with our AI Paraphraser
1ACCOUNTING FOR BUSINESS
Executive Summary:
The current report aims to evaluate the financial statements of Caltex Australia Limited
with the help of horizontal and ratio analyses for three years ranging from 2014 to 2016. In order
to enhance the quality of analysis, Origin Energy Limited is chosen as the competitor to gain an
insight of the competitive position of Caltex Australia Limited in the Australian energy sector. It
could be stated that in terms of profitability, liquidity and rate of return, Caltex is enjoying
competitive advantage over Origin Energy in the Australian energy sector. In addition, based on
the Australian regulations, the company develops its ethical standards by conforming to a greater
degree of business risks. Thus, the investors are recommended to invest in the shares of Caltex
for maximising their overall return on investment.
2ACCOUNTING FOR BUSINESS
Table of Contents
1. Introduction:................................................................................................................................3
2. Annual report analysis:................................................................................................................3
a. Profit and loss analysis:...........................................................................................................3
b. Balance sheet analysis:............................................................................................................5
c. Cash flow statement analysis:..................................................................................................6
3. Ratio analysis:..............................................................................................................................7
a. Profitability analysis:...............................................................................................................7
b. Efficiency analysis:..................................................................................................................9
c. Liquidity analysis:..................................................................................................................10
d. Rate of return:........................................................................................................................12
4. Corporate governance and ethical standard:..............................................................................14
a. Code of conduct:....................................................................................................................14
b. Approach of the manager to the risks:...................................................................................14
5. Conclusion:................................................................................................................................14
References and Bibliographies:.....................................................................................................16
Appendices:...................................................................................................................................18
⊘ This is a preview!⊘
Do you want full access?
Subscribe today to unlock all pages.
Trusted by 1+ million students worldwide
3ACCOUNTING FOR BUSINESS
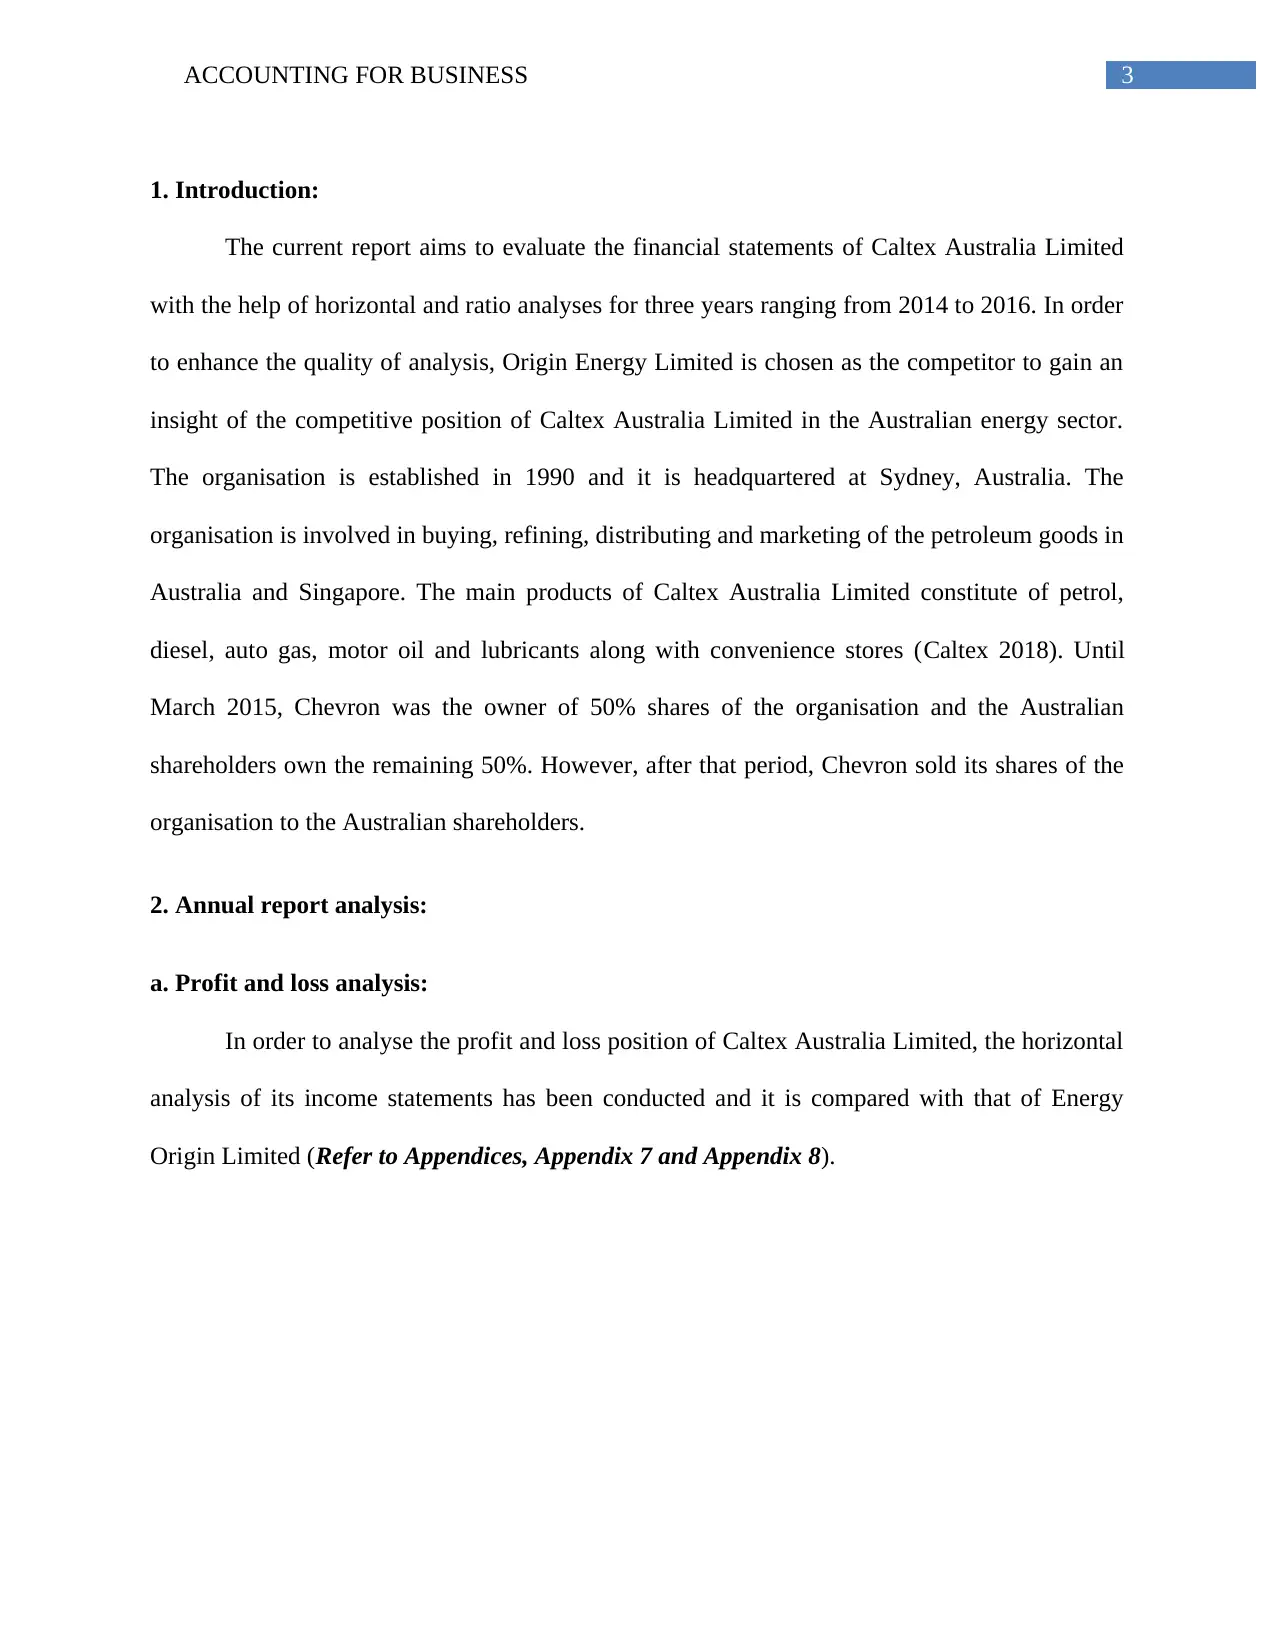
1. Introduction:
The current report aims to evaluate the financial statements of Caltex Australia Limited
with the help of horizontal and ratio analyses for three years ranging from 2014 to 2016. In order
to enhance the quality of analysis, Origin Energy Limited is chosen as the competitor to gain an
insight of the competitive position of Caltex Australia Limited in the Australian energy sector.
The organisation is established in 1990 and it is headquartered at Sydney, Australia. The
organisation is involved in buying, refining, distributing and marketing of the petroleum goods in
Australia and Singapore. The main products of Caltex Australia Limited constitute of petrol,
diesel, auto gas, motor oil and lubricants along with convenience stores (Caltex 2018). Until
March 2015, Chevron was the owner of 50% shares of the organisation and the Australian
shareholders own the remaining 50%. However, after that period, Chevron sold its shares of the
organisation to the Australian shareholders.
2. Annual report analysis:
a. Profit and loss analysis:
In order to analyse the profit and loss position of Caltex Australia Limited, the horizontal
analysis of its income statements has been conducted and it is compared with that of Energy
Origin Limited (Refer to Appendices, Appendix 7 and Appendix 8).
Paraphrase This Document
Need a fresh take? Get an instant paraphrase of this document with our AI Paraphraser
4ACCOUNTING FOR BUSINESS
% change
in 2015 % change
in 2016 % change
in 2015 % change
in 2016
Caltex Australia
Limited Origin Energy
Limited
-2000.00%
-1500.00%
-1000.00%
-500.00%
0.00%
500.00%
1000.00%
1500.00%
2000.00%
2500.00%
3000.00%
Percent change in gross profit,
operating expenses and net income
Gross profit
Total operating expenses
Net income
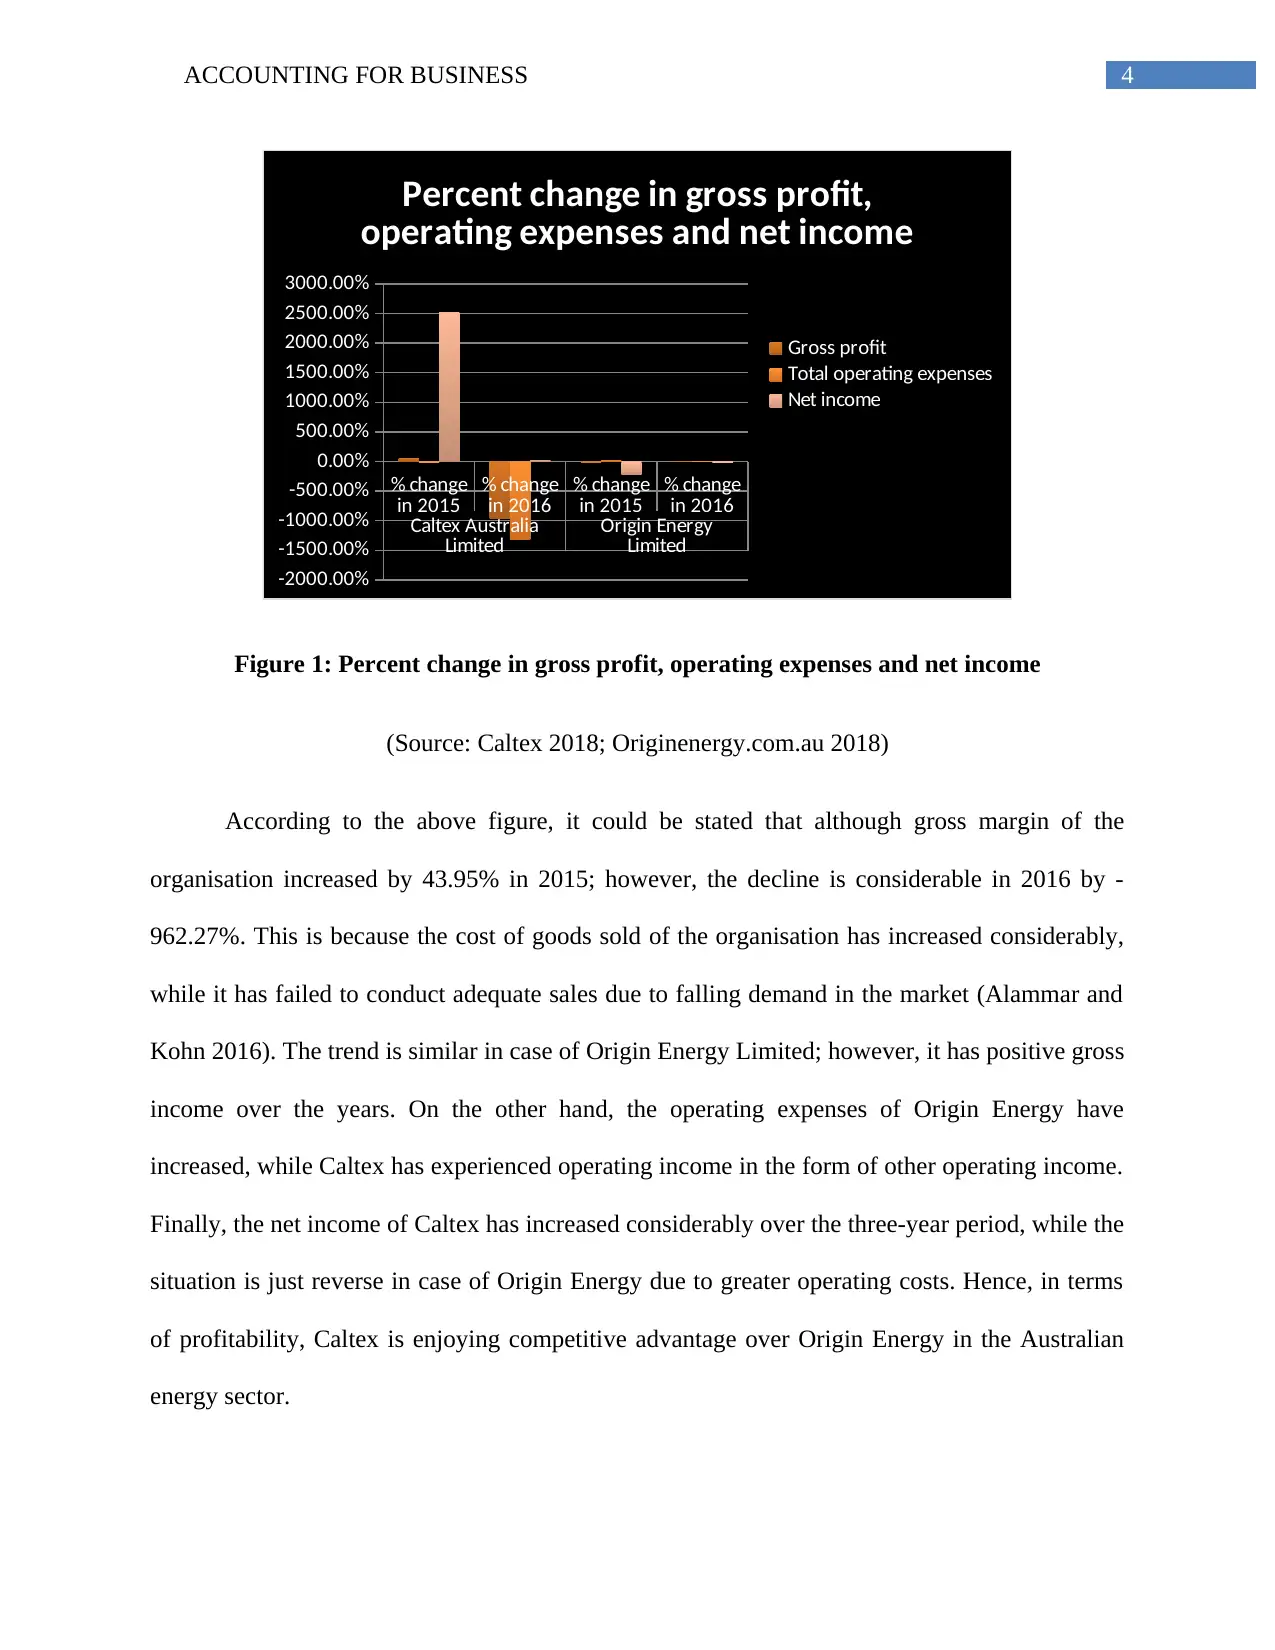
Figure 1: Percent change in gross profit, operating expenses and net income
(Source: Caltex 2018; Originenergy.com.au 2018)
According to the above figure, it could be stated that although gross margin of the
organisation increased by 43.95% in 2015; however, the decline is considerable in 2016 by -
962.27%. This is because the cost of goods sold of the organisation has increased considerably,
while it has failed to conduct adequate sales due to falling demand in the market (Alammar and
Kohn 2016). The trend is similar in case of Origin Energy Limited; however, it has positive gross
income over the years. On the other hand, the operating expenses of Origin Energy have
increased, while Caltex has experienced operating income in the form of other operating income.
Finally, the net income of Caltex has increased considerably over the three-year period, while the
situation is just reverse in case of Origin Energy due to greater operating costs. Hence, in terms
of profitability, Caltex is enjoying competitive advantage over Origin Energy in the Australian
energy sector.
% change
in 2015 % change
in 2016 % change
in 2015 % change
in 2016
Caltex Australia
Limited Origin Energy
Limited
-2000.00%
-1500.00%
-1000.00%
-500.00%
0.00%
500.00%
1000.00%
1500.00%
2000.00%
2500.00%
3000.00%
Percent change in gross profit,
operating expenses and net income
Gross profit
Total operating expenses
Net income
Figure 1: Percent change in gross profit, operating expenses and net income
(Source: Caltex 2018; Originenergy.com.au 2018)
According to the above figure, it could be stated that although gross margin of the
organisation increased by 43.95% in 2015; however, the decline is considerable in 2016 by -
962.27%. This is because the cost of goods sold of the organisation has increased considerably,
while it has failed to conduct adequate sales due to falling demand in the market (Alammar and
Kohn 2016). The trend is similar in case of Origin Energy Limited; however, it has positive gross
income over the years. On the other hand, the operating expenses of Origin Energy have
increased, while Caltex has experienced operating income in the form of other operating income.
Finally, the net income of Caltex has increased considerably over the three-year period, while the
situation is just reverse in case of Origin Energy due to greater operating costs. Hence, in terms
of profitability, Caltex is enjoying competitive advantage over Origin Energy in the Australian
energy sector.
5ACCOUNTING FOR BUSINESS
b. Balance sheet analysis:
In order to analyse the financial position of Caltex Australia Limited, the horizontal
analysis of its balance sheet statements has been conducted and it is compared with that of
Energy Origin Limited (Refer to Appendices, Appendix 9 and Appendix 10).
% change
in 2015 % change
in 2016 % change
in 2015 % change
in 2016
Caltex Australia
Limited Origin Energy Limited
-40.00%
-30.00%
-20.00%
-10.00%
0.00%
10.00%
20.00%
Percent change in total assets, total
liabilities and total equity
Total assets
Total liabilities
Total Stockholders' equity
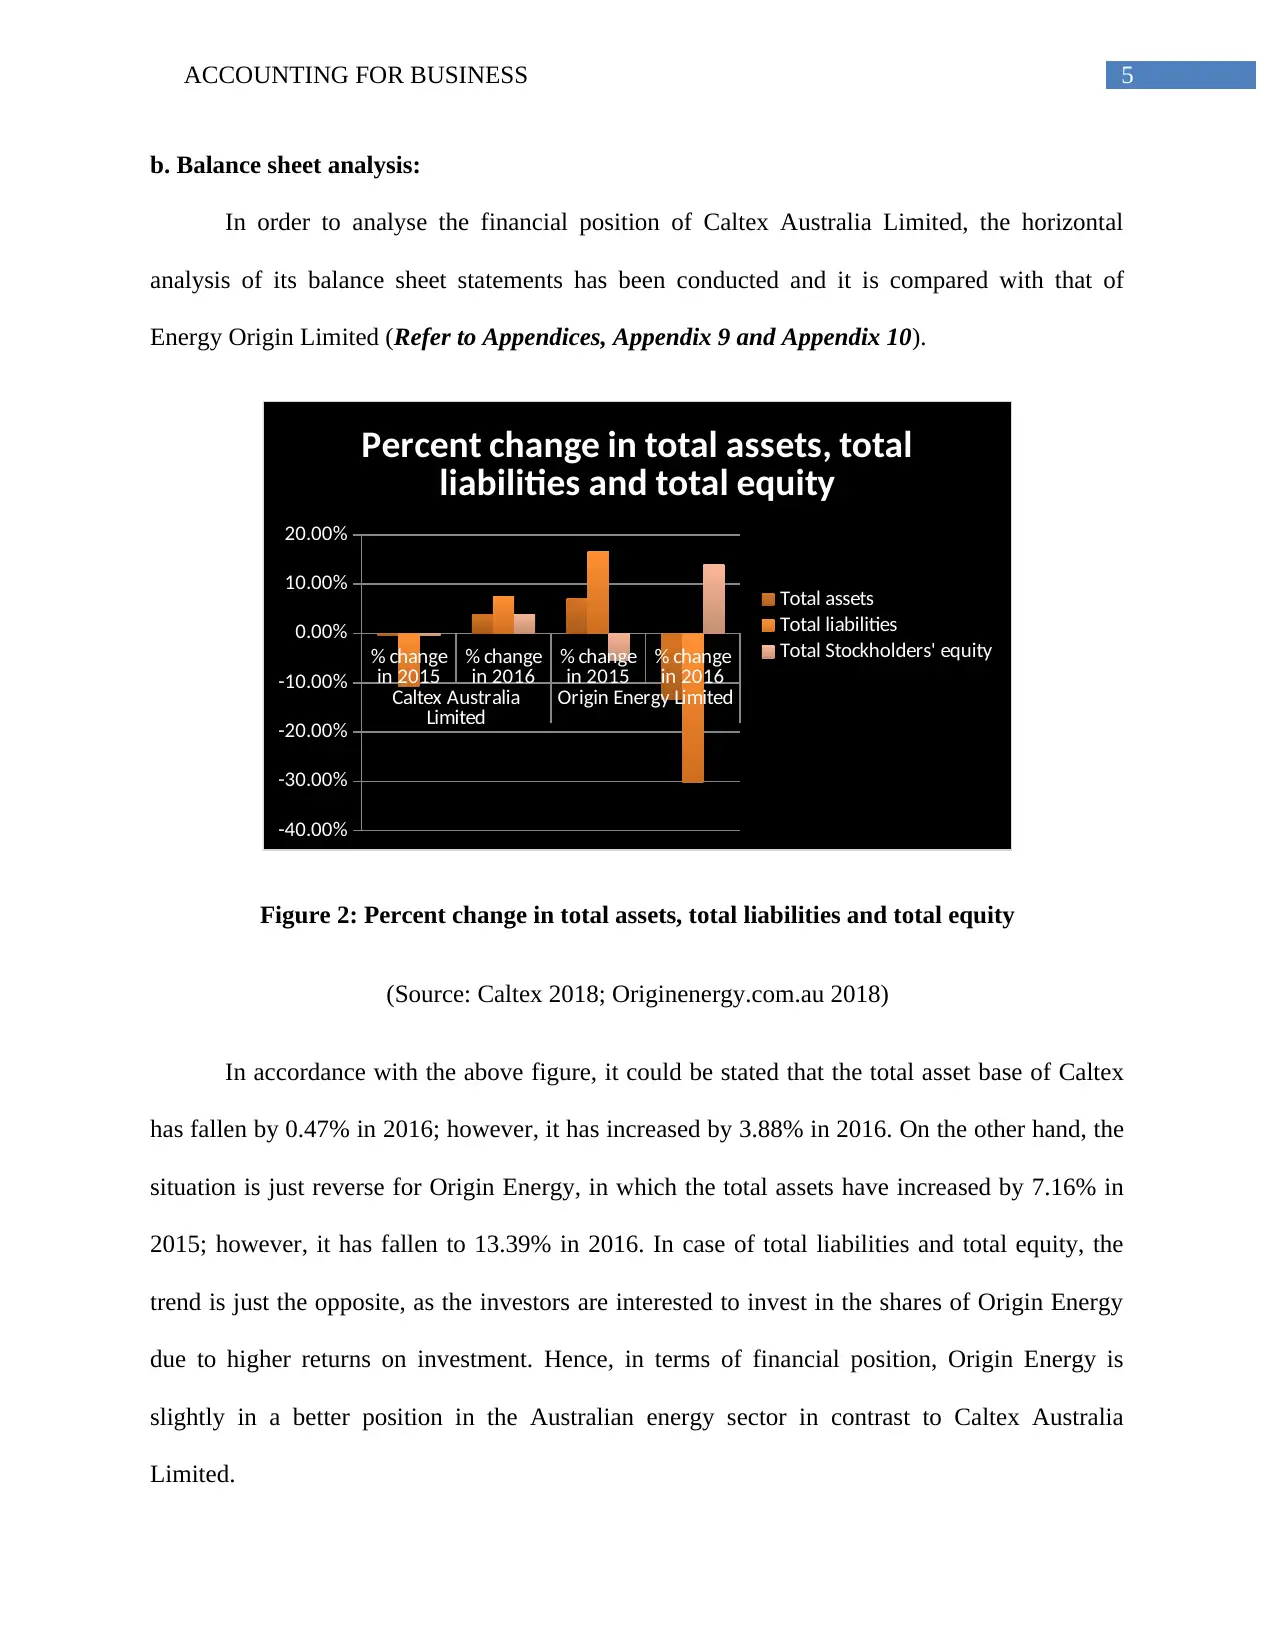
Figure 2: Percent change in total assets, total liabilities and total equity
(Source: Caltex 2018; Originenergy.com.au 2018)
In accordance with the above figure, it could be stated that the total asset base of Caltex
has fallen by 0.47% in 2016; however, it has increased by 3.88% in 2016. On the other hand, the
situation is just reverse for Origin Energy, in which the total assets have increased by 7.16% in
2015; however, it has fallen to 13.39% in 2016. In case of total liabilities and total equity, the
trend is just the opposite, as the investors are interested to invest in the shares of Origin Energy
due to higher returns on investment. Hence, in terms of financial position, Origin Energy is
slightly in a better position in the Australian energy sector in contrast to Caltex Australia
Limited.
b. Balance sheet analysis:
In order to analyse the financial position of Caltex Australia Limited, the horizontal
analysis of its balance sheet statements has been conducted and it is compared with that of
Energy Origin Limited (Refer to Appendices, Appendix 9 and Appendix 10).
% change
in 2015 % change
in 2016 % change
in 2015 % change
in 2016
Caltex Australia
Limited Origin Energy Limited
-40.00%
-30.00%
-20.00%
-10.00%
0.00%
10.00%
20.00%
Percent change in total assets, total
liabilities and total equity
Total assets
Total liabilities
Total Stockholders' equity
Figure 2: Percent change in total assets, total liabilities and total equity
(Source: Caltex 2018; Originenergy.com.au 2018)
In accordance with the above figure, it could be stated that the total asset base of Caltex
has fallen by 0.47% in 2016; however, it has increased by 3.88% in 2016. On the other hand, the
situation is just reverse for Origin Energy, in which the total assets have increased by 7.16% in
2015; however, it has fallen to 13.39% in 2016. In case of total liabilities and total equity, the
trend is just the opposite, as the investors are interested to invest in the shares of Origin Energy
due to higher returns on investment. Hence, in terms of financial position, Origin Energy is
slightly in a better position in the Australian energy sector in contrast to Caltex Australia
Limited.
⊘ This is a preview!⊘
Do you want full access?
Subscribe today to unlock all pages.
Trusted by 1+ million students worldwide
6ACCOUNTING FOR BUSINESS
c. Cash flow statement analysis:
In order to analyse the financial position of Caltex Australia Limited, the horizontal
analysis of its cash flow statements has been conducted and it is compared with that of Energy
Origin Limited (Refer to Appendices, Appendix 11 and Appendix 12).
Net cash
provided by
operating
activities
Net cash used
for investing
activities
Net cash
provided by
(used for)
financing
activities
Net change in
cash
-200.00%
-150.00%
-100.00%
-50.00%
0.00%
50.00%
100.00%
150.00%
200.00%
250.00%
300.00%
Percent change in items of cash flow statement
Caltex Australia Limited % change
in 2015
Caltex Australia Limited % change
in 2016
Origin Energy Limited % change in
2015
Origin Energy Limited % change in
2016
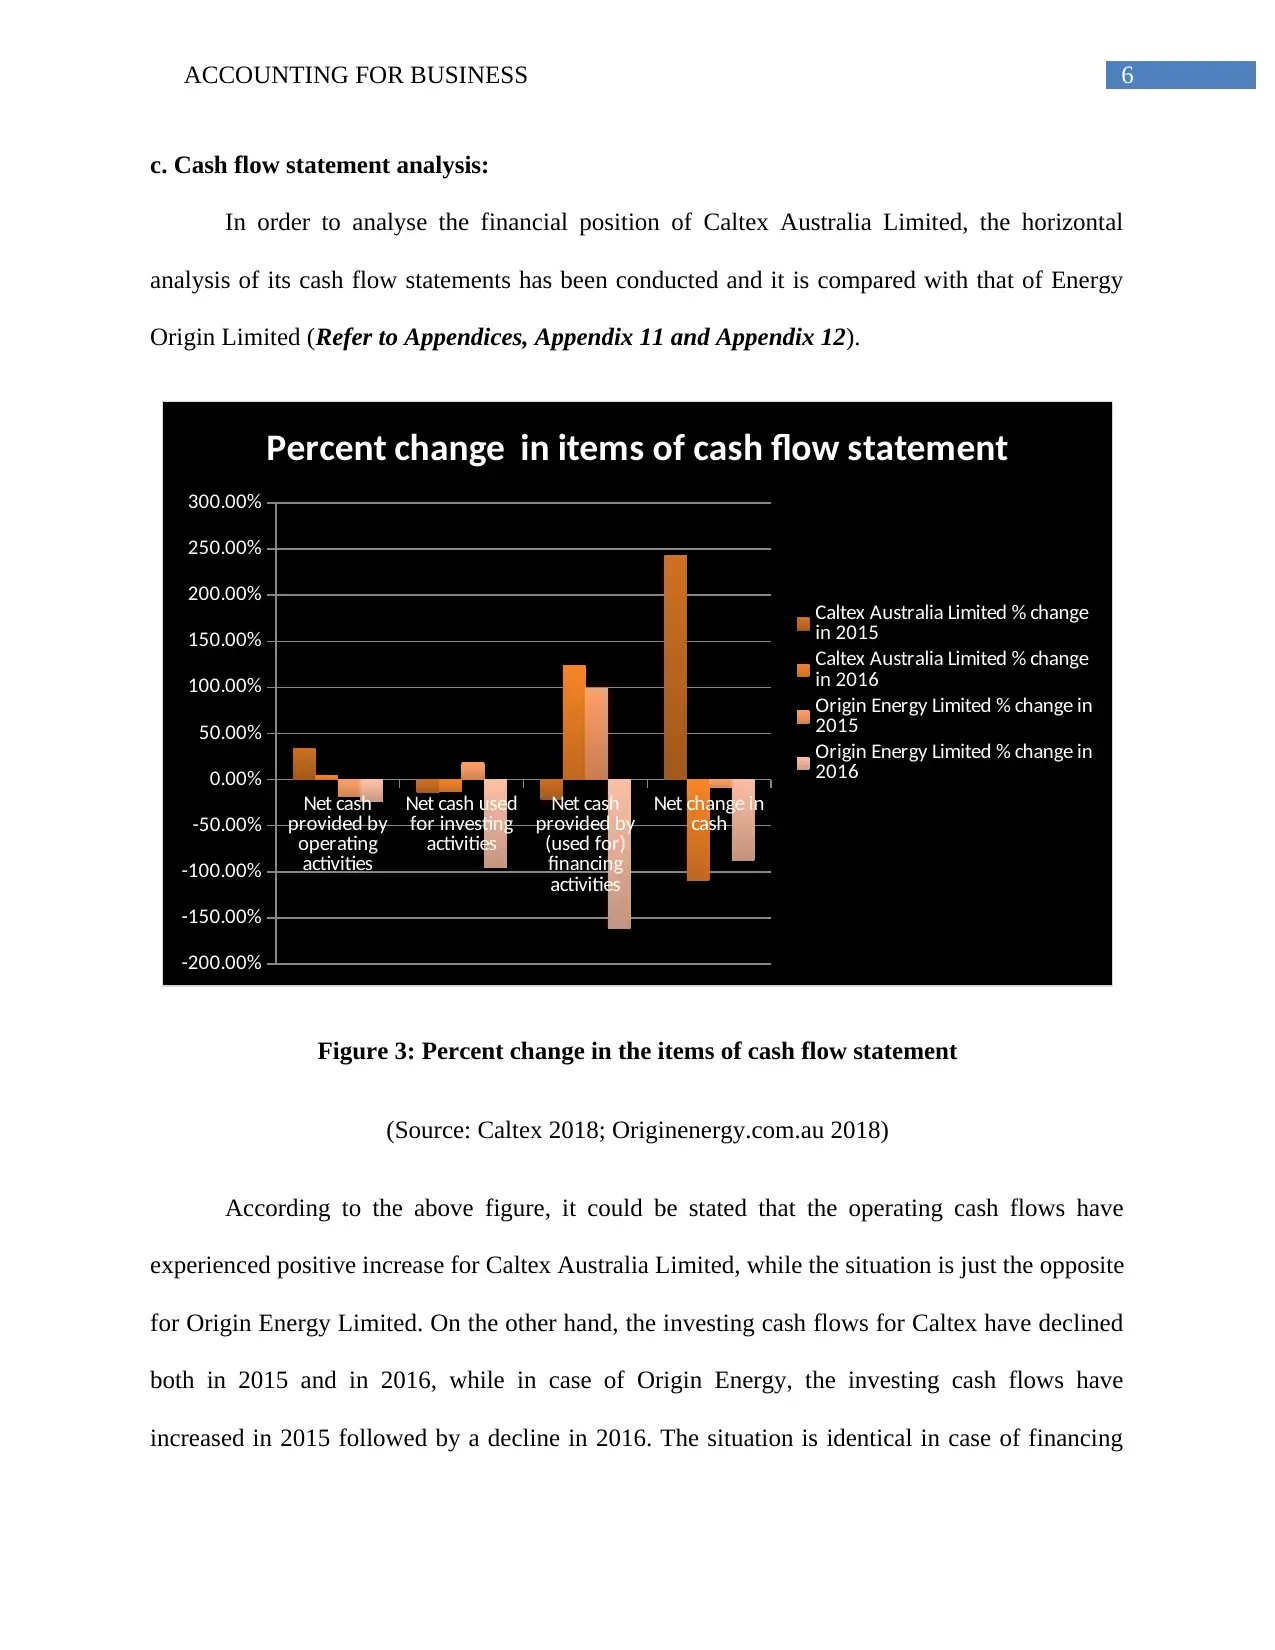
Figure 3: Percent change in the items of cash flow statement
(Source: Caltex 2018; Originenergy.com.au 2018)
According to the above figure, it could be stated that the operating cash flows have
experienced positive increase for Caltex Australia Limited, while the situation is just the opposite
for Origin Energy Limited. On the other hand, the investing cash flows for Caltex have declined
both in 2015 and in 2016, while in case of Origin Energy, the investing cash flows have
increased in 2015 followed by a decline in 2016. The situation is identical in case of financing
c. Cash flow statement analysis:
In order to analyse the financial position of Caltex Australia Limited, the horizontal
analysis of its cash flow statements has been conducted and it is compared with that of Energy
Origin Limited (Refer to Appendices, Appendix 11 and Appendix 12).
Net cash
provided by
operating
activities
Net cash used
for investing
activities
Net cash
provided by
(used for)
financing
activities
Net change in
cash
-200.00%
-150.00%
-100.00%
-50.00%
0.00%
50.00%
100.00%
150.00%
200.00%
250.00%
300.00%
Percent change in items of cash flow statement
Caltex Australia Limited % change
in 2015
Caltex Australia Limited % change
in 2016
Origin Energy Limited % change in
2015
Origin Energy Limited % change in
2016
Figure 3: Percent change in the items of cash flow statement
(Source: Caltex 2018; Originenergy.com.au 2018)
According to the above figure, it could be stated that the operating cash flows have
experienced positive increase for Caltex Australia Limited, while the situation is just the opposite
for Origin Energy Limited. On the other hand, the investing cash flows for Caltex have declined
both in 2015 and in 2016, while in case of Origin Energy, the investing cash flows have
increased in 2015 followed by a decline in 2016. The situation is identical in case of financing
Paraphrase This Document
Need a fresh take? Get an instant paraphrase of this document with our AI Paraphraser
7ACCOUNTING FOR BUSINESS
cash flows; however, the net cash at the end of the year 2016 has declined for both the
organisations. In this case, Caltex is in a better position, which denotes that Caltex is in a better
position in contrast to Origin Energy.
3. Ratio analysis:
a. Profitability analysis:
Particulars Details
Caltex Australia Limited Origin Energy Limited
2014 2015 2016 2014 2015 2016
Net profit A
2
0
52
2
61
0
53
0
(65
8)
(58
9)
Opening total
assets B
6,02
1
5,12
9
5,10
5
29,58
6
31,13
9
33,36
7
Closing total
assets C
5,12
9
5,10
5
5,30
3
31,13
9
33,36
7
28,89
8
Average total
assets
D=(B+C)/
2
5,57
5
5,11
7
5,20
4
30,36
3
32,25
3
31,13
3
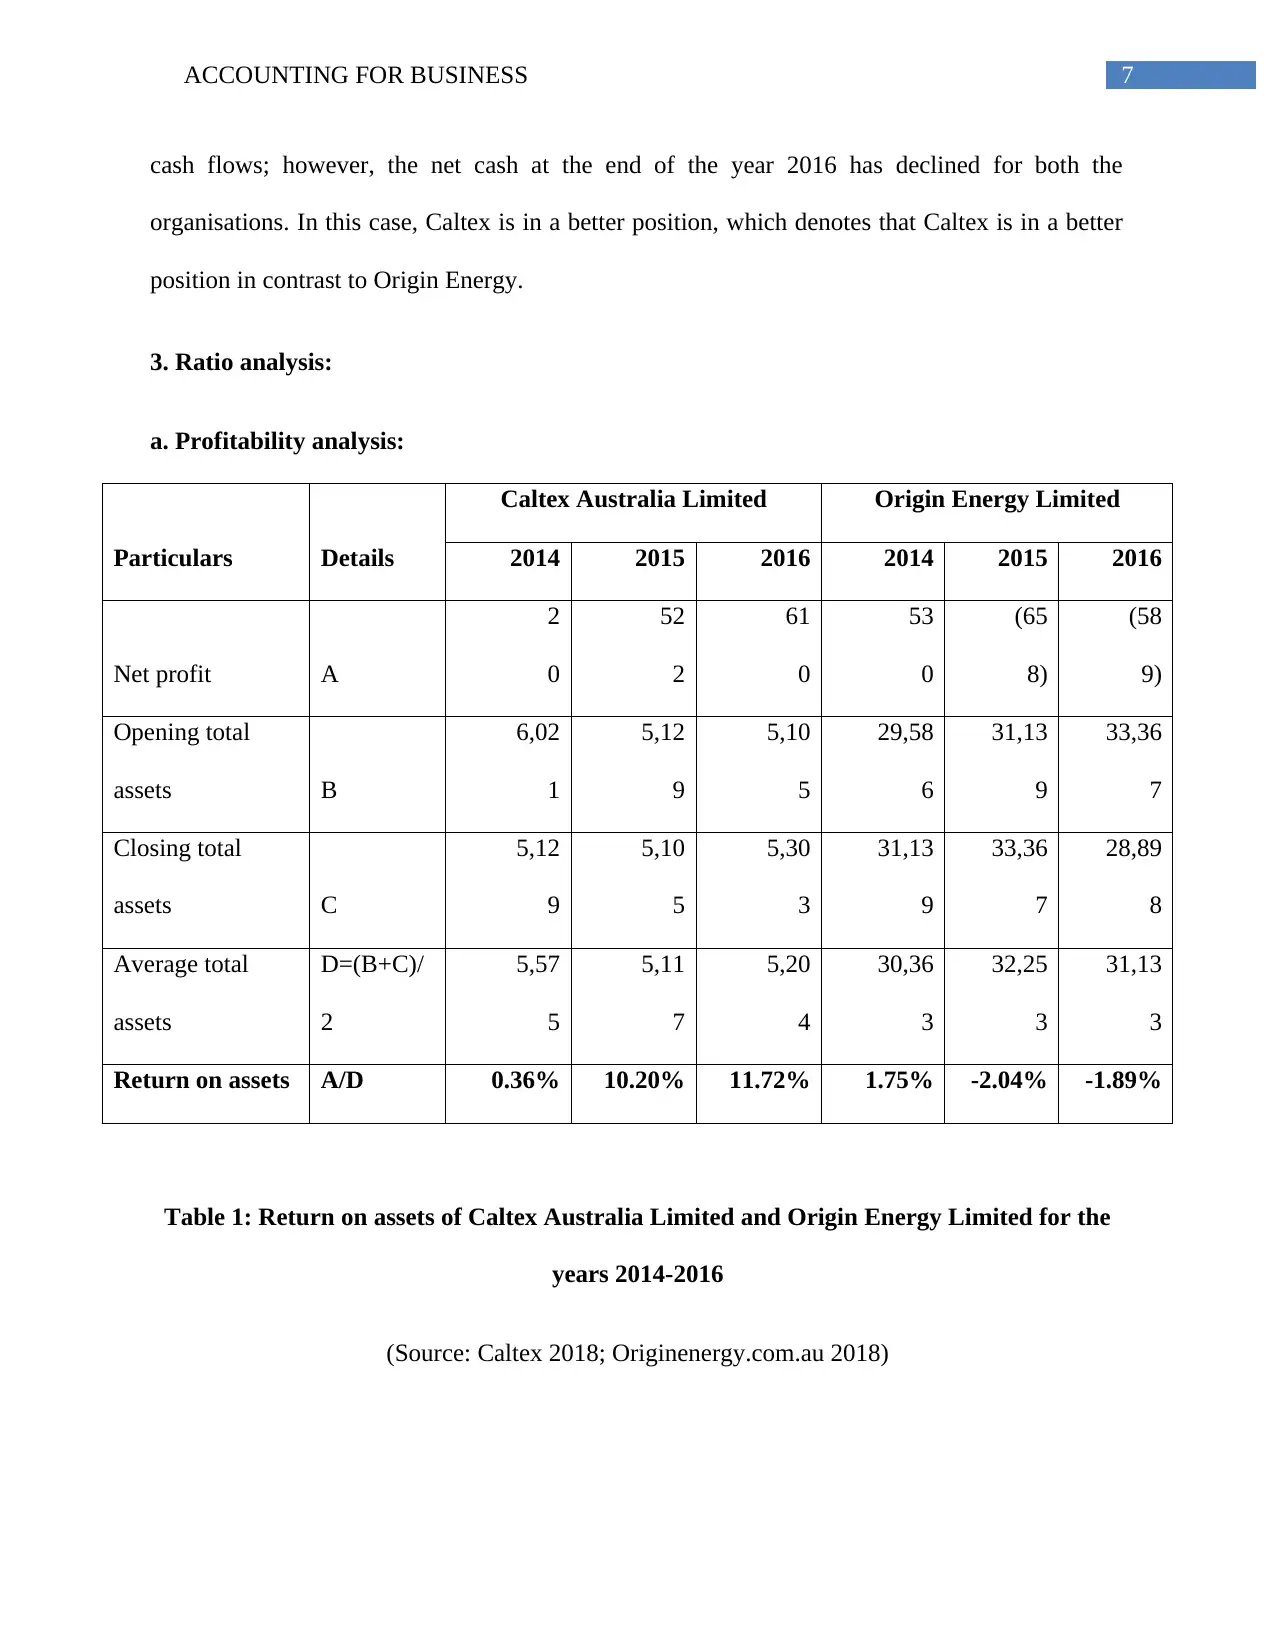
Return on assets A/D 0.36% 10.20% 11.72% 1.75% -2.04% -1.89%
Table 1: Return on assets of Caltex Australia Limited and Origin Energy Limited for the
years 2014-2016
(Source: Caltex 2018; Originenergy.com.au 2018)
cash flows; however, the net cash at the end of the year 2016 has declined for both the
organisations. In this case, Caltex is in a better position, which denotes that Caltex is in a better
position in contrast to Origin Energy.
3. Ratio analysis:
a. Profitability analysis:
Particulars Details
Caltex Australia Limited Origin Energy Limited
2014 2015 2016 2014 2015 2016
Net profit A
2
0
52
2
61
0
53
0
(65
8)
(58
9)
Opening total
assets B
6,02
1
5,12
9
5,10
5
29,58
6
31,13
9
33,36
7
Closing total
assets C
5,12
9
5,10
5
5,30
3
31,13
9
33,36
7
28,89
8
Average total
assets
D=(B+C)/
2
5,57
5
5,11
7
5,20
4
30,36
3
32,25
3
31,13
3
Return on assets A/D 0.36% 10.20% 11.72% 1.75% -2.04% -1.89%
Table 1: Return on assets of Caltex Australia Limited and Origin Energy Limited for the
years 2014-2016
(Source: Caltex 2018; Originenergy.com.au 2018)
8ACCOUNTING FOR BUSINESS
2014 2015 2016 2014 2015 2016
Caltex Australia Limited Origin Energy Limited
-4.00%
-2.00%
0.00%
2.00%
4.00%
6.00%
8.00%
10.00%
12.00%
14.00%
0.36%
10.20% 11.72%
1.75% -2.04% -1.89%
Return on assets
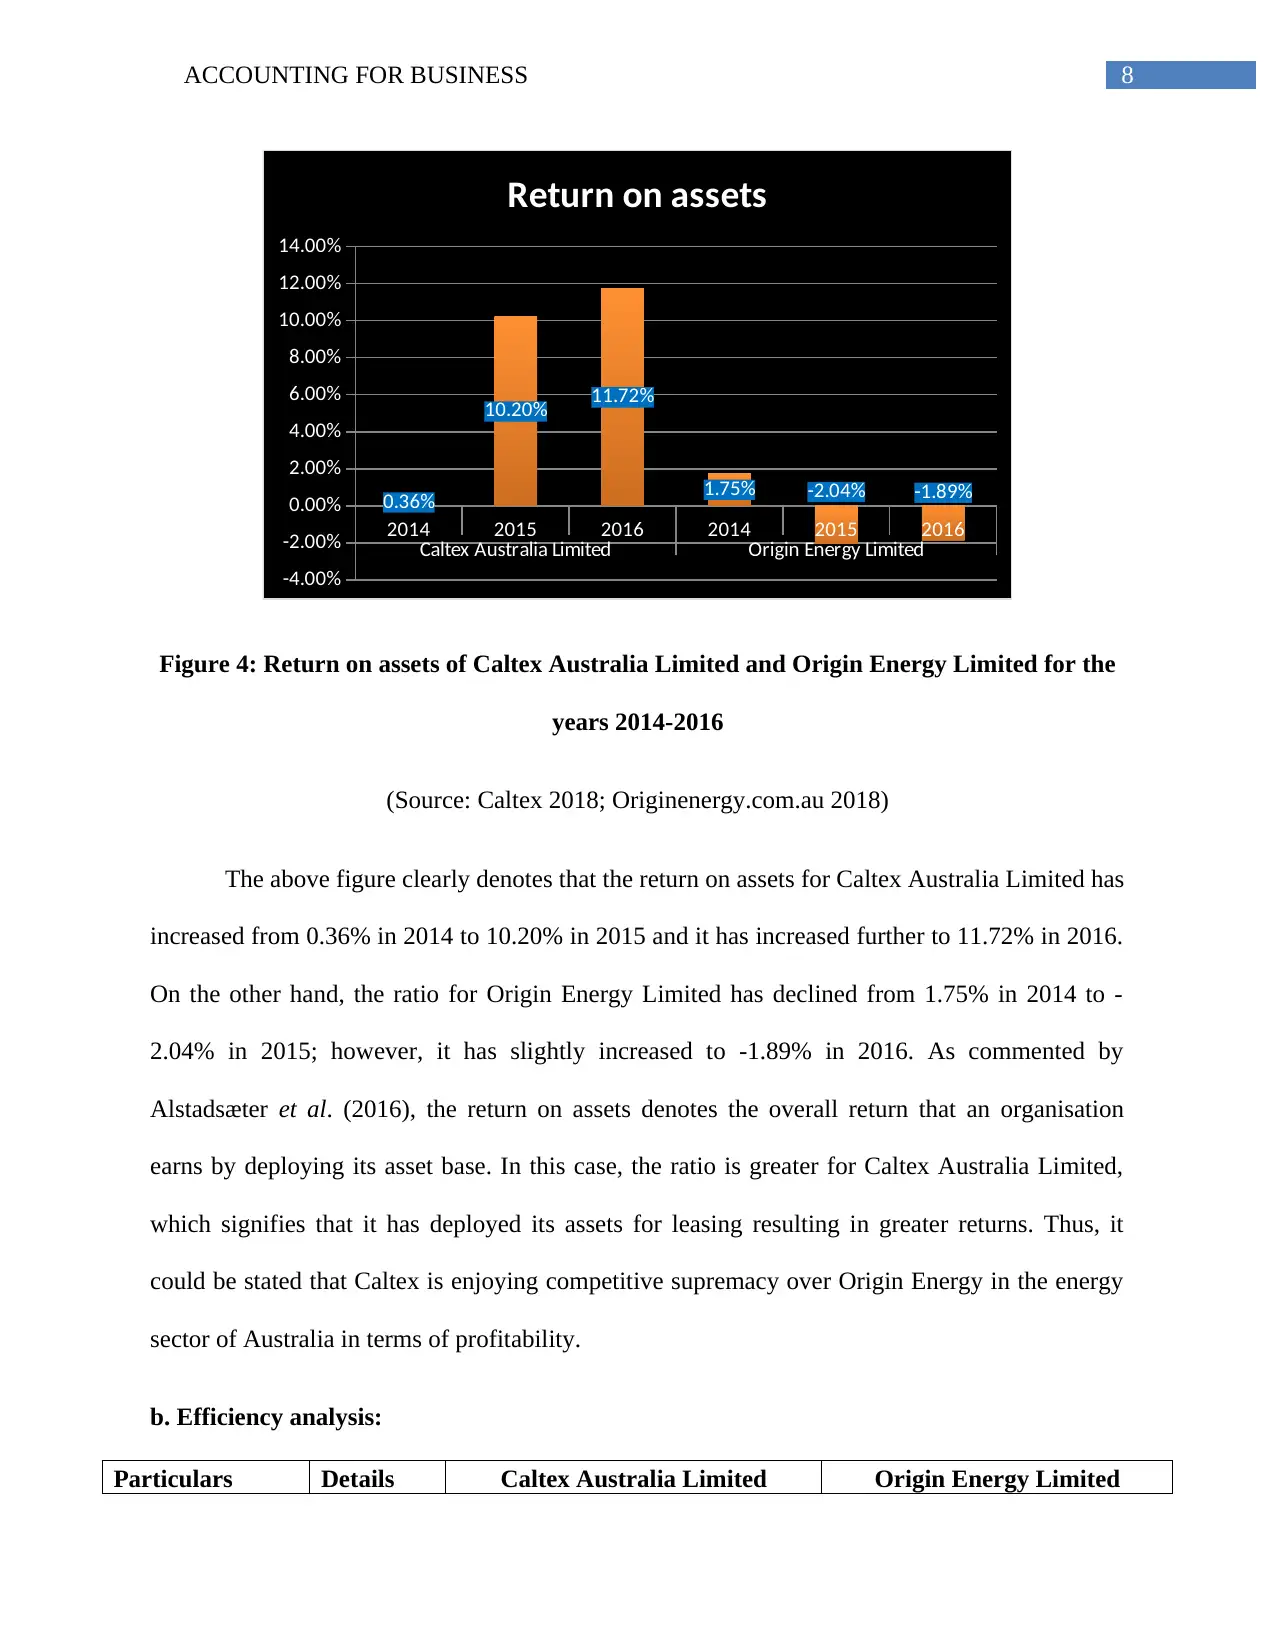
Figure 4: Return on assets of Caltex Australia Limited and Origin Energy Limited for the
years 2014-2016
(Source: Caltex 2018; Originenergy.com.au 2018)
The above figure clearly denotes that the return on assets for Caltex Australia Limited has
increased from 0.36% in 2014 to 10.20% in 2015 and it has increased further to 11.72% in 2016.
On the other hand, the ratio for Origin Energy Limited has declined from 1.75% in 2014 to -
2.04% in 2015; however, it has slightly increased to -1.89% in 2016. As commented by
Alstadsæter et al. (2016), the return on assets denotes the overall return that an organisation
earns by deploying its asset base. In this case, the ratio is greater for Caltex Australia Limited,
which signifies that it has deployed its assets for leasing resulting in greater returns. Thus, it
could be stated that Caltex is enjoying competitive supremacy over Origin Energy in the energy
sector of Australia in terms of profitability.
b. Efficiency analysis:
Particulars Details Caltex Australia Limited Origin Energy Limited
2014 2015 2016 2014 2015 2016
Caltex Australia Limited Origin Energy Limited
-4.00%
-2.00%
0.00%
2.00%
4.00%
6.00%
8.00%
10.00%
12.00%
14.00%
0.36%
10.20% 11.72%
1.75% -2.04% -1.89%
Return on assets
Figure 4: Return on assets of Caltex Australia Limited and Origin Energy Limited for the
years 2014-2016
(Source: Caltex 2018; Originenergy.com.au 2018)
The above figure clearly denotes that the return on assets for Caltex Australia Limited has
increased from 0.36% in 2014 to 10.20% in 2015 and it has increased further to 11.72% in 2016.
On the other hand, the ratio for Origin Energy Limited has declined from 1.75% in 2014 to -
2.04% in 2015; however, it has slightly increased to -1.89% in 2016. As commented by
Alstadsæter et al. (2016), the return on assets denotes the overall return that an organisation
earns by deploying its asset base. In this case, the ratio is greater for Caltex Australia Limited,
which signifies that it has deployed its assets for leasing resulting in greater returns. Thus, it
could be stated that Caltex is enjoying competitive supremacy over Origin Energy in the energy
sector of Australia in terms of profitability.
b. Efficiency analysis:
Particulars Details Caltex Australia Limited Origin Energy Limited
⊘ This is a preview!⊘
Do you want full access?
Subscribe today to unlock all pages.
Trusted by 1+ million students worldwide
9ACCOUNTING FOR BUSINESS
2014 2015 2016 2014 2015 2016
Cost of goods
sold A
22,73
0
18,03
8
31,88
0
10,81
1
8,40
6
8,96
4
Opening
inventory B
2,02
8
1,11
8
97
0
23
1
28
7
23
9
Closing
inventory C
1,11
8
97
0
1,08
1
28
7
23
9
24
8
Average
inventory
D=(B+C)/
2
1,57
3
1,04
4
1,02
6
25
9
26
3
243.5
0
Inventory
turnover (in
times) A/D 14.45 17.28 31.09 41.74 31.96 36.81
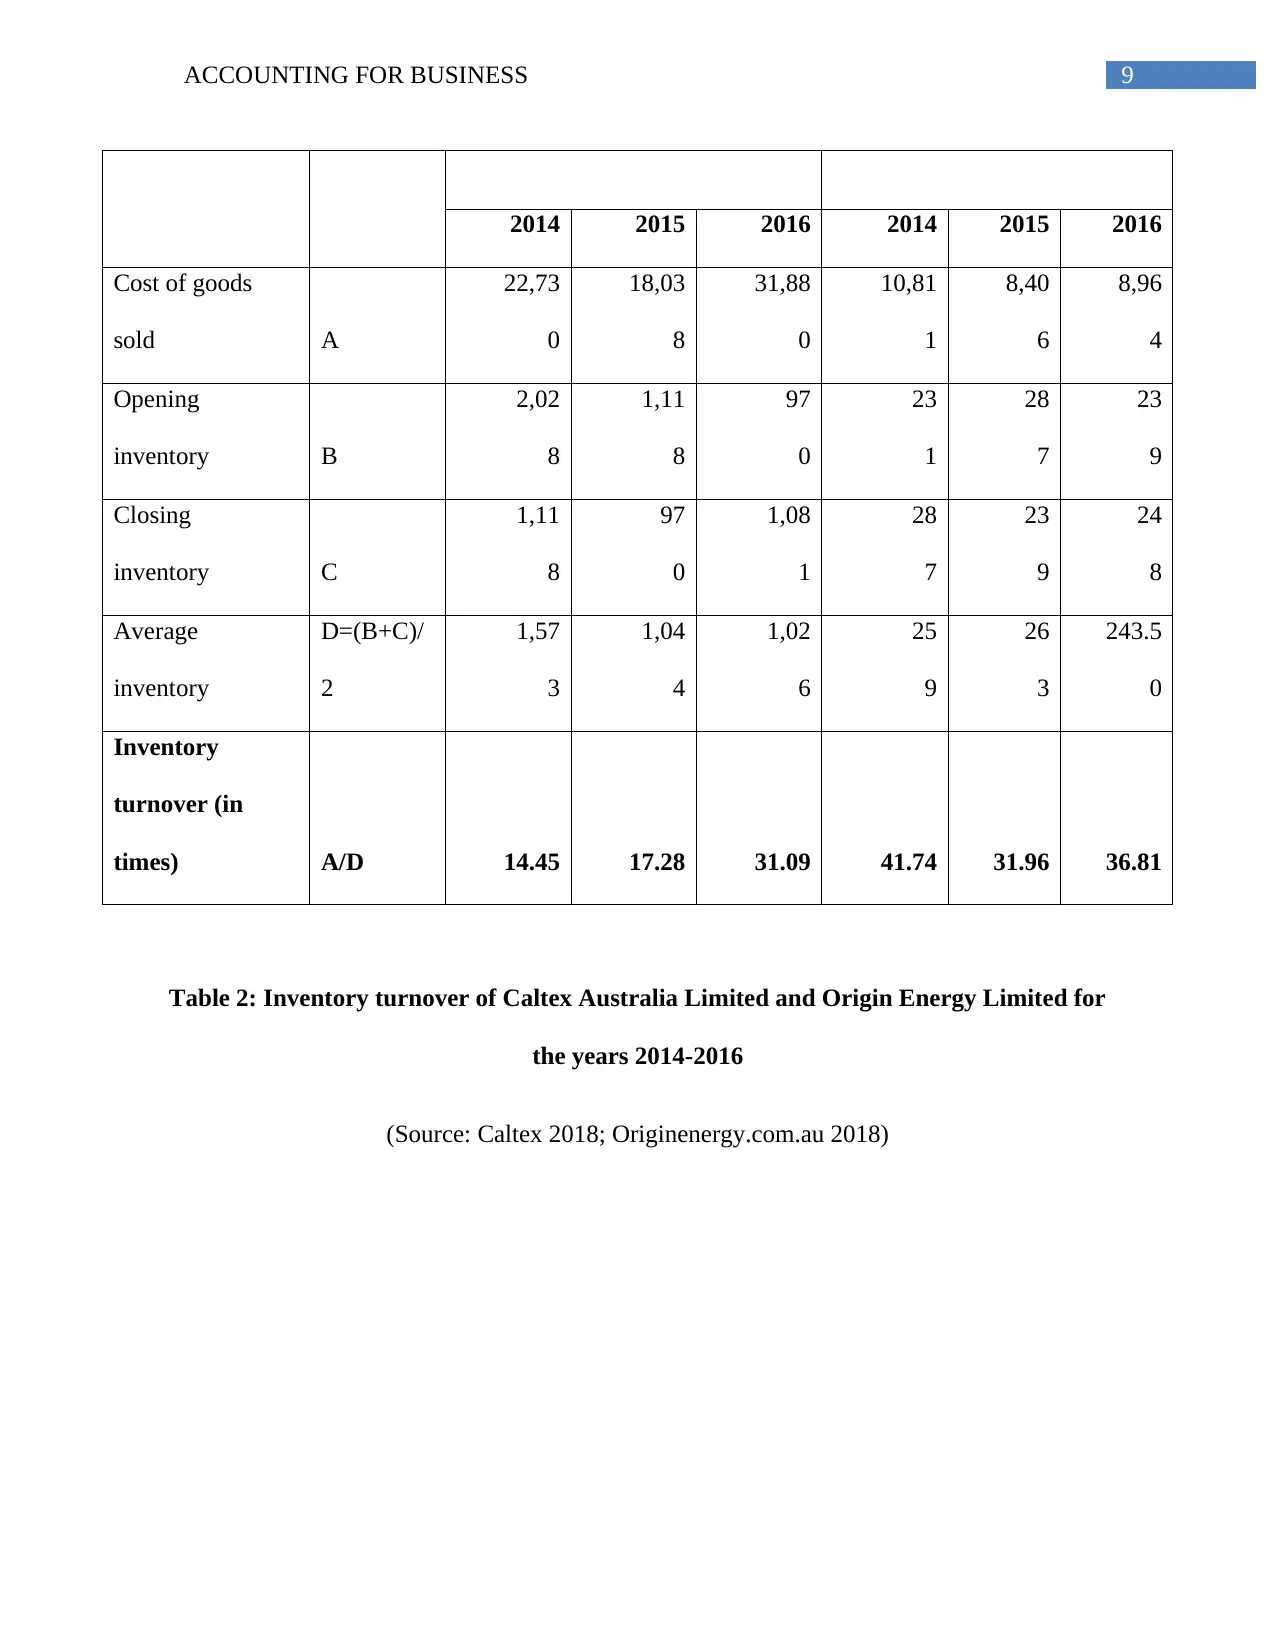
Table 2: Inventory turnover of Caltex Australia Limited and Origin Energy Limited for
the years 2014-2016
(Source: Caltex 2018; Originenergy.com.au 2018)
2014 2015 2016 2014 2015 2016
Cost of goods
sold A
22,73
0
18,03
8
31,88
0
10,81
1
8,40
6
8,96
4
Opening
inventory B
2,02
8
1,11
8
97
0
23
1
28
7
23
9
Closing
inventory C
1,11
8
97
0
1,08
1
28
7
23
9
24
8
Average
inventory
D=(B+C)/
2
1,57
3
1,04
4
1,02
6
25
9
26
3
243.5
0
Inventory
turnover (in
times) A/D 14.45 17.28 31.09 41.74 31.96 36.81
Table 2: Inventory turnover of Caltex Australia Limited and Origin Energy Limited for
the years 2014-2016
(Source: Caltex 2018; Originenergy.com.au 2018)
Paraphrase This Document
Need a fresh take? Get an instant paraphrase of this document with our AI Paraphraser
10ACCOUNTING FOR BUSINESS
2014 2015 2016 2014 2015 2016
Caltex Australia Limited Origin Energy Limited
0.00
5.00
10.00
15.00
20.00
25.00
30.00
35.00
40.00
45.00
14.45 17.28
31.09
41.74
31.96 36.81
Inventory turnover (in times)
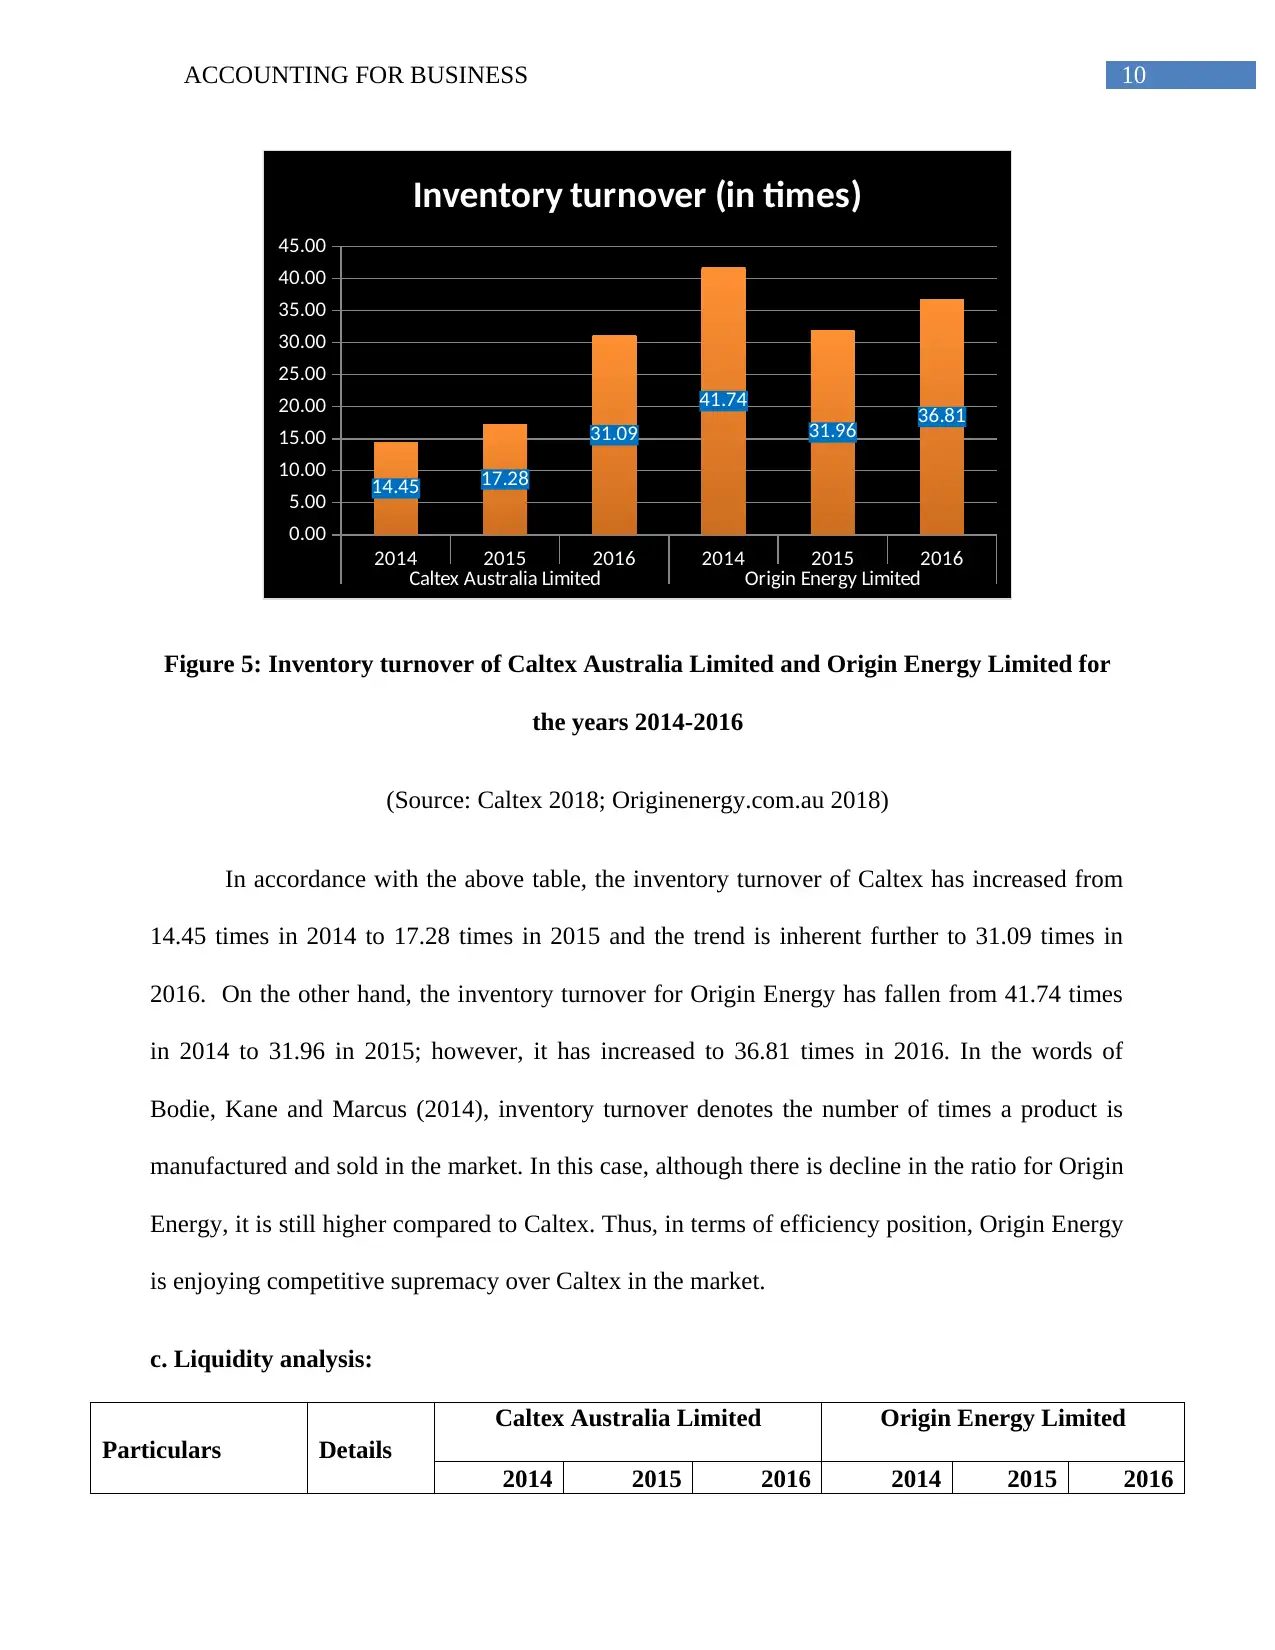
Figure 5: Inventory turnover of Caltex Australia Limited and Origin Energy Limited for
the years 2014-2016
(Source: Caltex 2018; Originenergy.com.au 2018)
In accordance with the above table, the inventory turnover of Caltex has increased from
14.45 times in 2014 to 17.28 times in 2015 and the trend is inherent further to 31.09 times in
2016. On the other hand, the inventory turnover for Origin Energy has fallen from 41.74 times
in 2014 to 31.96 in 2015; however, it has increased to 36.81 times in 2016. In the words of
Bodie, Kane and Marcus (2014), inventory turnover denotes the number of times a product is
manufactured and sold in the market. In this case, although there is decline in the ratio for Origin
Energy, it is still higher compared to Caltex. Thus, in terms of efficiency position, Origin Energy
is enjoying competitive supremacy over Caltex in the market.
c. Liquidity analysis:
Particulars Details
Caltex Australia Limited Origin Energy Limited
2014 2015 2016 2014 2015 2016
2014 2015 2016 2014 2015 2016
Caltex Australia Limited Origin Energy Limited
0.00
5.00
10.00
15.00
20.00
25.00
30.00
35.00
40.00
45.00
14.45 17.28
31.09
41.74
31.96 36.81
Inventory turnover (in times)
Figure 5: Inventory turnover of Caltex Australia Limited and Origin Energy Limited for
the years 2014-2016
(Source: Caltex 2018; Originenergy.com.au 2018)
In accordance with the above table, the inventory turnover of Caltex has increased from
14.45 times in 2014 to 17.28 times in 2015 and the trend is inherent further to 31.09 times in
2016. On the other hand, the inventory turnover for Origin Energy has fallen from 41.74 times
in 2014 to 31.96 in 2015; however, it has increased to 36.81 times in 2016. In the words of
Bodie, Kane and Marcus (2014), inventory turnover denotes the number of times a product is
manufactured and sold in the market. In this case, although there is decline in the ratio for Origin
Energy, it is still higher compared to Caltex. Thus, in terms of efficiency position, Origin Energy
is enjoying competitive supremacy over Caltex in the market.
c. Liquidity analysis:
Particulars Details
Caltex Australia Limited Origin Energy Limited
2014 2015 2016 2014 2015 2016
11ACCOUNTING FOR BUSINESS
Current assets A
2,09
9
2,00
5
2,14
4
3,59
6
8,37
3
3,57
1
Current liabilities B
1,50
4
1,21
8
1,50
2
3,70
9
5,17
5
2,88
9
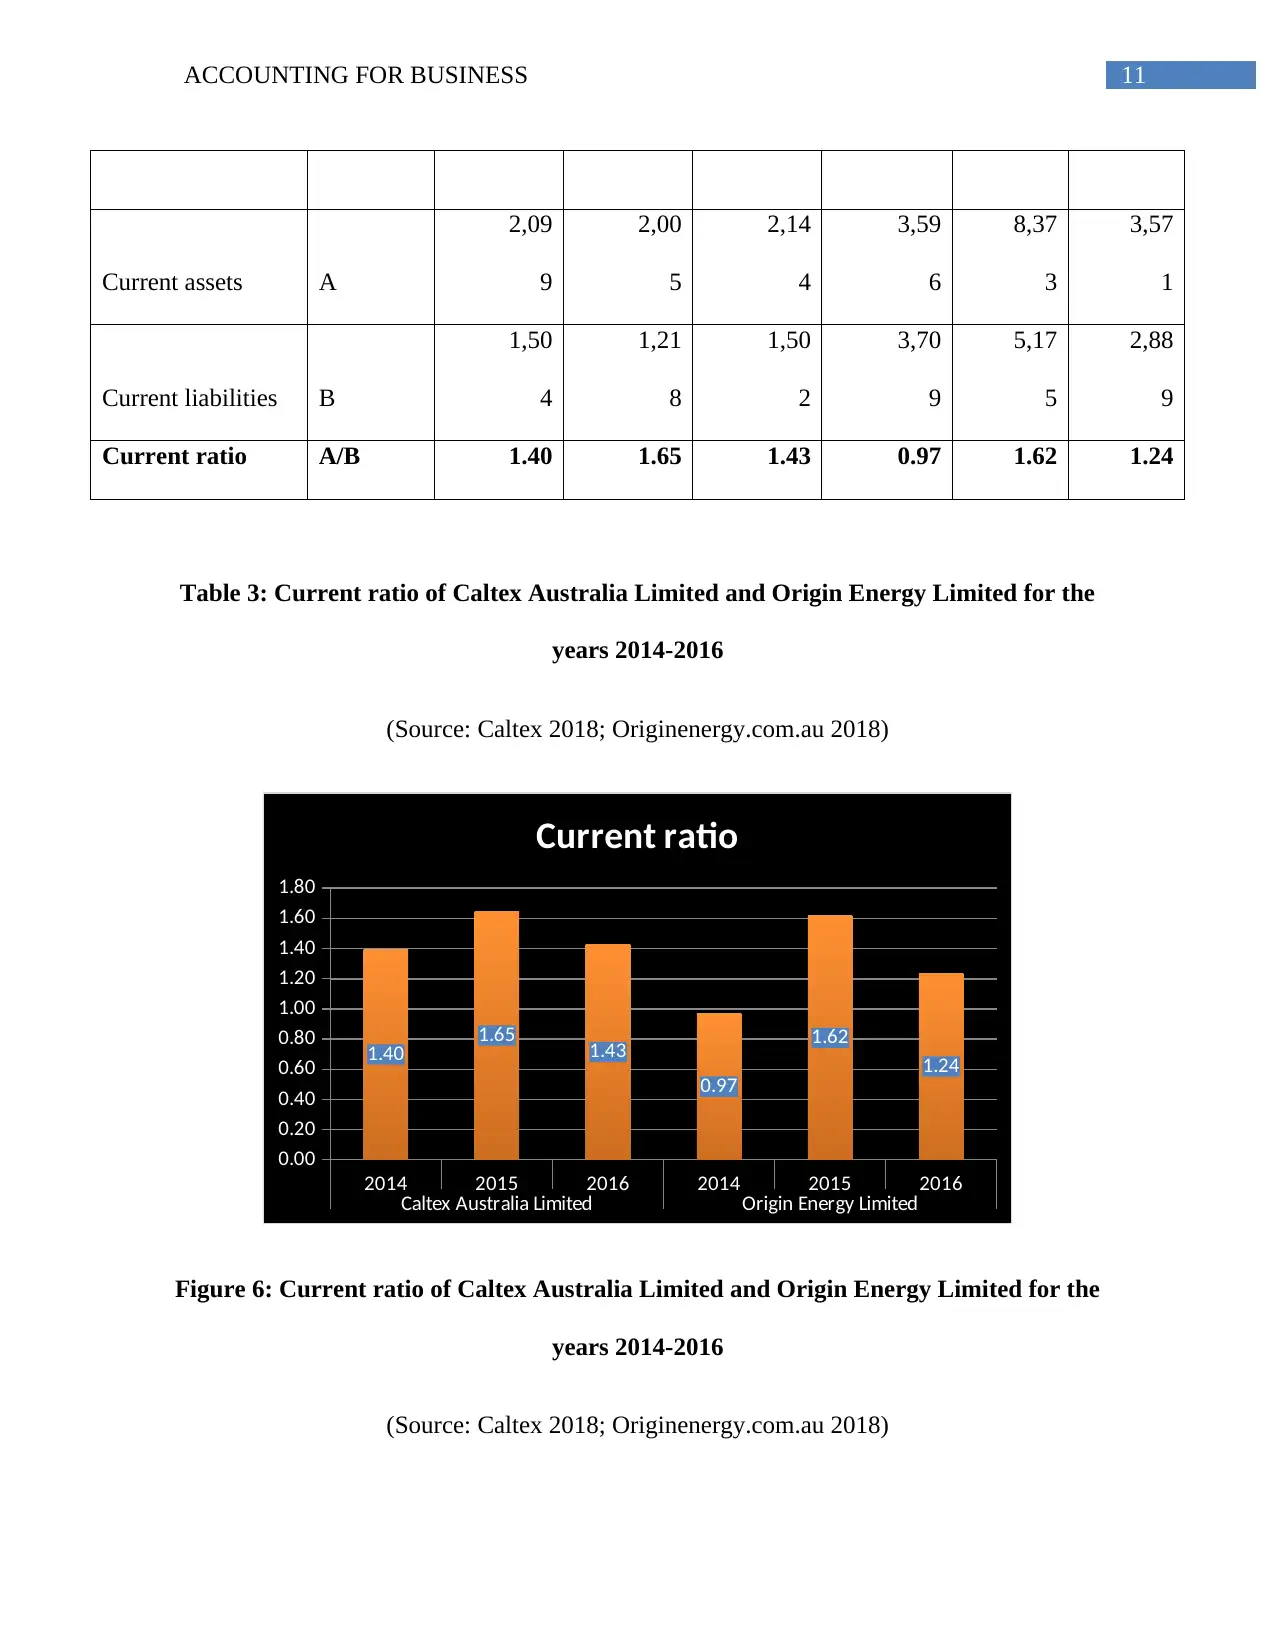
Current ratio A/B 1.40 1.65 1.43 0.97 1.62 1.24
Table 3: Current ratio of Caltex Australia Limited and Origin Energy Limited for the
years 2014-2016
(Source: Caltex 2018; Originenergy.com.au 2018)
2014 2015 2016 2014 2015 2016
Caltex Australia Limited Origin Energy Limited
0.00
0.20
0.40
0.60
0.80
1.00
1.20
1.40
1.60
1.80
1.40 1.65 1.43
0.97
1.62
1.24
Current ratio
Figure 6: Current ratio of Caltex Australia Limited and Origin Energy Limited for the
years 2014-2016
(Source: Caltex 2018; Originenergy.com.au 2018)
Current assets A
2,09
9
2,00
5
2,14
4
3,59
6
8,37
3
3,57
1
Current liabilities B
1,50
4
1,21
8
1,50
2
3,70
9
5,17
5
2,88
9
Current ratio A/B 1.40 1.65 1.43 0.97 1.62 1.24
Table 3: Current ratio of Caltex Australia Limited and Origin Energy Limited for the
years 2014-2016
(Source: Caltex 2018; Originenergy.com.au 2018)
2014 2015 2016 2014 2015 2016
Caltex Australia Limited Origin Energy Limited
0.00
0.20
0.40
0.60
0.80
1.00
1.20
1.40
1.60
1.80
1.40 1.65 1.43
0.97
1.62
1.24
Current ratio
Figure 6: Current ratio of Caltex Australia Limited and Origin Energy Limited for the
years 2014-2016
(Source: Caltex 2018; Originenergy.com.au 2018)
⊘ This is a preview!⊘
Do you want full access?
Subscribe today to unlock all pages.
Trusted by 1+ million students worldwide
1 out of 29
Related Documents


Your All-in-One AI-Powered Toolkit for Academic Success.
+13062052269
info@desklib.com
Available 24*7 on WhatsApp / Email
![[object Object]](/_next/static/media/star-bottom.7253800d.svg)
Unlock your academic potential
Copyright © 2020–2026 A2Z Services. All Rights Reserved. Developed and managed by ZUCOL.