Report on Numeracy and Data Analysis: 10-Day Temperature of Camberley

Verified

Added on  2023/06/04

|10
|1492
|356
Report
AI Summary
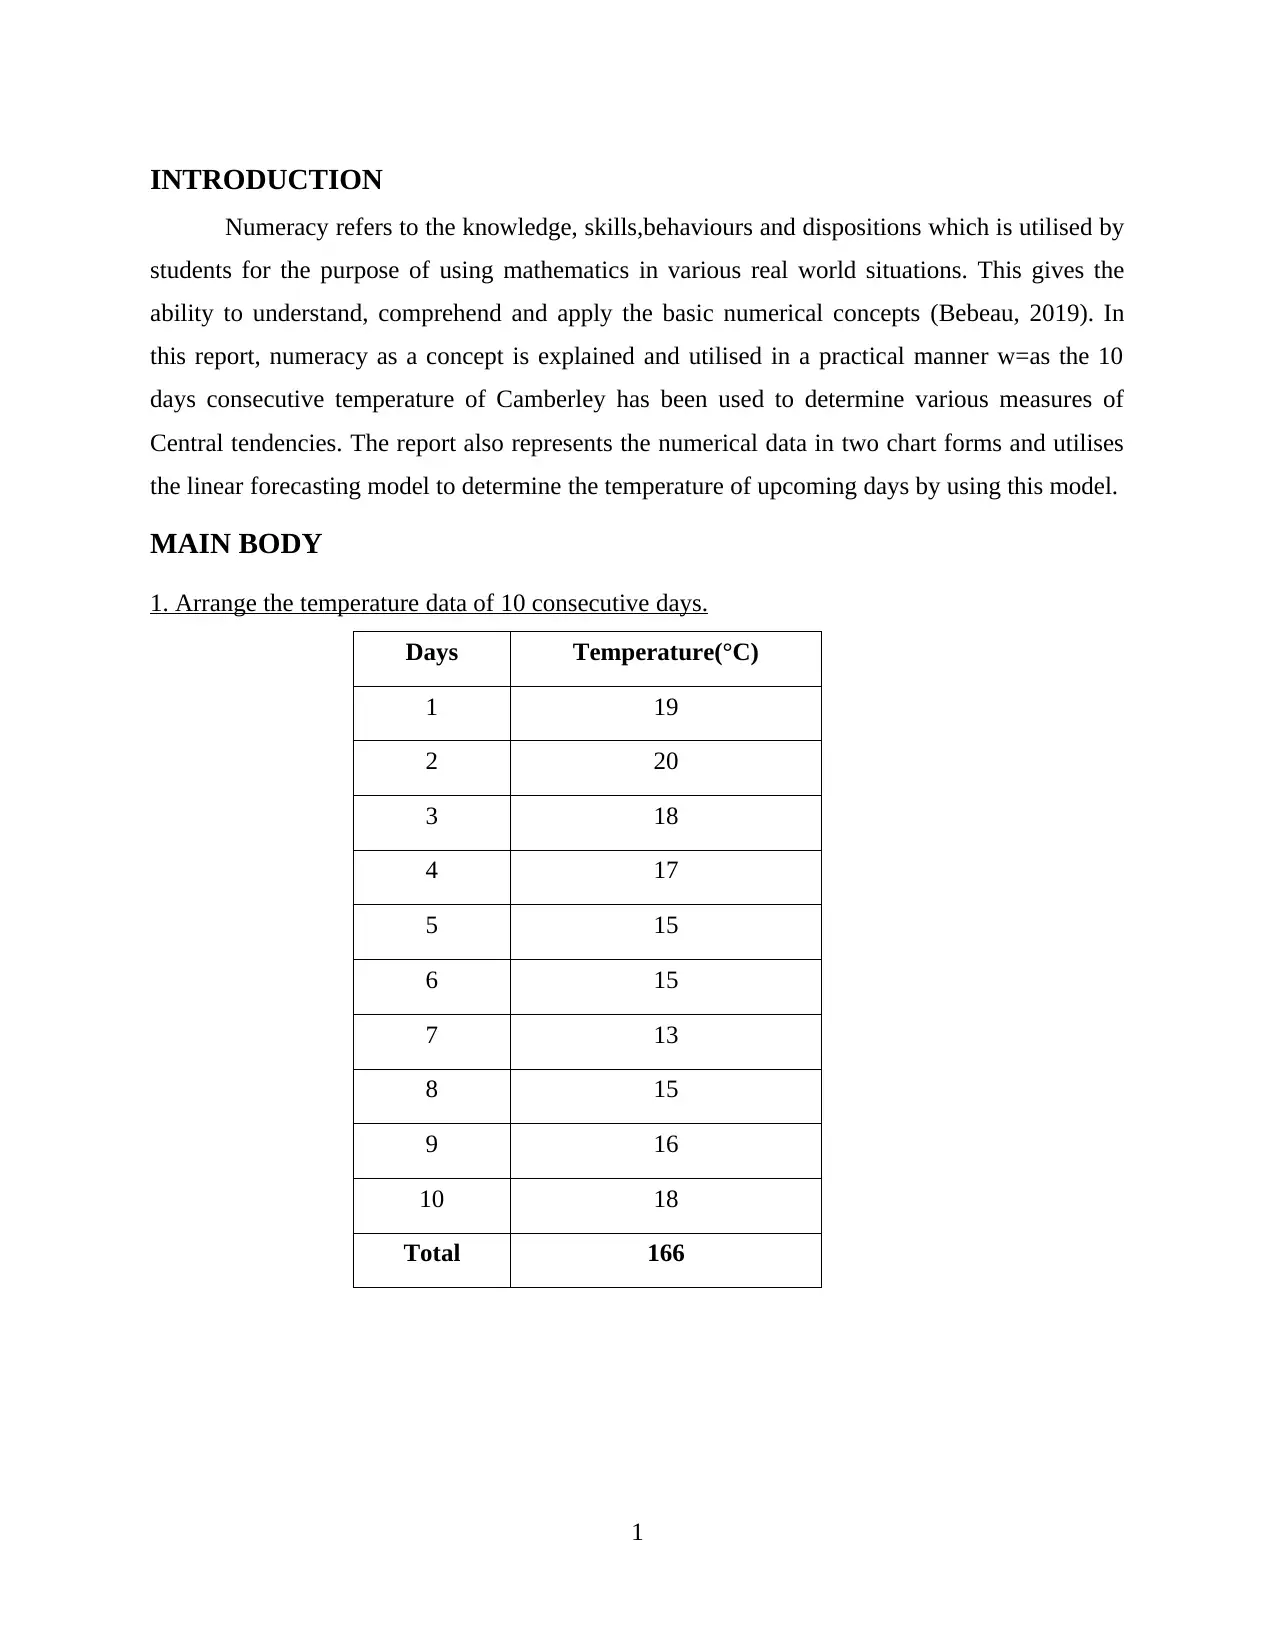
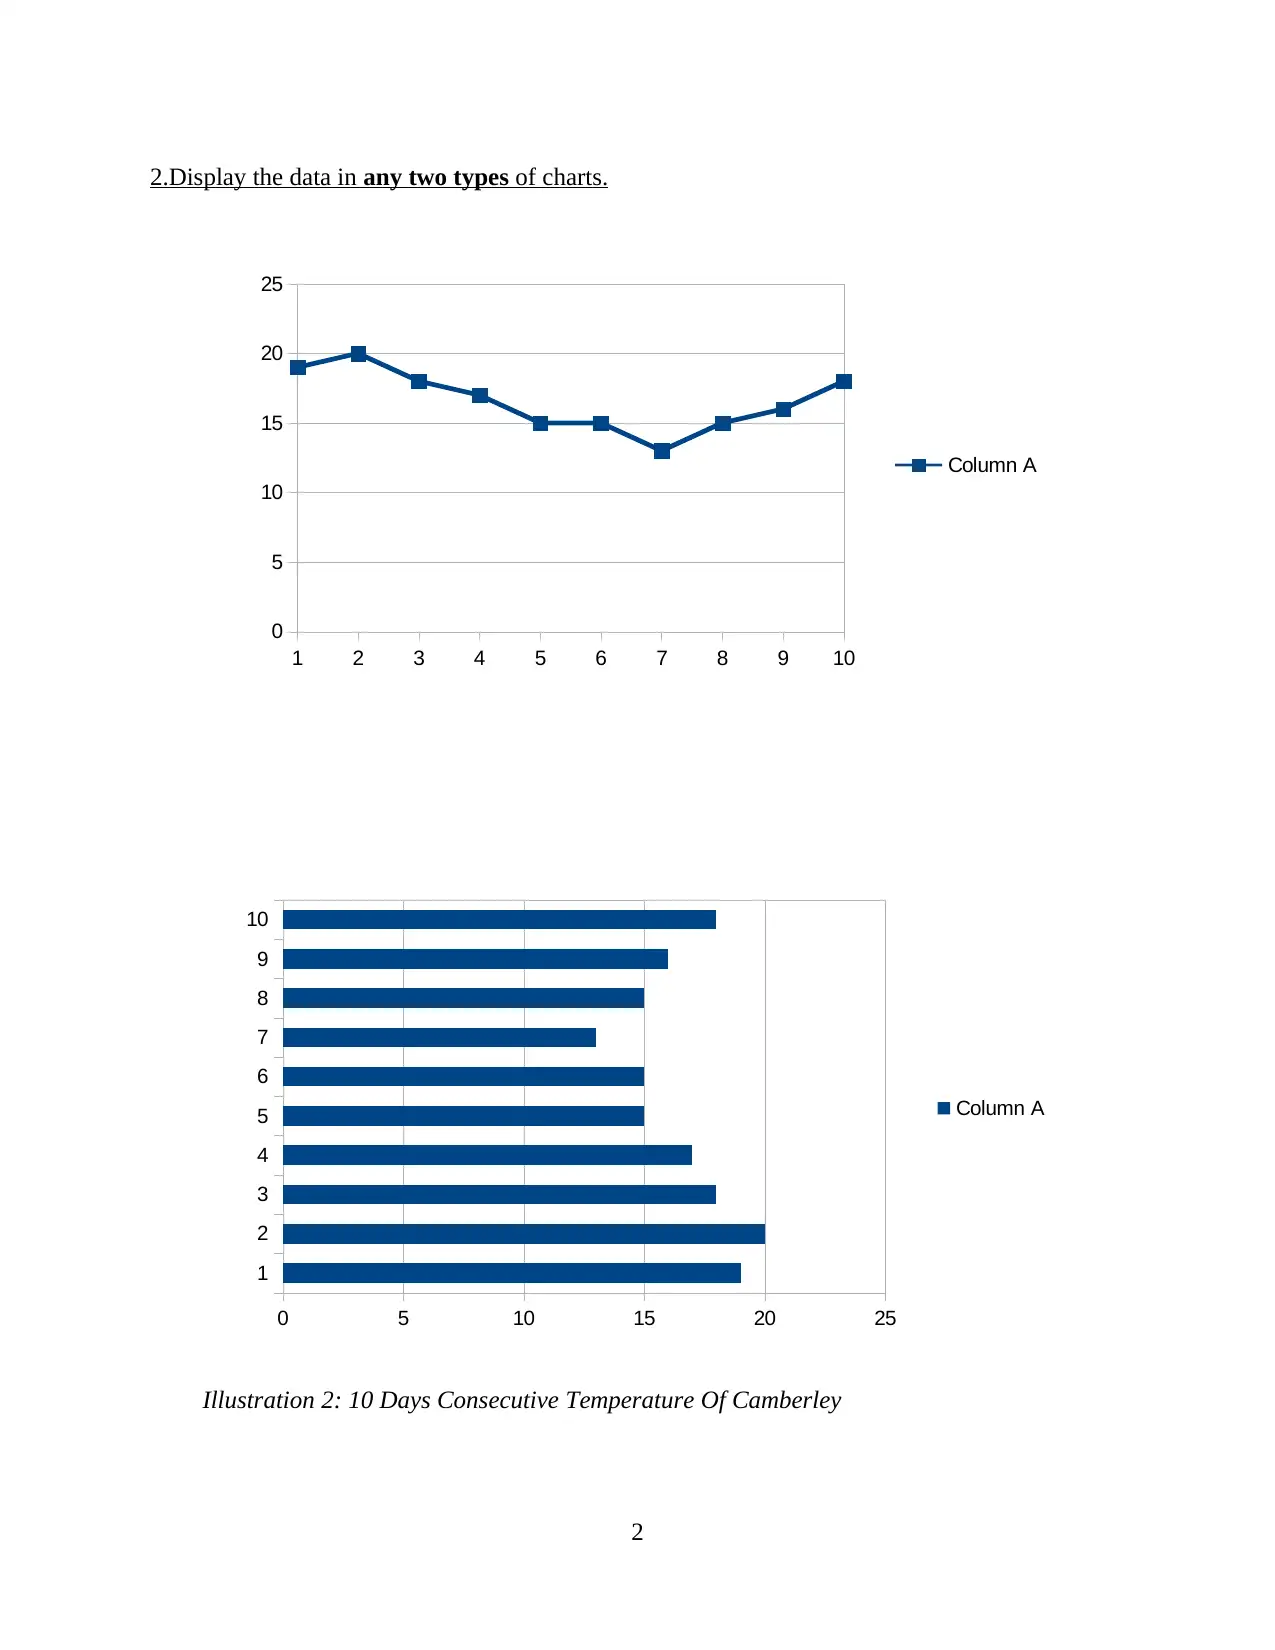
This report delves into the concepts of numeracy and data analysis using temperature data from Camberley over 10 consecutive days. It begins by organizing the temperature data and presenting it visually through two different chart types. The core of the report involves calculating key statistical measures, including the mean, median, mode, range, and standard deviation, with detailed steps provided for each calculation. Furthermore, the report utilizes a linear forecasting model to predict future temperatures, calculating the 'm' and 'c' values and forecasting temperatures for days 11 and 14 based on the model. The conclusion emphasizes the importance of numeracy in solving real-world problems and the utility of statistical tools in analyzing and predicting trends. The report demonstrates practical application of statistical techniques and forecasting models.
tabler-icon-diamond-filled.svg

Contribute Materials

Your contribution can guide someone’s learning journey. Share your documents today.
Document Page
Numeracy and Data
Analysis
tabler-icon-diamond-filled.svg

Secure Best Marks with AI Grader

Need help grading? Try our AI Grader for instant feedback on your assignments.
Document Page
Contents
INTRODUCTION...........................................................................................................................1
MAIN BODY...................................................................................................................................1
1. Arrange the temperature data of 10 consecutive days.............................................................1
2.Display the data in any two types of charts..............................................................................2
3.Compute the following along with the steps and highlight the final values of the same.........3
4.Utilise the linear forecasting model to compute the following:................................................5
CONCLUSION ...............................................................................................................................7
REFERENCES................................................................................................................................8
Document Page
INTRODUCTION
Numeracy refers to the knowledge, skills,behaviours and dispositions which is utilised by
students for the purpose of using mathematics in various real world situations. This gives the
ability to understand, comprehend and apply the basic numerical concepts (Bebeau, 2019). In
this report, numeracy as a concept is explained and utilised in a practical manner w=as the 10
days consecutive temperature of Camberley has been used to determine various measures of
Central tendencies. The report also represents the numerical data in two chart forms and utilises
the linear forecasting model to determine the temperature of upcoming days by using this model.
MAIN BODY
1. Arrange the temperature data of 10 consecutive days.
Days Temperature(°C)
1 19
2 20
3 18
4 17
5 15
6 15
7 13
8 15
9 16
10 18
Total 166
1
Document Page
2.Display the data in any two types of charts.
2
1 2 3 4 5 6 7 8 9 10
0
5
10
15
20
25
Column A
Illustration 1: 10 Days Consecutive Temperature Of Camberley
1
2
3
4
5
6
7
8
9
10
0 5 10 15 20 25
Column A
Illustration 2: 10 Days Consecutive Temperature Of Camberley
tabler-icon-diamond-filled.svg

Secure Best Marks with AI Grader

Need help grading? Try our AI Grader for instant feedback on your assignments.
Document Page
3.Compute the following along with the steps and highlight the final values of the same.
Mean: In statistics, mean refers to the average value of the entire data set given. It is computed
by dividing the sum of all the digits available in the given set with the total number of values in
the data set (Grebitus and Davis, 2019).
Steps:
1. Find the sum of all the values which are present in the data set.
2. Divide the sum obtained with the total number of digits that are present in the data set.
Mean={Sum of Observation} ÷ {Total numbers of Observations}
=(13+15+15+15+16+17+18+18+19+20)/10
=166/10
Mean=16.6
Median: Median refers to the middle most values in the entire data set which is there in the given
data after it is arranged in an ascending or descending order (Howard and et.al., 2022).
Steps:1. Organize the present data set in an ascending or descending order.2. Ascertain the total number of values in the data set.3. When the total number of the values is odd, apply the formula Median= {(n+1)/2} th term4. When the total number of the values are even, apply the formula Median=[(n/2) th
term={(n/2)+1}th]/2
Here the data set has 10 values so total number of values is even.
Ascending order: 13 15 15 15 16 17 18 18 19 20
Median= [(10/2)th term + (10/2+1)th term]/2
=(5th + 6th)/2
=(16+17)/2
=33/2
Median=16.5
Mode: It refers to the value which appears the highest number of times in the entire data set. The
value referred as mode is the one which has highest frequency in the data given (Lechner, C.M.,
and et.al., 2021).
Steps:
1. arrange the given data in an ascending or descending order.
3
Document Page
2. Count each value in the data set with respect to the number of times it occurs in the given
data.3. The value which occurs the most number of times is termed to be the mode of the data
set.
Ascending order: 13 15 15 15 16 17 18 18 19 20
Mode= 15
Range: It refers to the difference between the highest and the lowest value in the data set (Peters
and Shoots-Reinhard, 2022).
Range= (Highest value- Lowest value)
=20-13
Range= 7
Standard Deviation: This measures the deviation of each value in the given data set with the
mean of the data.
Standard Deviation= √∑ (xi – μ) ^ 2 / N
= √(166-16.6)^2 / 10
= √22320.36/10
= √2232.036
Standard Deviation=47.24
Steps:
1. Ascertain the mean of the data set.
2. For every number in the data set, find the deviation of the number with respect to the
mean of the data.
3. Square each value obtained after finding deviation of each value from mean.
4. Determine the Sum of these values.
5. Divide the sum obtained by total number of values.
6. Take the square root of the value obtained (Mustaffa and Zulkifli, 2019).
4
Document Page
4.Utilise the linear forecasting model to compute the following:
Calculation of m value.
Calculation of c value.
Applying the calculated 'm' and 'c' values, forecast the humidity for day 11 and 12.
Linear forecasting model: It is a type of statistical tool which is utilised for predicting the future
values with the help of the past data which is already available. This is a quantitative method to
determine and analyse the underlying trends and factors (Mamedova and Pawlowski, 2020).
y= mx+c
Calculation of 'm' value
= (10*881)-(55*166)/(10*385)-(3025)
=-320/825
m= -0.3878
Calculation of 'c' value
=166-(-0.3878*55)/10
=166+21.32/10
c= 18.73
5
tabler-icon-diamond-filled.svg

Paraphrase This Document

Need a fresh take? Get an instant paraphrase of this document with our AI Paraphraser
Document Page
Temperature of day 11:
m= -0.3878, x=11, c=18.73
y = mx + C
=(-0.3878*11)+18.73
Temperature of day 11= 22.9
Temperature of day 14:
m= -0.3878, x=14, c=18.73
y = mx + C
=(-0.3878*14)+18.73
Temperature of day 14= 24.1
6
Document Page
CONCLUSION
From the above report, it can be concluded that numeracy is an essential skill which
assists individuals to utilise, interpret and communicate the information which is there in
mathematical terms to solve the actual world problem scenarios. The report assists to conclude
upon various measures of central tendency such as mean,median, mode, range and standard
deviation with the help of a numerical data for temperature of 10 consecutive days of Camberley.
In the end the report helps to determine the future days humidities with the help of linear
forecasting model concludes the importance of his model in finding future values with past data
available.
7
Document Page
REFERENCES
Books and Journals:
Bebeau, C. M., 2019. Graphicacy for Numeracy: Review of Fundamentals of Data Visualization:
A Primer on Making Informative and Compelling Figures by Claus O. Wilke
(2019). Numeracy: Advancing Education in Quantitative Literacy, 12(2).
Grebitus, C. and Davis, G. C., 2019. Does the new nutrition facts panel help compensate for low
numeracy skills? An eye‐tracking analysis. Agricultural economics, 50(3), pp.249-258.
Howard, S. J., and et.al., 2022. Validity, reliability and viability of pre-school educators’ use of
early years toolbox early numeracy. Australasian Journal of Early Childhood, 47(2),
pp.92-106.
Lechner, C. M., and et.al., 2021. Stability and change in adults' literacy and numeracy skills:
Evidence from two large-scale panel studies. Personality and Individual
Differences, 180, p.110990.
Mamedova, S. and Pawlowski, E., 2020. Adult Numeracy in the United States. Institute of
Education Sciences, National Center for Education Statistics, US Department of
Education.
Mustaffa, N. A. and Zulkifli, M., 2019, August. The influence of students’ numeracy skills on
the attainment of course learning outcome in introductory statistics course. In AIP
Conference Proceedings (Vol. 2138, No. 1, p. 050022). AIP Publishing LLC.
Peters, E. and Shoots-Reinhard, B., 2022. Numeracy and the Motivational Mind: The Power of
Numeric Self-efficacy. Medical Decision Making, p.0272989X221099904.
8
chevron_up_icon
1 out of 10
circle_padding
hide_on_mobile
zoom_out_icon
logo.png

Your All-in-One AI-Powered Toolkit for Academic Success.

Available 24*7 on WhatsApp / Email

[object Object]