Cambridge Pre-U Mathematics: Formulae and Statistical Tables (2017)
VerifiedAdded on 2021/10/01
|12
|3210
|245
Homework Assignment
AI Summary
This document contains the Cambridge Pre-U Revised Syllabus Formulae and Statistical Tables, designed for use in Mathematics and Further Mathematics examinations. It includes essential formulae for Pure Mathematics, covering topics such as algebraic series, binomial expansion, Maclaurin expansion, partial fractions, trigonometry, derivatives, and integrals. The document also provides vector formulas, numerical methods, probability and statistics information including standard discrete and continuous distributions, sampling and testing, and regression and correlation. Additionally, it features the normal distribution function and critical values for both the normal and t-distributions, making it a comprehensive resource for students preparing for their Cambridge Pre-U Mathematics exams. This resource is available on Desklib, a platform offering AI-based study tools for students.

Cambridge Pre-U Revised Syllabus
MINISTRY OF EDUCATION, SINGAPORE
in collaboration with
UNIVERSITY OF CAMBRIDGE LOCAL EXAMINATIONS SYNDICATE
General Certificate of Education Advanced Level
List MF26
LIST OF FORMULAE
AND
STATISTICAL TABLES
for Mathematics and Further Mathematics
For use from 2017 in all papers for the H1, H2 and H3 Mathematics and
H2 Further Mathematics syllabuses.
CST310
This document consists of 11 printed pages and 1 blank page.
© UCLES & MOE 2015
Paraphrase This Document
Need a fresh take? Get an instant paraphrase of this document with our AI Paraphraser
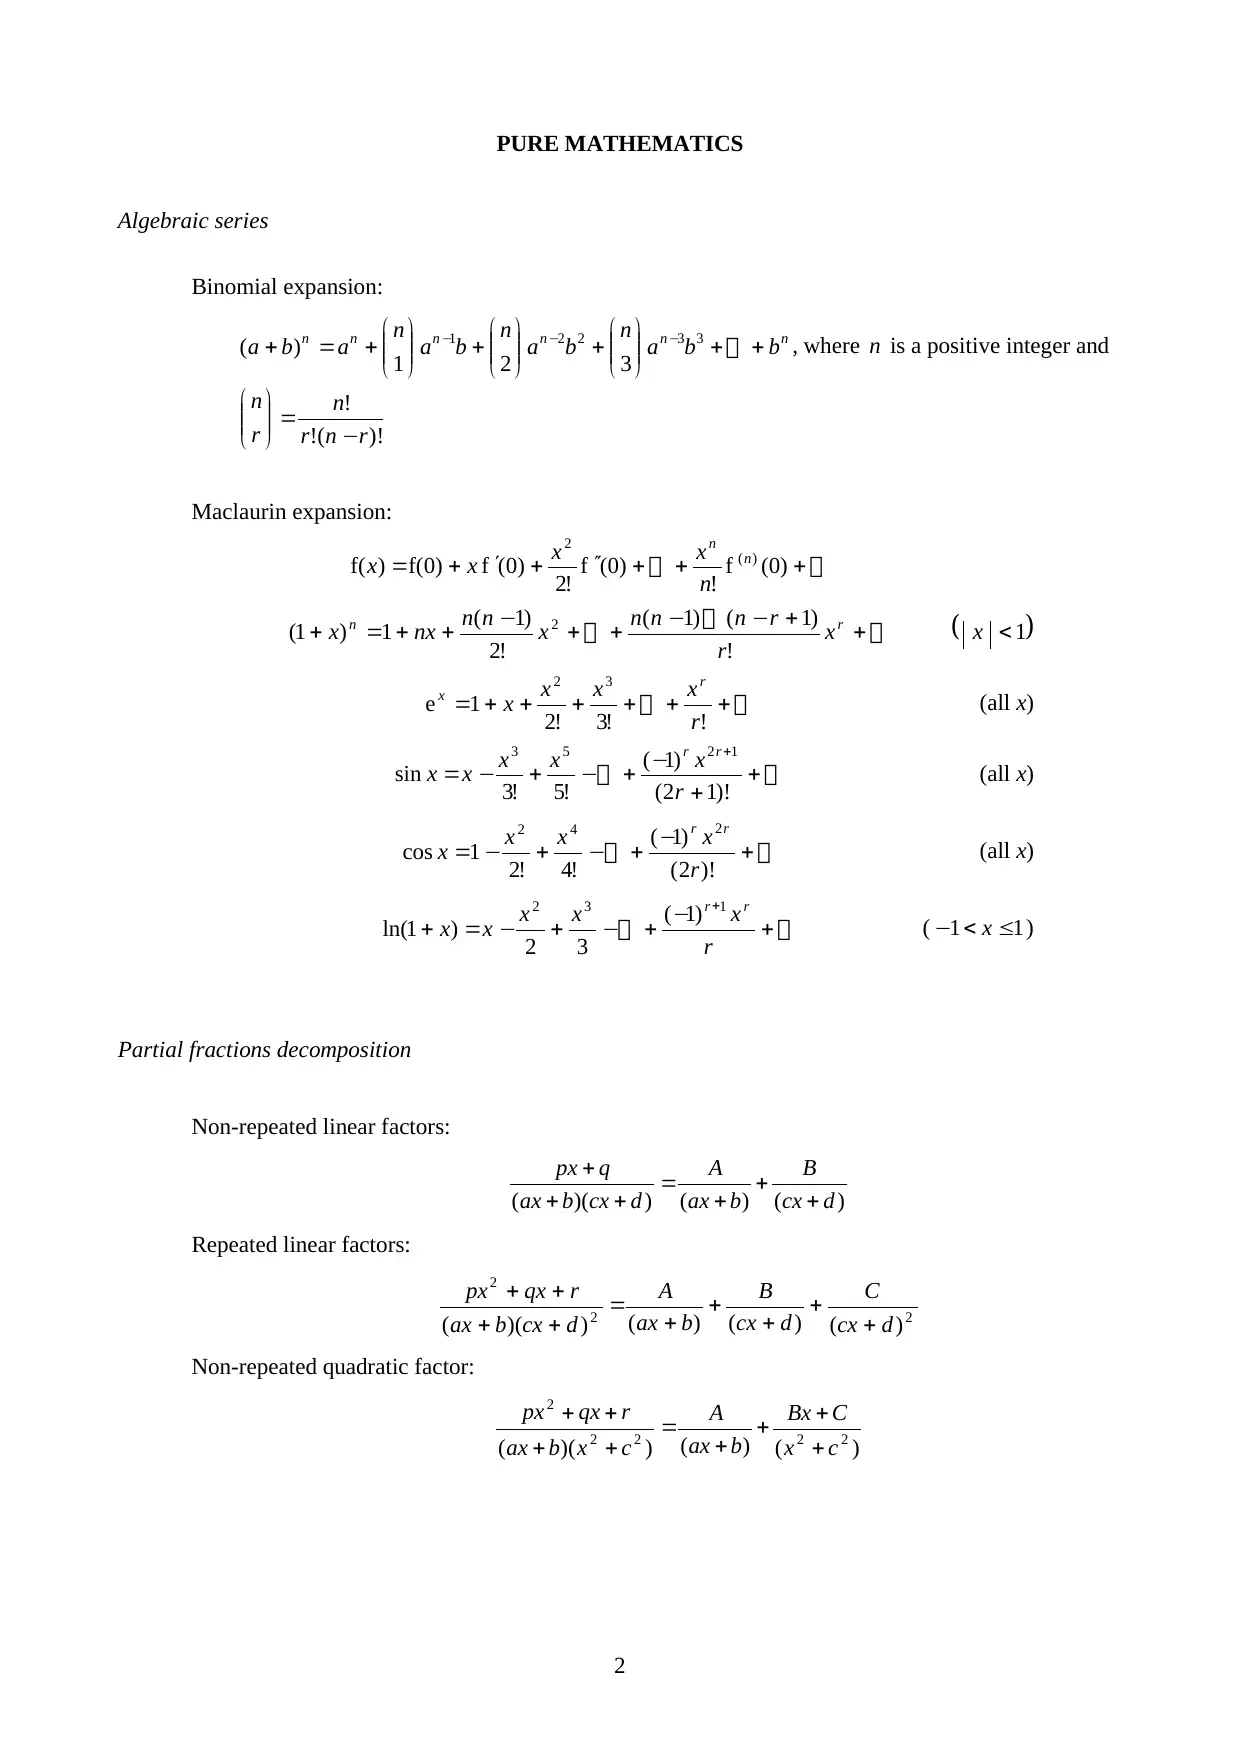
PURE MATHEMATICS
Algebraic series
Binomial expansion:
nnnnnn bba
n
ba
n
ba
n
aba ++
+
+
+=+ −−− 33221
321
)( , where n is a positive integer and
)!(!
!
rnr
n
r
n
−
=
Maclaurin expansion:
+++′′+′+= )0(f
!
)0(f
!2
)0(f)0f()f( )(
2 n
n
n
xx
xx
+
+−−
++
−
++=+ rn x
r
rnnn
x
nn
nxx !
)1()1(
!2
)1(
1)1( 2 ( )1<x
++++++= !!3!2
1e
32
r
xxx
x
r
x (all x)
+
+
−
+−+−=
+
)!12(
)1(
!5!3
sin
1253
r
xxx
xx
rr
(all x)
+
−
+−+−= )!2(
)1(
!4!2
1cos
242
r
xxx
x
rr
(all x)
+
−
+−+−=+
+
r
xxx
xx
rr 132 )1(
32
)1ln( ( 11 ≤<− x )
Partial fractions decomposition
Non-repeated linear factors:
)()())(( dcx
B
bax
A
dcxbax
qpx
+
+
+
=
++
+
Repeated linear factors:
22
2
)()()())(( dcx
C
dcx
B
bax
A
dcxbax
rqxpx
+
+
+
+
+
=
++
++
Non-repeated quadratic factor:
)()())(( 2222
2
cx
CBx
bax
A
cxbax
rqxpx
+
+
+
+
=
++
++
2
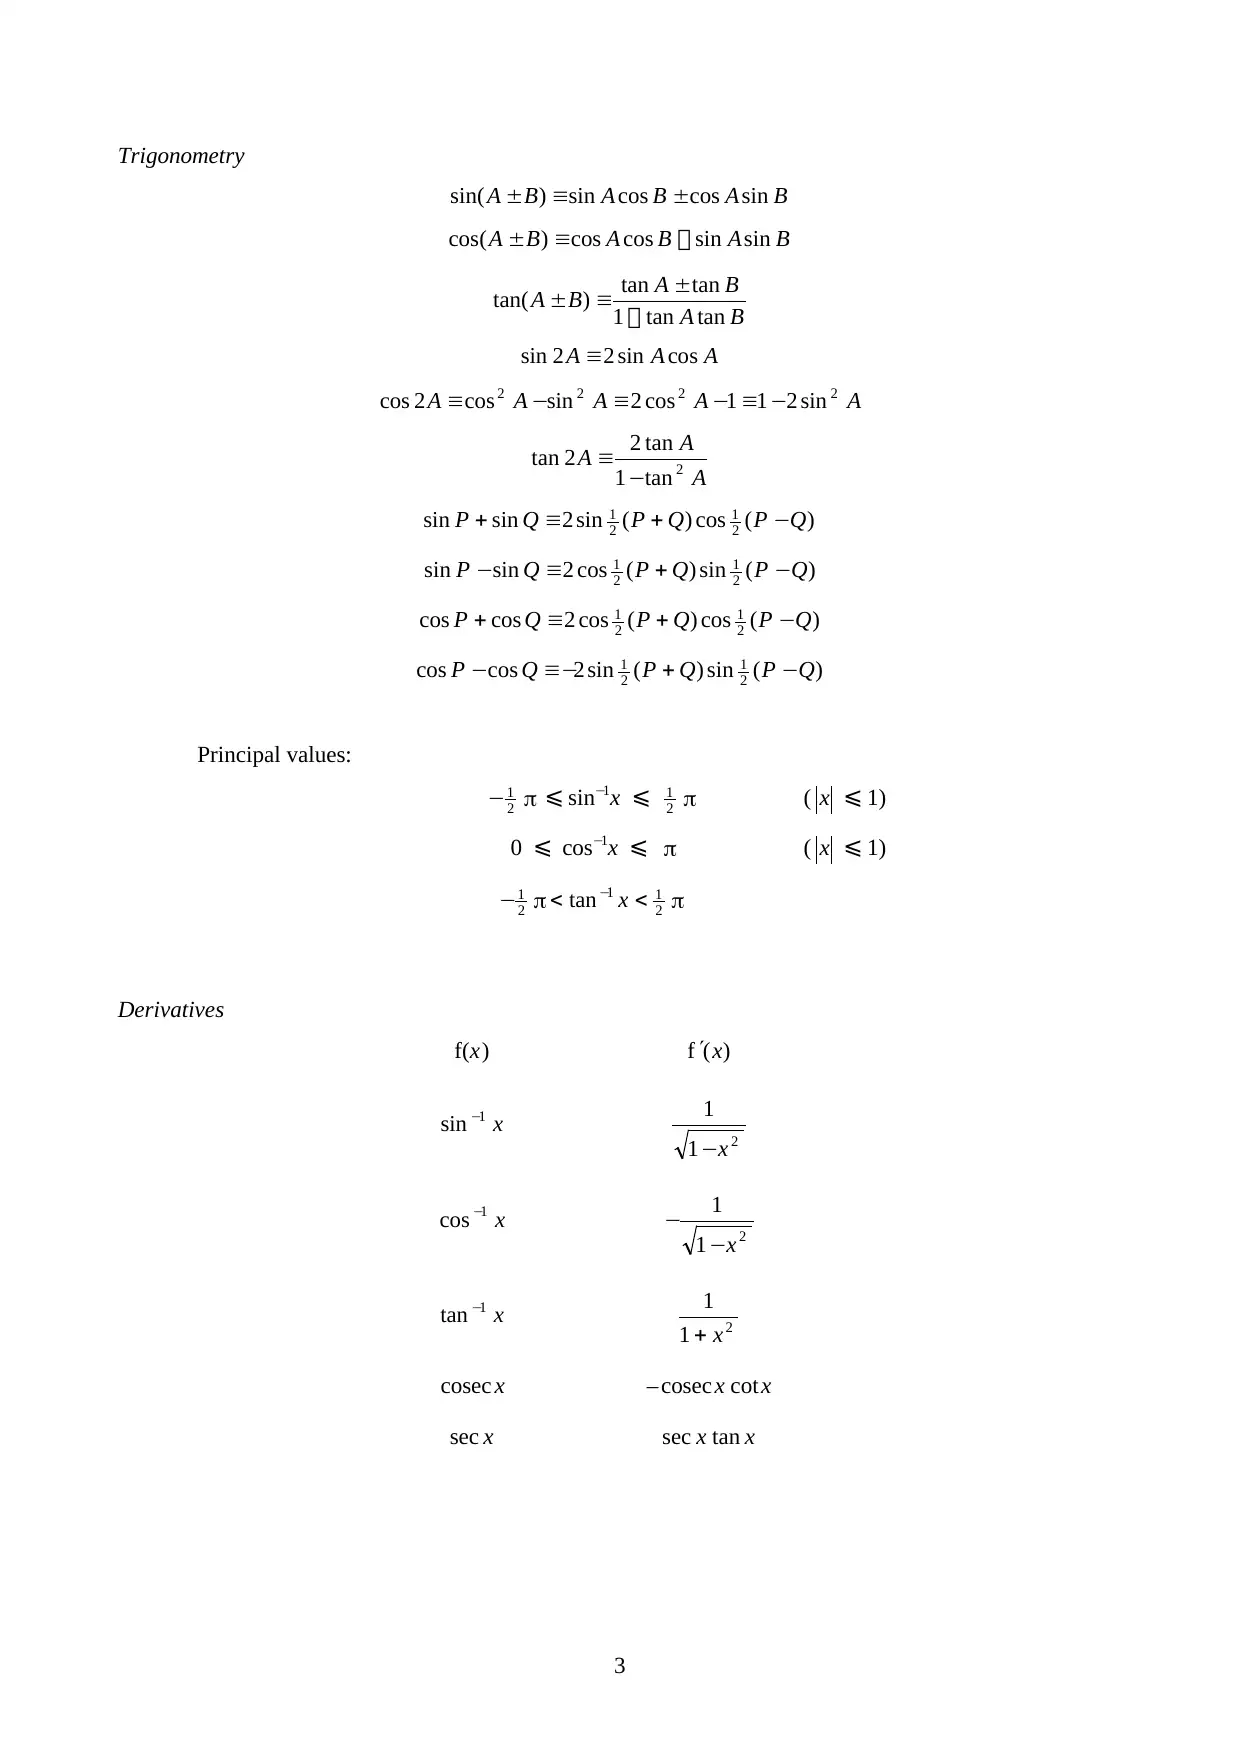
Trigonometry
BABABA sincoscossin)sin( ±≡±
BABABA sinsincoscos)cos( ≡±
BA
BA
BA tantan1
tantan
)tan(
±
≡±
AAA cossin22sin ≡
AAAAA 2222 sin211cos2sincos2cos −≡−≡−≡
A
A
A 2
tan1
tan2
2tan −
≡
)(cos)(sin2sinsin 2
1
2
1 QPQPQP −+≡+
)(sin)(cos2sinsin 2
1
2
1 QPQPQP −+≡−
)(cos)(cos2coscos 2
1
2
1 QPQPQP −+≡+
)(sin)(sin2coscos 2
1
2
1 QPQPQP −+−≡−
Principal values:
π2
1
− ⩽ sin−1x ⩽ π2
1 ( x ⩽ 1)
0 ⩽ cos−1x ⩽ π ( x ⩽ 1)
ππ 2
11
2
1 tan <<− − x
Derivatives
)f(x )(f x′
x1
sin −
2
1
1
x−
x1
cos −
2
1
1
x−
−
x1
tan −
2
1
1
x+
cosec x – cosec x cot x
xsec xx tansec
3
⊘ This is a preview!⊘
Do you want full access?
Subscribe today to unlock all pages.
Trusted by 1+ million students worldwide
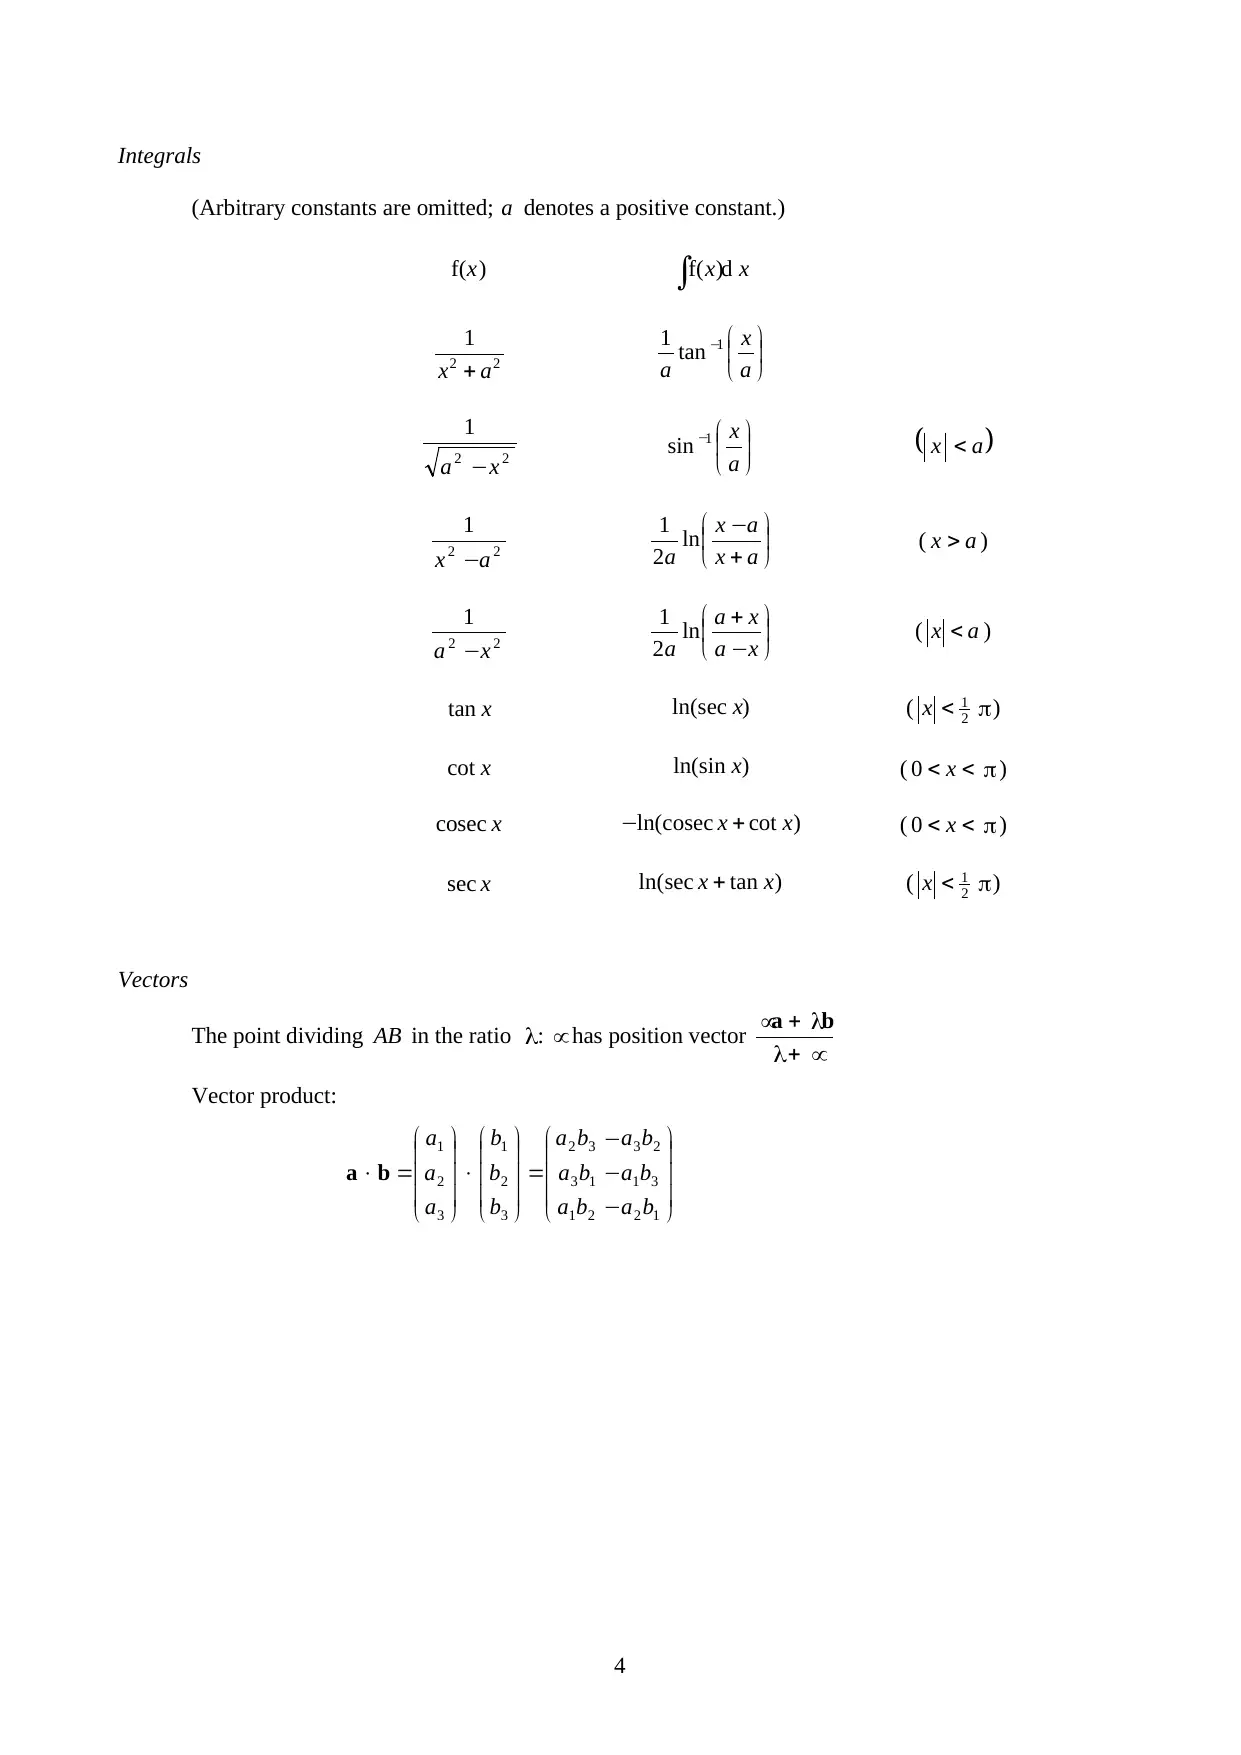
Integrals
(Arbitrary constants are omitted; a denotes a positive constant.)
)f(x xx d)f(∫
22
1
ax +
−
a
x
a
1
tan
1
22
1
xa −
−
a
x1
sin ( )ax <
22
1
ax −
+
−
ax
ax
a ln
2
1 ( ax > )
22
1
xa −
−
+
xa
xa
a ln
2
1 ( ax < )
xtan )ln(sec x ( π2
1
<x )
xcot )ln(sin x ( π<< x0 )
xcosec )cotln(cosec xx +− ( π<< x0 )
xsec )tanln(sec xx + ( π2
1
<x )
Vectors
The point dividing AB in the ratio μλ: has position vector μλ
λμ
+
+ ba
Vector product:
−
−
−
=
×
=×
1221
3113
2332
3
2
1
3
2
1
baba
baba
baba
b
b
b
a
a
a
ba
4
Paraphrase This Document
Need a fresh take? Get an instant paraphrase of this document with our AI Paraphraser
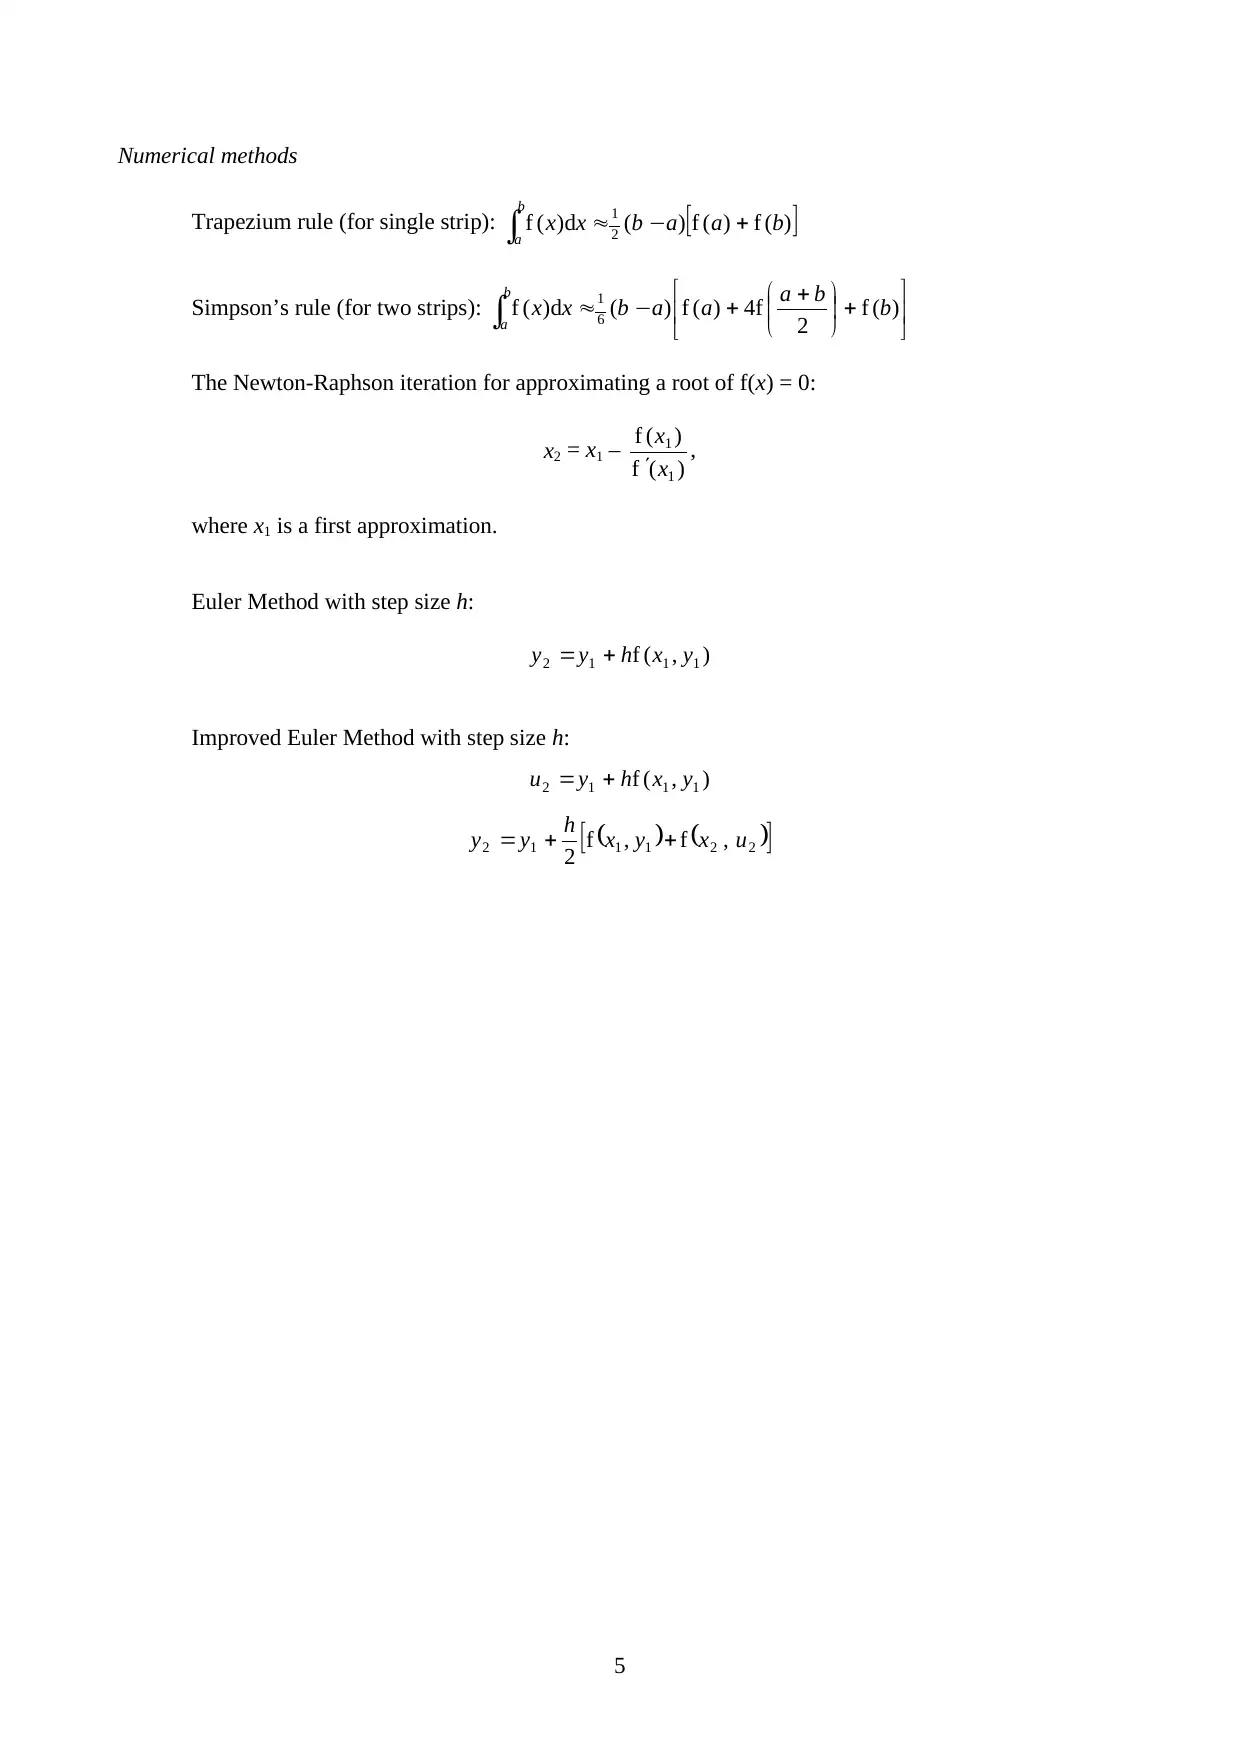
Numerical methods
Trapezium rule (for single strip): [ ]∫ +−≈
b
a baabxx 2
1 )(f)(f)(d)(f
Simpson’s rule (for two strips): ∫
+
+
+−≈
b
a b
ba
aabxx 6
1 )(f
2
f4)(f)(d)(f
The Newton-Raphson iteration for approximating a root of f(x) = 0:
x2 = x1 – )(f
)(f
1
1
x
x
′ ,
where x1 is a first approximation.
Euler Method with step size h:
),(f 1112 yxhyy +=
Improved Euler Method with step size h:
),(f 1112 yxhyu +=
( ) ( )[ ]221112 ,f,f
2 uxyx
h
yy ++=
5
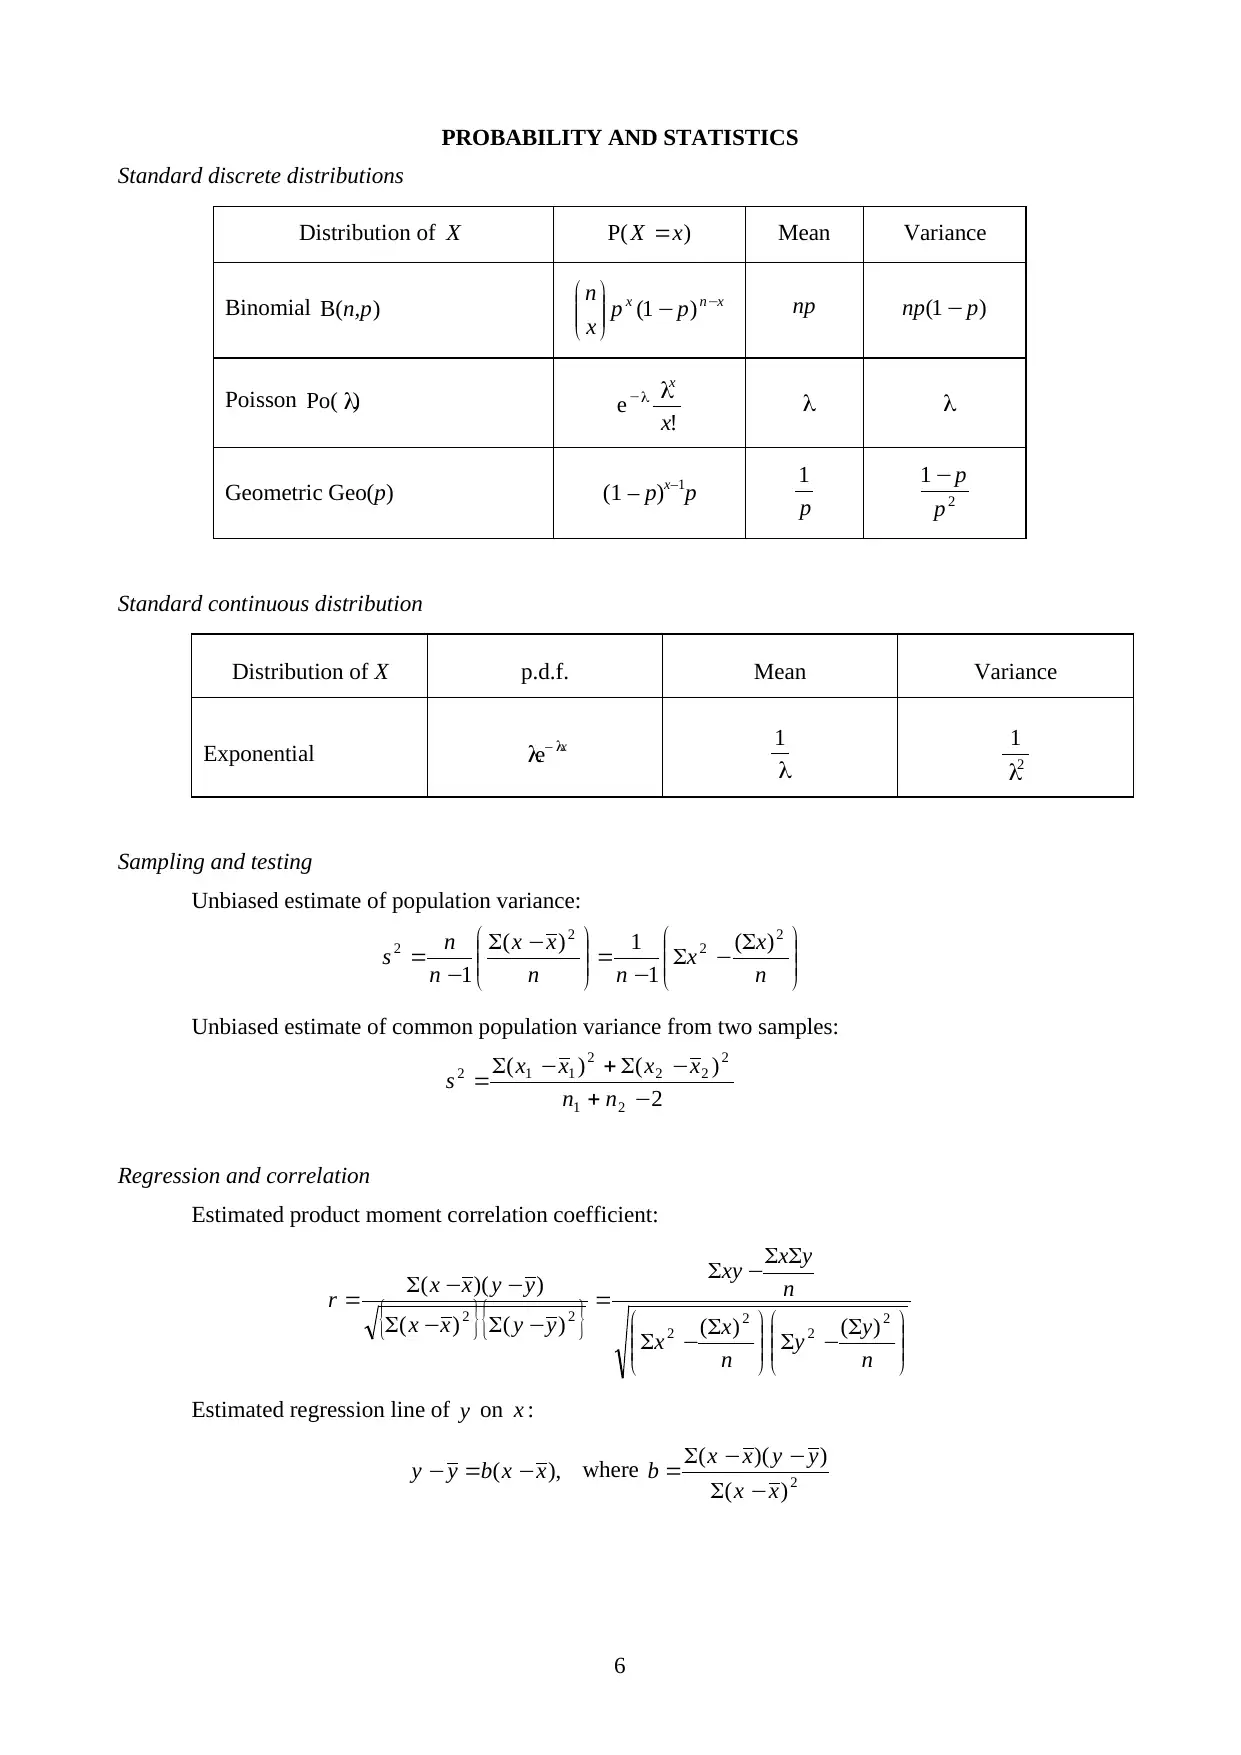
PROBABILITY AND STATISTICS
Standard discrete distributions
Distribution of X )P( xX = Mean Variance
Binomial )B(n,p xnx pp
x
n −
−
)1( np )1( pnp −
Poisson )Po( λ !
e x
x
λλ− λ λ
Geometric Geo(p) (1 – p)x–1p p
1
2
1
p
p−
Standard continuous distribution
Distribution of X p.d.f. Mean Variance
Exponential λe– λx
λ
1
2
1
λ
Sampling and testing
Unbiased estimate of population variance:
Σ
−Σ
−
=
−Σ
−
= n
x
x
nn
xx
n
n
s
2
2
2
2 )(
1
1)(
1
Unbiased estimate of common population variance from two samples:
2
)()(
21
2
22
2
112
−+
−Σ+−Σ
= nn
xxxx
s
Regression and correlation
Estimated product moment correlation coefficient:
{ }{ }
Σ
−Σ
Σ
−Σ
ΣΣ
−Σ
=
−Σ−Σ
−−Σ
=
n
y
y
n
x
x
n
yx
xy
yyxx
yyxx
r 2
2
2
2
22 )()()()(
))((
Estimated regression line of y on x :
,)( xxbyy −=− where 2
)(
))((
xx
yyxx
b −Σ
−−Σ
=
6
⊘ This is a preview!⊘
Do you want full access?
Subscribe today to unlock all pages.
Trusted by 1+ million students worldwide
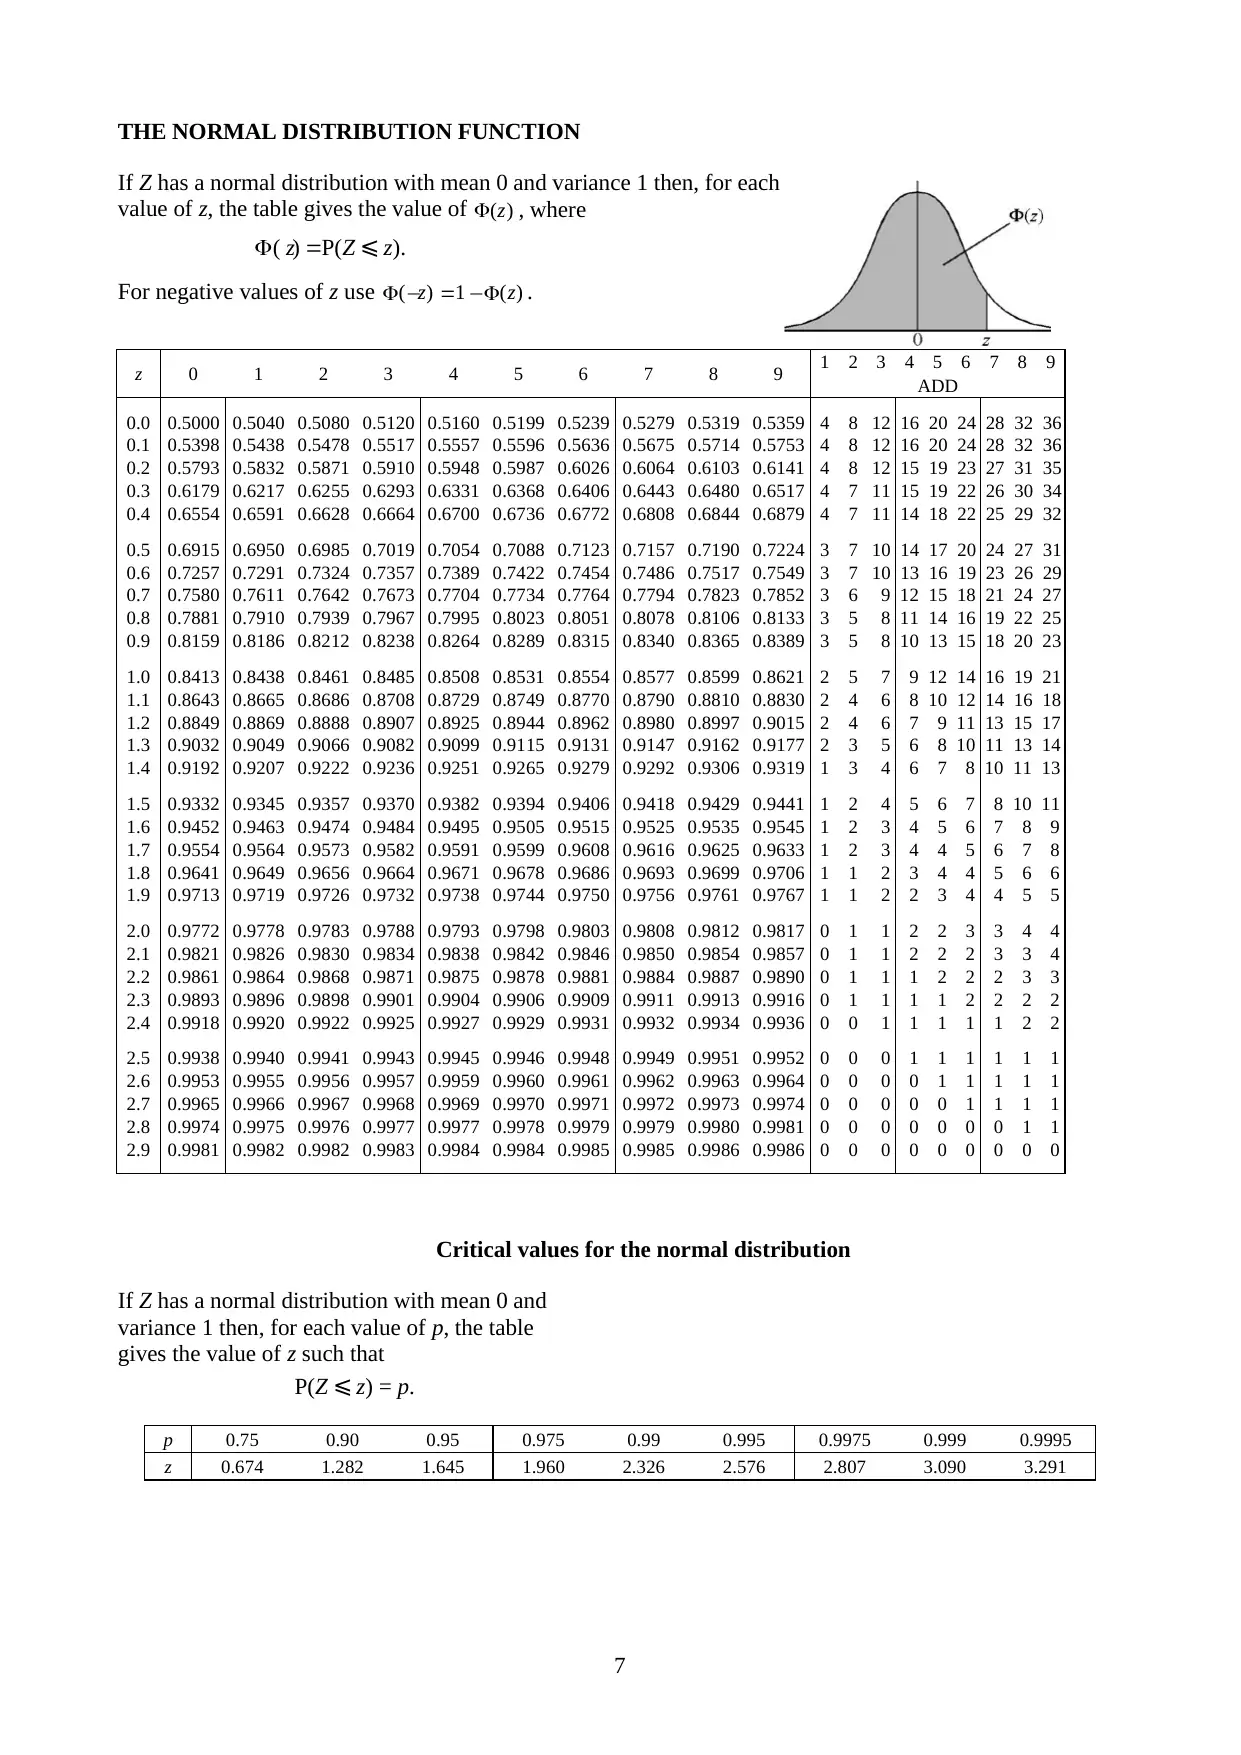
THE NORMAL DISTRIBUTION FUNCTION
If Z has a normal distribution with mean 0 and variance 1 then, for each
value of z, the table gives the value of )(zΦ , where
=Φ )( z P(Z ⩽ z).
For negative values of z use )(1)( zz Φ−=−Φ .
z 0 1 2 3 4 5 6 7 8 9 1 2 3 4 5 6 7 8 9
ADD
0.0 0.5000 0.5040 0.5080 0.5120 0.5160 0.5199 0.5239 0.5279 0.5319 0.5359 4 8 12 16 20 24 28 32 36
0.1 0.5398 0.5438 0.5478 0.5517 0.5557 0.5596 0.5636 0.5675 0.5714 0.5753 4 8 12 16 20 24 28 32 36
0.2 0.5793 0.5832 0.5871 0.5910 0.5948 0.5987 0.6026 0.6064 0.6103 0.6141 4 8 12 15 19 23 27 31 35
0.3 0.6179 0.6217 0.6255 0.6293 0.6331 0.6368 0.6406 0.6443 0.6480 0.6517 4 7 11 15 19 22 26 30 34
0.4 0.6554 0.6591 0.6628 0.6664 0.6700 0.6736 0.6772 0.6808 0.6844 0.6879 4 7 11 14 18 22 25 29 32
0.5 0.6915 0.6950 0.6985 0.7019 0.7054 0.7088 0.7123 0.7157 0.7190 0.7224 3 7 10 14 17 20 24 27 31
0.6 0.7257 0.7291 0.7324 0.7357 0.7389 0.7422 0.7454 0.7486 0.7517 0.7549 3 7 10 13 16 19 23 26 29
0.7 0.7580 0.7611 0.7642 0.7673 0.7704 0.7734 0.7764 0.7794 0.7823 0.7852 3 6 9 12 15 18 21 24 27
0.8 0.7881 0.7910 0.7939 0.7967 0.7995 0.8023 0.8051 0.8078 0.8106 0.8133 3 5 8 11 14 16 19 22 25
0.9 0.8159 0.8186 0.8212 0.8238 0.8264 0.8289 0.8315 0.8340 0.8365 0.8389 3 5 8 10 13 15 18 20 23
1.0 0.8413 0.8438 0.8461 0.8485 0.8508 0.8531 0.8554 0.8577 0.8599 0.8621 2 5 7 9 12 14 16 19 21
1.1 0.8643 0.8665 0.8686 0.8708 0.8729 0.8749 0.8770 0.8790 0.8810 0.8830 2 4 6 8 10 12 14 16 18
1.2 0.8849 0.8869 0.8888 0.8907 0.8925 0.8944 0.8962 0.8980 0.8997 0.9015 2 4 6 7 9 11 13 15 17
1.3 0.9032 0.9049 0.9066 0.9082 0.9099 0.9115 0.9131 0.9147 0.9162 0.9177 2 3 5 6 8 10 11 13 14
1.4 0.9192 0.9207 0.9222 0.9236 0.9251 0.9265 0.9279 0.9292 0.9306 0.9319 1 3 4 6 7 8 10 11 13
1.5 0.9332 0.9345 0.9357 0.9370 0.9382 0.9394 0.9406 0.9418 0.9429 0.9441 1 2 4 5 6 7 8 10 11
1.6 0.9452 0.9463 0.9474 0.9484 0.9495 0.9505 0.9515 0.9525 0.9535 0.9545 1 2 3 4 5 6 7 8 9
1.7 0.9554 0.9564 0.9573 0.9582 0.9591 0.9599 0.9608 0.9616 0.9625 0.9633 1 2 3 4 4 5 6 7 8
1.8 0.9641 0.9649 0.9656 0.9664 0.9671 0.9678 0.9686 0.9693 0.9699 0.9706 1 1 2 3 4 4 5 6 6
1.9 0.9713 0.9719 0.9726 0.9732 0.9738 0.9744 0.9750 0.9756 0.9761 0.9767 1 1 2 2 3 4 4 5 5
2.0 0.9772 0.9778 0.9783 0.9788 0.9793 0.9798 0.9803 0.9808 0.9812 0.9817 0 1 1 2 2 3 3 4 4
2.1 0.9821 0.9826 0.9830 0.9834 0.9838 0.9842 0.9846 0.9850 0.9854 0.9857 0 1 1 2 2 2 3 3 4
2.2 0.9861 0.9864 0.9868 0.9871 0.9875 0.9878 0.9881 0.9884 0.9887 0.9890 0 1 1 1 2 2 2 3 3
2.3 0.9893 0.9896 0.9898 0.9901 0.9904 0.9906 0.9909 0.9911 0.9913 0.9916 0 1 1 1 1 2 2 2 2
2.4 0.9918 0.9920 0.9922 0.9925 0.9927 0.9929 0.9931 0.9932 0.9934 0.9936 0 0 1 1 1 1 1 2 2
2.5 0.9938 0.9940 0.9941 0.9943 0.9945 0.9946 0.9948 0.9949 0.9951 0.9952 0 0 0 1 1 1 1 1 1
2.6 0.9953 0.9955 0.9956 0.9957 0.9959 0.9960 0.9961 0.9962 0.9963 0.9964 0 0 0 0 1 1 1 1 1
2.7 0.9965 0.9966 0.9967 0.9968 0.9969 0.9970 0.9971 0.9972 0.9973 0.9974 0 0 0 0 0 1 1 1 1
2.8 0.9974 0.9975 0.9976 0.9977 0.9977 0.9978 0.9979 0.9979 0.9980 0.9981 0 0 0 0 0 0 0 1 1
2.9 0.9981 0.9982 0.9982 0.9983 0.9984 0.9984 0.9985 0.9985 0.9986 0.9986 0 0 0 0 0 0 0 0 0
Critical values for the normal distribution
If Z has a normal distribution with mean 0 and
variance 1 then, for each value of p, the table
gives the value of z such that
P(Z ⩽ z) = p.
p 0.75 0.90 0.95 0.975 0.99 0.995 0.9975 0.999 0.9995
z 0.674 1.282 1.645 1.960 2.326 2.576 2.807 3.090 3.291
7
Paraphrase This Document
Need a fresh take? Get an instant paraphrase of this document with our AI Paraphraser
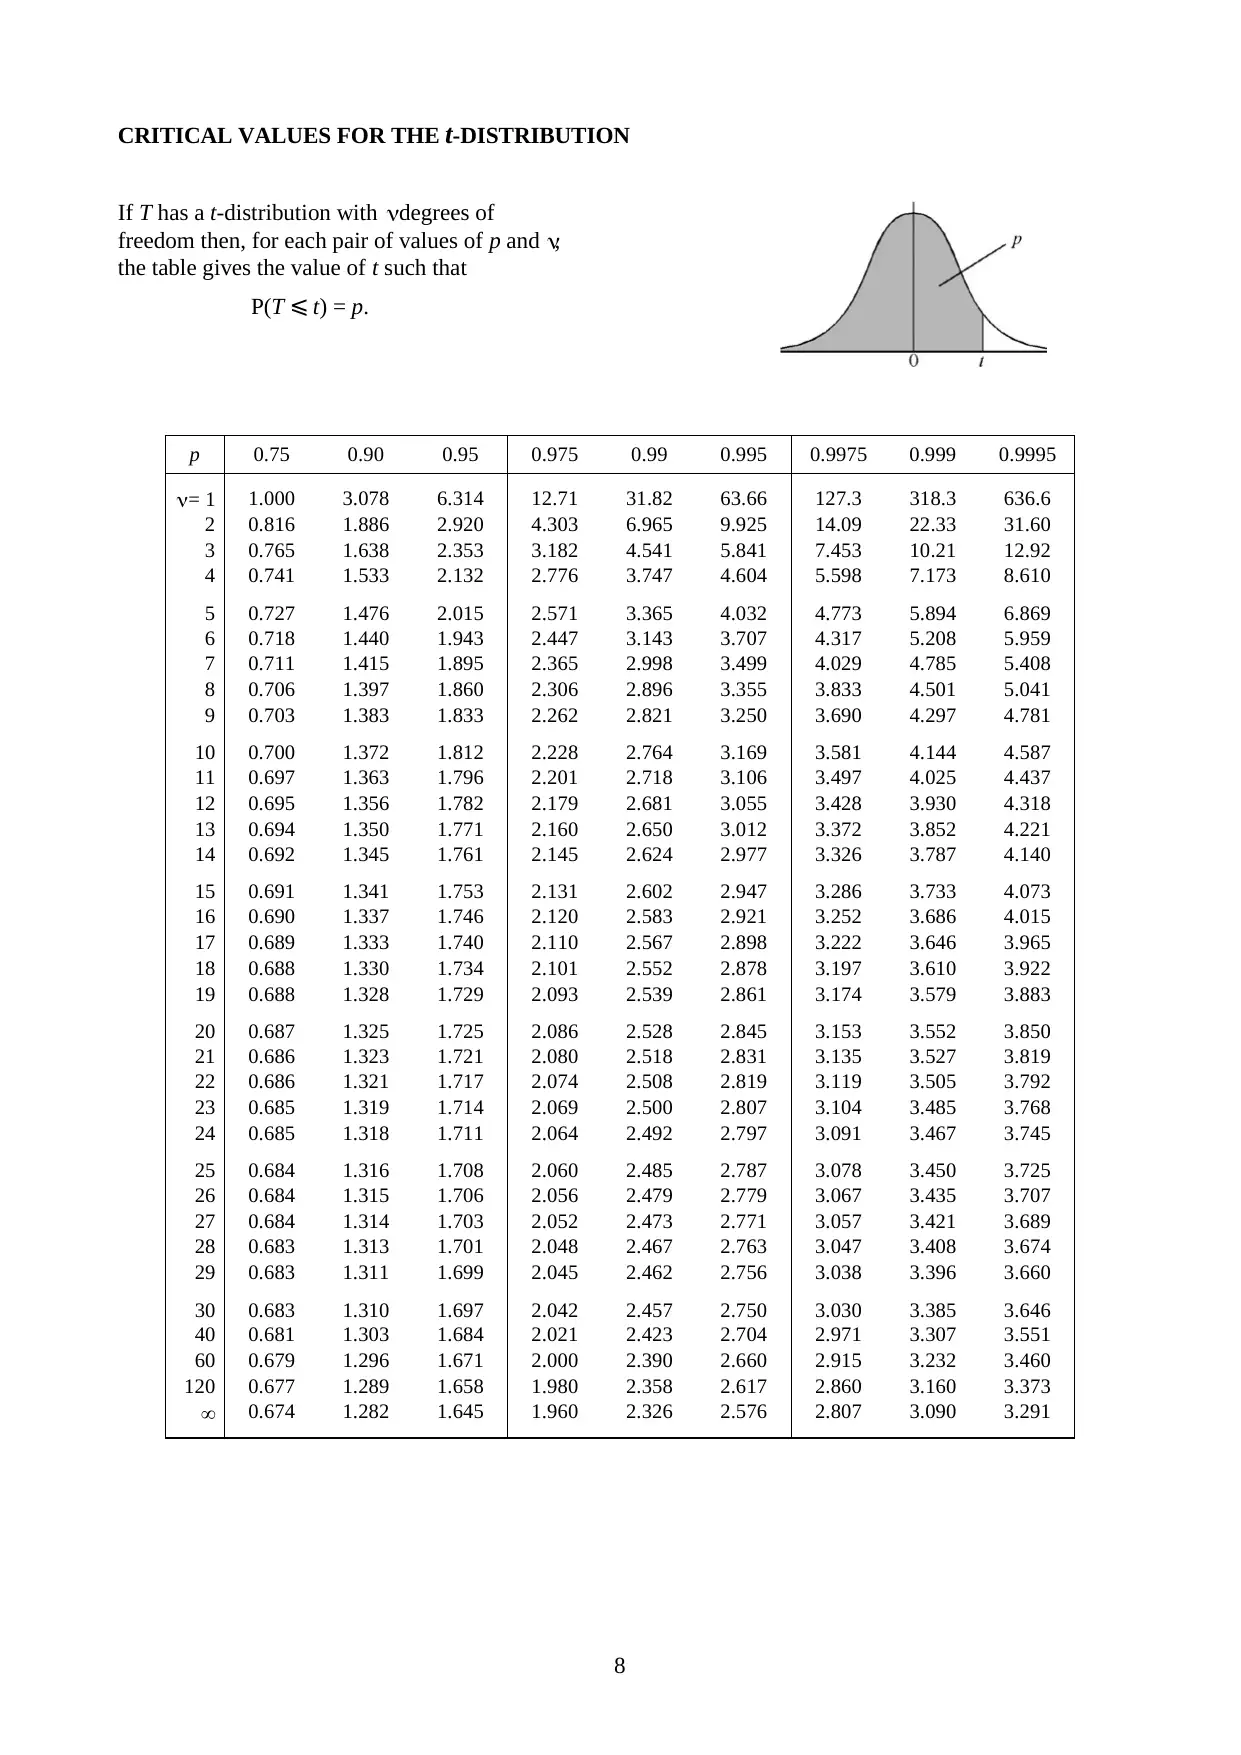
CRITICAL VALUES FOR THE t-DISTRIBUTION
If T has a t-distribution with νdegrees of
freedom then, for each pair of values of p and ν,
the table gives the value of t such that
P(T ⩽ t) = p.
p 0.75 0.90 0.95 0.975 0.99 0.995 0.9975 0.999 0.9995
ν= 1 1.000 3.078 6.314 12.71 31.82 63.66 127.3 318.3 636.6
2 0.816 1.886 2.920 4.303 6.965 9.925 14.09 22.33 31.60
3 0.765 1.638 2.353 3.182 4.541 5.841 7.453 10.21 12.92
4 0.741 1.533 2.132 2.776 3.747 4.604 5.598 7.173 8.610
5 0.727 1.476 2.015 2.571 3.365 4.032 4.773 5.894 6.869
6 0.718 1.440 1.943 2.447 3.143 3.707 4.317 5.208 5.959
7 0.711 1.415 1.895 2.365 2.998 3.499 4.029 4.785 5.408
8 0.706 1.397 1.860 2.306 2.896 3.355 3.833 4.501 5.041
9 0.703 1.383 1.833 2.262 2.821 3.250 3.690 4.297 4.781
10 0.700 1.372 1.812 2.228 2.764 3.169 3.581 4.144 4.587
11 0.697 1.363 1.796 2.201 2.718 3.106 3.497 4.025 4.437
12 0.695 1.356 1.782 2.179 2.681 3.055 3.428 3.930 4.318
13 0.694 1.350 1.771 2.160 2.650 3.012 3.372 3.852 4.221
14 0.692 1.345 1.761 2.145 2.624 2.977 3.326 3.787 4.140
15 0.691 1.341 1.753 2.131 2.602 2.947 3.286 3.733 4.073
16 0.690 1.337 1.746 2.120 2.583 2.921 3.252 3.686 4.015
17 0.689 1.333 1.740 2.110 2.567 2.898 3.222 3.646 3.965
18 0.688 1.330 1.734 2.101 2.552 2.878 3.197 3.610 3.922
19 0.688 1.328 1.729 2.093 2.539 2.861 3.174 3.579 3.883
20 0.687 1.325 1.725 2.086 2.528 2.845 3.153 3.552 3.850
21 0.686 1.323 1.721 2.080 2.518 2.831 3.135 3.527 3.819
22 0.686 1.321 1.717 2.074 2.508 2.819 3.119 3.505 3.792
23 0.685 1.319 1.714 2.069 2.500 2.807 3.104 3.485 3.768
24 0.685 1.318 1.711 2.064 2.492 2.797 3.091 3.467 3.745
25 0.684 1.316 1.708 2.060 2.485 2.787 3.078 3.450 3.725
26 0.684 1.315 1.706 2.056 2.479 2.779 3.067 3.435 3.707
27 0.684 1.314 1.703 2.052 2.473 2.771 3.057 3.421 3.689
28 0.683 1.313 1.701 2.048 2.467 2.763 3.047 3.408 3.674
29 0.683 1.311 1.699 2.045 2.462 2.756 3.038 3.396 3.660
30 0.683 1.310 1.697 2.042 2.457 2.750 3.030 3.385 3.646
40 0.681 1.303 1.684 2.021 2.423 2.704 2.971 3.307 3.551
60 0.679 1.296 1.671 2.000 2.390 2.660 2.915 3.232 3.460
120 0.677 1.289 1.658 1.980 2.358 2.617 2.860 3.160 3.373
∞ 0.674 1.282 1.645 1.960 2.326 2.576 2.807 3.090 3.291
8
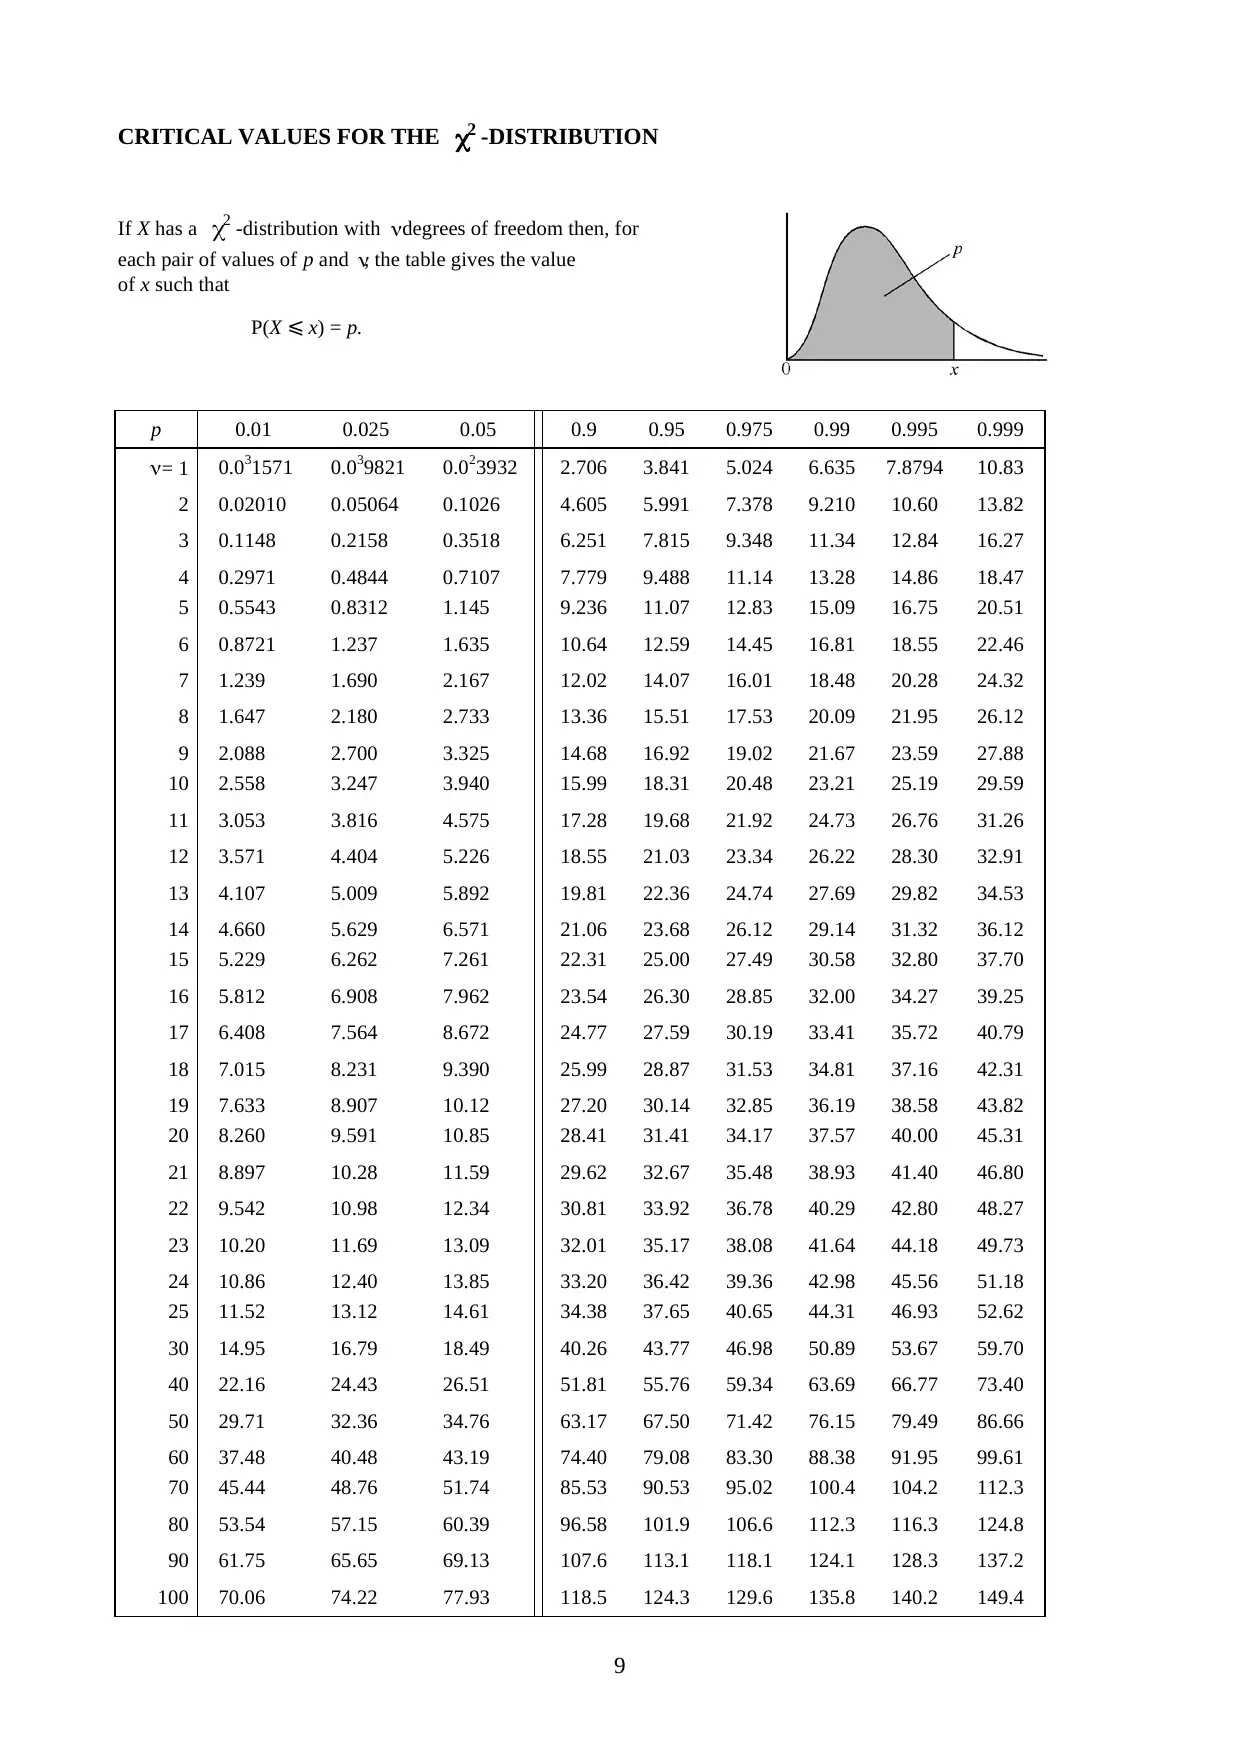
CRITICAL VALUES FOR THE 2
χ -DISTRIBUTION
If X has a 2
χ -distribution with νdegrees of freedom then, for
each pair of values of p and ν, the table gives the value
of x such that
P(X ⩽ x) = p.
p 0.01 0.025 0.05 0.9 0.95 0.975 0.99 0.995 0.999
ν= 1 0.031571 0.039821 0.023932 2.706 3.841 5.024 6.635 7.8794 10.83
2 0.02010 0.05064 0.1026 4.605 5.991 7.378 9.210 10.60 13.82
3 0.1148 0.2158 0.3518 6.251 7.815 9.348 11.34 12.84 16.27
4 0.2971 0.4844 0.7107 7.779 9.488 11.14 13.28 14.86 18.47
5 0.5543 0.8312 1.145 9.236 11.07 12.83 15.09 16.75 20.51
6 0.8721 1.237 1.635 10.64 12.59 14.45 16.81 18.55 22.46
7 1.239 1.690 2.167 12.02 14.07 16.01 18.48 20.28 24.32
8 1.647 2.180 2.733 13.36 15.51 17.53 20.09 21.95 26.12
9 2.088 2.700 3.325 14.68 16.92 19.02 21.67 23.59 27.88
10 2.558 3.247 3.940 15.99 18.31 20.48 23.21 25.19 29.59
11 3.053 3.816 4.575 17.28 19.68 21.92 24.73 26.76 31.26
12 3.571 4.404 5.226 18.55 21.03 23.34 26.22 28.30 32.91
13 4.107 5.009 5.892 19.81 22.36 24.74 27.69 29.82 34.53
14 4.660 5.629 6.571 21.06 23.68 26.12 29.14 31.32 36.12
15 5.229 6.262 7.261 22.31 25.00 27.49 30.58 32.80 37.70
16 5.812 6.908 7.962 23.54 26.30 28.85 32.00 34.27 39.25
17 6.408 7.564 8.672 24.77 27.59 30.19 33.41 35.72 40.79
18 7.015 8.231 9.390 25.99 28.87 31.53 34.81 37.16 42.31
19 7.633 8.907 10.12 27.20 30.14 32.85 36.19 38.58 43.82
20 8.260 9.591 10.85 28.41 31.41 34.17 37.57 40.00 45.31
21 8.897 10.28 11.59 29.62 32.67 35.48 38.93 41.40 46.80
22 9.542 10.98 12.34 30.81 33.92 36.78 40.29 42.80 48.27
23 10.20 11.69 13.09 32.01 35.17 38.08 41.64 44.18 49.73
24 10.86 12.40 13.85 33.20 36.42 39.36 42.98 45.56 51.18
25 11.52 13.12 14.61 34.38 37.65 40.65 44.31 46.93 52.62
30 14.95 16.79 18.49 40.26 43.77 46.98 50.89 53.67 59.70
40 22.16 24.43 26.51 51.81 55.76 59.34 63.69 66.77 73.40
50 29.71 32.36 34.76 63.17 67.50 71.42 76.15 79.49 86.66
60 37.48 40.48 43.19 74.40 79.08 83.30 88.38 91.95 99.61
70 45.44 48.76 51.74 85.53 90.53 95.02 100.4 104.2 112.3
80 53.54 57.15 60.39 96.58 101.9 106.6 112.3 116.3 124.8
90 61.75 65.65 69.13 107.6 113.1 118.1 124.1 128.3 137.2
100 70.06 74.22 77.93 118.5 124.3 129.6 135.8 140.2 149.4
9
⊘ This is a preview!⊘
Do you want full access?
Subscribe today to unlock all pages.
Trusted by 1+ million students worldwide

WILCOXON SIGNED RANK TEST
P is the sum of the ranks corresponding to the positive differences,
Q is the sum of the ranks corresponding to the negative differences,
T is the smaller of P and Q.
For each value of n the table gives the largest value of T which will lead to rejection of the null hypothesis at
the level of significance indicated.
Critical values of T
Level of significance
One Tail 0.05 0.025 0.01 0.005
Two Tail 0.1 0.05 0.02 0.01
n = 6 2 0
7 3 2 0
8 5 3 1 0
9 8 5 3 1
10 10 8 5 3
11 13 10 7 5
12 17 13 9 7
13 21 17 12 9
14 25 21 15 12
15 30 25 19 15
16 35 29 23 19
17 41 34 27 23
18 47 40 32 27
19 53 46 37 32
20 60 52 43 37
For larger values of n , each of P and Q can be approximated by the normal distribution with mean
1
4 ( 1)n n + and variance 1
24 ( 1)(2 1)n n n+ + .
10
Paraphrase This Document
Need a fresh take? Get an instant paraphrase of this document with our AI Paraphraser

BLANK PAGE
11
11

This booklet is the property of
SINGAPORE EXAMINATIONS AND ASSESSMENT BOARD
12
SINGAPORE EXAMINATIONS AND ASSESSMENT BOARD
12
⊘ This is a preview!⊘
Do you want full access?
Subscribe today to unlock all pages.
Trusted by 1+ million students worldwide
1 out of 12
Related Documents


Your All-in-One AI-Powered Toolkit for Academic Success.
+13062052269
info@desklib.com
Available 24*7 on WhatsApp / Email
![[object Object]](/_next/static/media/star-bottom.7253800d.svg)
Unlock your academic potential
Copyright © 2020–2026 A2Z Services. All Rights Reserved. Developed and managed by ZUCOL.