ICT706 Data Analytics: Data Analysis and Sales Prediction for Cameras
VerifiedAdded on 2024/06/04
|25
|3377
|113
Report
AI Summary
This project report focuses on leveraging data analytics and Python to enhance the usability of a camera sales data model for effective decision-making. A dummy dataset is created to facilitate better analysis, with Python code generating training and testing graphs, along with regression models to predict sales. The analysis aims to assist a camera company's board of directors in understanding monthly sales data, identifying product priorities, and making informed decisions to increase profit. Key findings include geographic region targeting, product prioritization, and the impact of free shipping on sales, providing actionable recommendations for the company's implementation.

ICT706 Data Analytics
Paraphrase This Document
Need a fresh take? Get an instant paraphrase of this document with our AI Paraphraser
EXECUTIVE SUMMARY
The main aim of this project report is to use the basics of the Data Analytics and some tools
in order to increase the usability of the data model and to help in making an effective solution
that can help in making a decision in order to find out the products priority with the help of
the raw data sets. A dummy dataset is developed that is going to help in making the better
decision analysis with the help of Python Code. The Python Code is going to helpful in
generating the Graphs these graphs these graphs include Test Graphs over the dataset and the
Training Graph over the Dataset. There are other graphs too that are going to be helpful in
depicting the Regression Model Graphs. These graphs will give an insight into the type of
data and the Sales could be predicted using that.
For analysing the dataset, the company is going to need help for understanding the raw data
and make some predictions over it using the Some relations. Board of Directors of the
company need a Data Scientist that could be able to depict the monthly sales data and help in
making a better prediction for their sales and help them in gaining profit using that prediction
model. The Dataset that is going to be used is Camera Dataset.
1
Table of Contents
EXECUTIVE SUMMARY........................................................................................................2
ASSUMPTIONS MADE...........................................................................................................5
BACKGROUND........................................................................................................................6
INTRODUCTION......................................................................................................................7
RESEARCH METHODOLOGY...............................................................................................8
QUALITATIVE METHODOLOGY:....................................................................................8
QUANTITATIVE METHODOLOGY:.................................................................................9
ANALYTICAL FINDINGS....................................................................................................10
DATASET:...........................................................................................................................10
CLUSTERING AND DATA MINING:..............................................................................11
DATA TRAINING AND TESTING...................................................................................14
RECOMMENDATION BASED ON ANALYSIS..................................................................17
GEOGRAPHIC REGION THAT SHOULD BE TARGETED TO INCREASE SALES
AND GENERATE PROFIT.................................................................................................17
PRODUCT THAT SHOULD BE PRIORITIZED FOR SALES.........................................18
IMPACT ON SALE AFTER FREE SHIPPING..................................................................18
RECOMMENDATIONS FOR THE COMPANY...................................................................19
IMPLEMENTATION PLAN FOR THE RECOMMENDATIONS.......................................20
IMPLEMENTATION OF THE PYTHON CODE..................................................................21
CONCLUSION........................................................................................................................23
REFERENCES.........................................................................................................................24
APPENDIX..............................................................................................................................25
List of Figures
Figure 1: Camera Dataset in the gadgets.csv file.....................................................................10
Figure 2: Data Analysis............................................................................................................12
Figure 3: Graph Showing the launch year and the Customer who have bought the Camera of
that year....................................................................................................................................12
Figure 4: No of customer who bought the Product versus the Data........................................13
Figure 5: Product Prize versus Monthly Sales.........................................................................13
Figure 6: Training Graph for the Monthly Sales and the Camera Prize..................................14
Figure 7: Test Set implementation of the Dataset....................................................................14
Figure 8: Linear Regression.....................................................................................................15
Figure 9: Final Regression for Prediction................................................................................15
2
⊘ This is a preview!⊘
Do you want full access?
Subscribe today to unlock all pages.
Trusted by 1+ million students worldwide

Figure 10: Recommendations..................................................................................................17
Figure 11: Recommendation....................................................................................................18
Figure 12: main.py...................................................................................................................21
Figure 13: Test and Training plotting Over Dataset................................................................22
3
Paraphrase This Document
Need a fresh take? Get an instant paraphrase of this document with our AI Paraphraser
ASSUMPTIONS MADE
There are various assumptions that have been made in order to achieve the clarity over the
data:
Dataset is developed for the Camera Segment
Developed dataset is built from Scratch
Some dummy Geographic location of the places where the Camera had delivered is
added
A delivery person usage is not calculated
It consists of various number of Cameras from the previous years that are build till
now
4
BACKGROUND
Shopping is the most popular activity on the web. Anyone can display their pages, specific
good, and services. In 1991 internet was opened for commercial use and that time e-
commerce became possible. Since that year millions of business opened their pages for their
specific good and services. At first, e-commerce was only meant process of moneymaking
businesses with the help of innovative methods such as interchange of electronic information
and automated cash transfer (Orderhiven, 2018). Basically, the internet took 4 years to grown
up and in 2000 there are many companies in the US and Europe who represented their
services in the world.
Currently, there are 5 largest internet retailers. Those are:
1. Dell
2. Staples
3. Amazon
4. Hewlett Packard
5. Office Depot
According to the research of 2008, amazon.com have about 615 million users per year and
they like the best thing is their review system. e-commerce history is evolving like customer
advantages’ updating.
The company only sells cameras in limited areas and those areas that very repudiated image
of this company as its main department is camera and unlike other e-commerce company, it
does not indulge with the sellers for the process of delivery. Also, the Customer service of
this company is very supportive.
5
⊘ This is a preview!⊘
Do you want full access?
Subscribe today to unlock all pages.
Trusted by 1+ million students worldwide
INTRODUCTION
E-commerce is known as electronic commerce. Electronic commerce is the process of
purchasing and selling products on online websites. E-commerce is a most famous method of
making money on the internet and a great opportunity. Many companies and start-ups are
fighting with each other to be on top and the technology became advanced so it is tougher for
them to reach their goals(Embitel, 2018). Electronic commerce is not used for only sales but
covers also: consulting of users, online payment, preparations of estimates online, real-time
management of product and item possibility, after sale services and delivery tracking.
This report is useful for an electronic commerce company or organization those want to
improve their profit by data analytics. This report tells about last month sales and how can we
increase in sell in an upcoming month. It takes care of what product should be prioritized,
what product can give with free shipping and by using python programming it is done. It
takes care of what be to prioritize, what product can give with free shipping and by using
python programming it is done.
6
Paraphrase This Document
Need a fresh take? Get an instant paraphrase of this document with our AI Paraphraser
RESEARCH METHODOLOGY
The goal of this research is to identify answers to question from the action of scientific
methods. the main purpose of research is to search the fact which is invisible. there are many
types of the research methodology such as story completion test, sentence completion test,
and other techniques. Research methodology is a procedure or method used to select,
identify, process and evaluate information about a subject.
Research methodology is a method to store data and information with the intention of
building a business. The research methodology may involve interviews, publication research,
surveys and different research methods, and could involve both historical and present
information. It is a symmetrical idea to resolve a problem. Research methodology examines
and generates study designs, research process, and dimension instruments especially for
human-associated research. Research methodology basically divided into 2 parts. Such as
1. Qualitative research
2. Quantitative research
QUALITATIVE METHODOLOGY:
Qualitative research methodology is related to qualitative phenomenon; this phenomenon
involves quality or property. Motivation research is a type of qualitative research
methodology. The goal of Motivation research is to identify the underlying desires and
motives, using in deep interviews for the reason. This research methodology is very crucial in
the behavioural science which is used to identify human behaviour (Krishnakumar 2018).
Qualitative research is used to handle those events that are impossible or difficult to quantify
mathematically. Like meanings, symbols, attributes, and beliefs.
Benefits of Qualitative research methodology:
Good for hypothesis generation and explorative research
The contributor is capable to provide information in their particular words
Fewer assumption and restriction are located on the information to be composed
Limitations of Qualitative research methodology:
Time consuming
It is very difficult to identify the reliability and validity of lingual data or information
Data or information overload
There are 5 kinds of qualitative methodology:
Case study
Ethnography
Grounded theory
Narrative
Phenomenological
7
QUANTITATIVE METHODOLOGY:
This research methodology depends upon the amount or measurement of quality. It can be
present in the form of quantity. It describes resolves problems and infers using numbers. The
purpose of quantitative research methodology is to generate mathematical models and
theories. This research is made with the help of scientific techniques, which can involve:
Collection of experimental information and data
The development of theories, hypotheses and models
Modelling and evaluation of data
Analysis of results
The generation of methods and techniques for measurement
Handling of variables
Benefits of Quantitative research methodology
This methodology permits research to analyse and measure information or data
Quantitative research methodology is used to check hypotheses in application
Limitations of Quantitative research methodology
In Quantitative research methodology the reference of the experiment and study is
ignored
A large number of population must be learned for more actual results
Quantitative methodology is divided into 4 types:
Correlational
Descriptive
Experimental Research
Quasi-Experimental
8
⊘ This is a preview!⊘
Do you want full access?
Subscribe today to unlock all pages.
Trusted by 1+ million students worldwide
ANALYTICAL FINDINGS
DATASET:
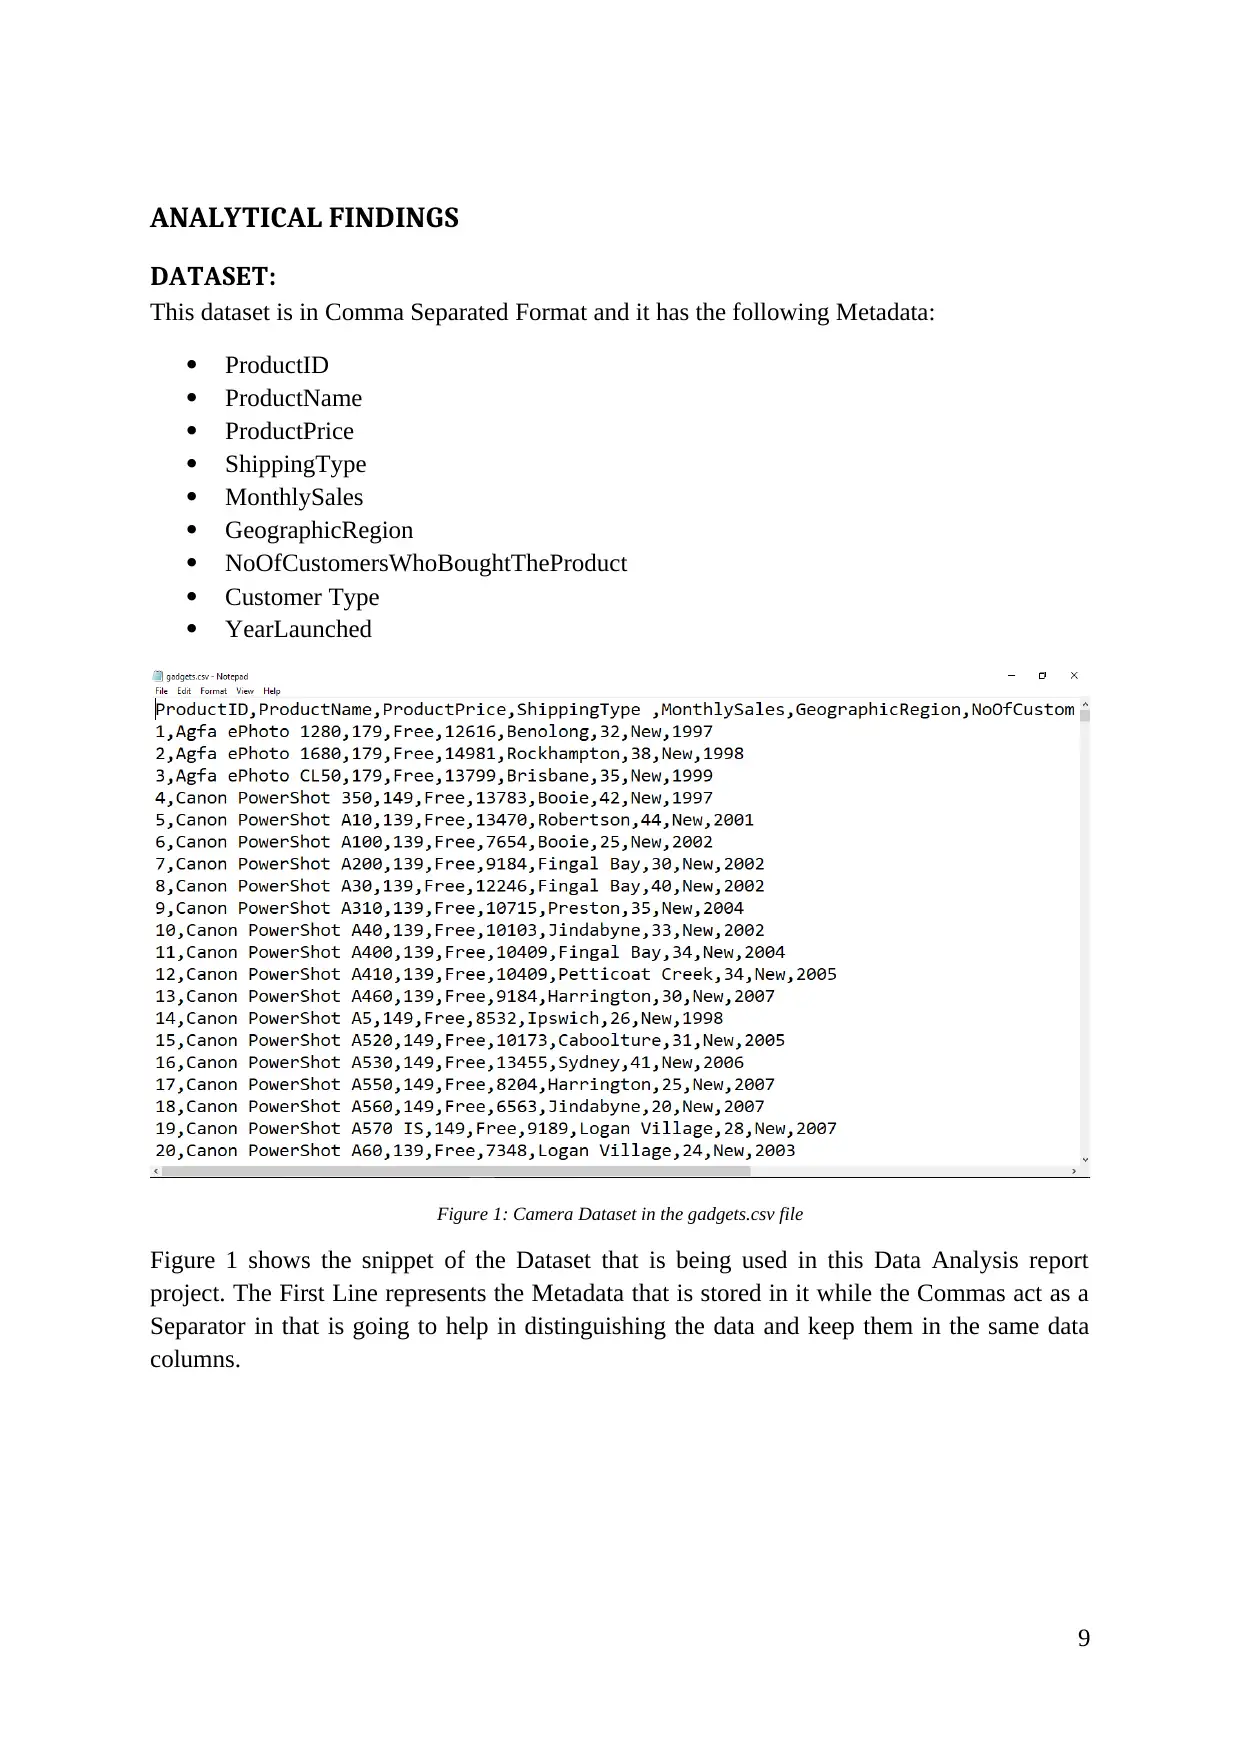
This dataset is in Comma Separated Format and it has the following Metadata:
ProductID
ProductName
ProductPrice
ShippingType
MonthlySales
GeographicRegion
NoOfCustomersWhoBoughtTheProduct
Customer Type
YearLaunched
Figure 1: Camera Dataset in the gadgets.csv file
Figure 1 shows the snippet of the Dataset that is being used in this Data Analysis report
project. The First Line represents the Metadata that is stored in it while the Commas act as a
Separator in that is going to help in distinguishing the data and keep them in the same data
columns.
9
DATASET:
This dataset is in Comma Separated Format and it has the following Metadata:
ProductID
ProductName
ProductPrice
ShippingType
MonthlySales
GeographicRegion
NoOfCustomersWhoBoughtTheProduct
Customer Type
YearLaunched
Figure 1: Camera Dataset in the gadgets.csv file
Figure 1 shows the snippet of the Dataset that is being used in this Data Analysis report
project. The First Line represents the Metadata that is stored in it while the Commas act as a
Separator in that is going to help in distinguishing the data and keep them in the same data
columns.
9
Paraphrase This Document
Need a fresh take? Get an instant paraphrase of this document with our AI Paraphraser
CLUSTERING AND DATA MINING:
Data Mining is a process which is used to extract the data from the large size of data. Data
mining is a process of minimizing information from data. Data mining is used in many
applications such as-
Production Control
Science Investigation
Market Analysis
Consumer Retainer
Fraud Detection
Applications of Data Mining
Market Evaluation and Management
Fraud Detection’
Risk Analysis and Management
Market Evaluation and Management:
Consumer profiling- it helps to identify what type of people purchase what type of
item.
Identify consumer buying pattern- it helps in determining consumers buying pattern.
Determining consumer requirements- it helps in determining the best item for
different consumers.
Target marketing- it helps to search cluster model of consumer who uses the similar
characteristics like income, interest.
Risk analysis and management:
Competition- it includes market directions and monitoring competitors.
Resource planning- it includes comparing and summarizing the resources.
Cluster analysis is task of collecting a set of items in such a style that item in the same style is
more relevant to one another those in another style. Clustering is also known as an
unsupervised learning process (Tutorialspoint 2018). Clustering contains 2 types of
algorithms:
1. Hierarchical- hierarchical clustering is a process of cluster evaluation which asks to
make a hierarchy of clusters. Hierarchical clustering use two types of strategies:
Divisive- divisive is a top-down method. In divisive examination starts in one
cluster and separation are achieved recursively.
Agglomerative- agglomerative is a down bottom-up method. Every
examination starts in its personal cluster and group of clusters are combined.
2. Non-hierarchical- non-hierarchical clusters search a collection of things which
minimizes evaluation criterion.
In non-hierarchical clustering algorithm connection within clusters is undeterminable.
10
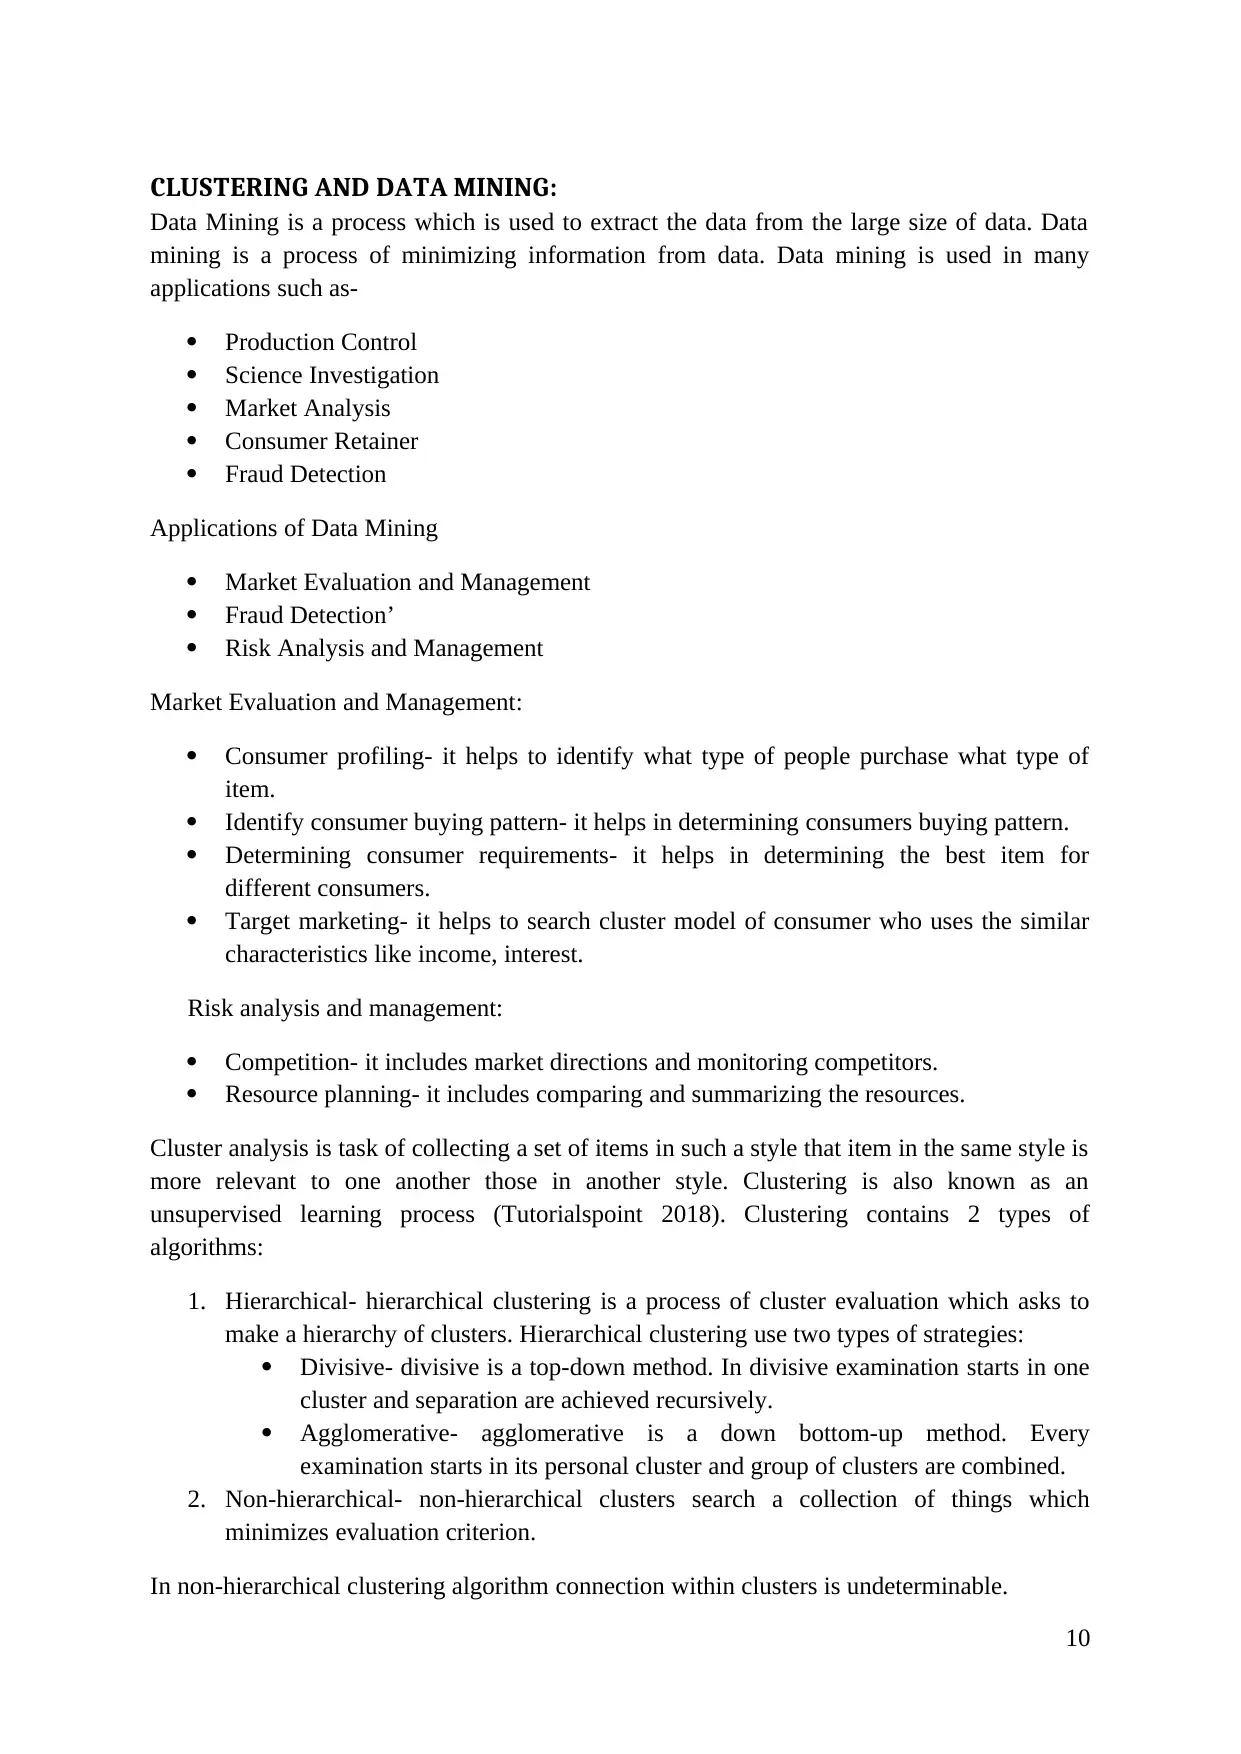
MONTHLY SALES PREDICTION
Naïve Bayes is a simple machine learning algorithm which is used for clustering. Naïve
Bayes clustering classifier is used for multi-class and binary class classification problems. It
is known as naïve Bayes because the computation of possibility for every hypothesis is
clarified to make their computation tractable (Towards Data Science, 2018). Naïve bays
clustering classifier is a group of division algorithms depends upon Bayes theorem. Naïve
Bayes is depended upon probability models that unified strong freedom assumptions.
DATA ANALYSIS
Figure 2: Data Analysis
Figure 2 shows some Histograms that represents this data in order to create predictions over
this data.
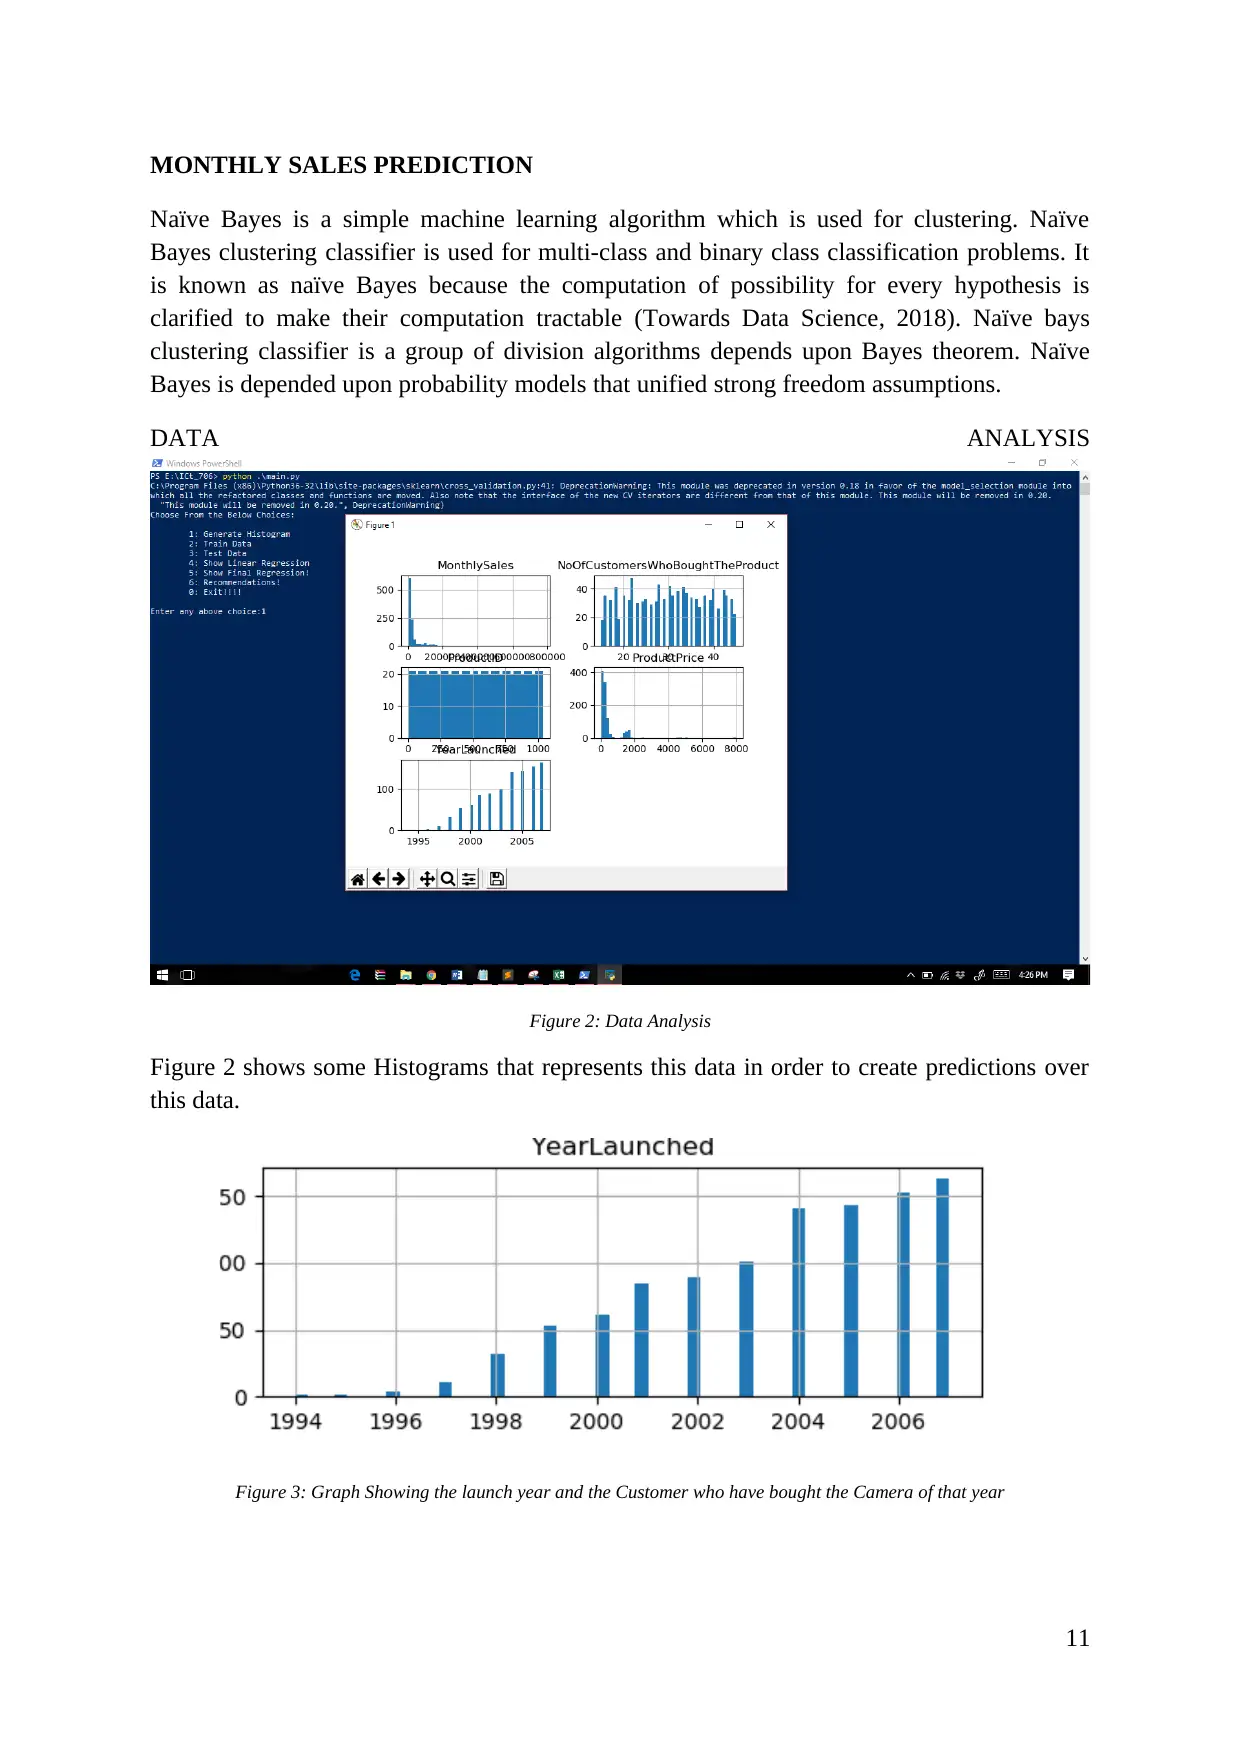
Figure 3: Graph Showing the launch year and the Customer who have bought the Camera of that year
11
Naïve Bayes is a simple machine learning algorithm which is used for clustering. Naïve
Bayes clustering classifier is used for multi-class and binary class classification problems. It
is known as naïve Bayes because the computation of possibility for every hypothesis is
clarified to make their computation tractable (Towards Data Science, 2018). Naïve bays
clustering classifier is a group of division algorithms depends upon Bayes theorem. Naïve
Bayes is depended upon probability models that unified strong freedom assumptions.
DATA ANALYSIS
Figure 2: Data Analysis
Figure 2 shows some Histograms that represents this data in order to create predictions over
this data.
Figure 3: Graph Showing the launch year and the Customer who have bought the Camera of that year
11
⊘ This is a preview!⊘
Do you want full access?
Subscribe today to unlock all pages.
Trusted by 1+ million students worldwide
1 out of 25
Related Documents


Your All-in-One AI-Powered Toolkit for Academic Success.
+13062052269
info@desklib.com
Available 24*7 on WhatsApp / Email
![[object Object]](/_next/static/media/star-bottom.7253800d.svg)
Unlock your academic potential
Copyright © 2020–2026 A2Z Services. All Rights Reserved. Developed and managed by ZUCOL.