Detailed Analysis: Real GDP, CPI Trends in Canada & Russia (2009-2019)
VerifiedAdded on 2022/08/20
|10
|1035
|20
Report
AI Summary
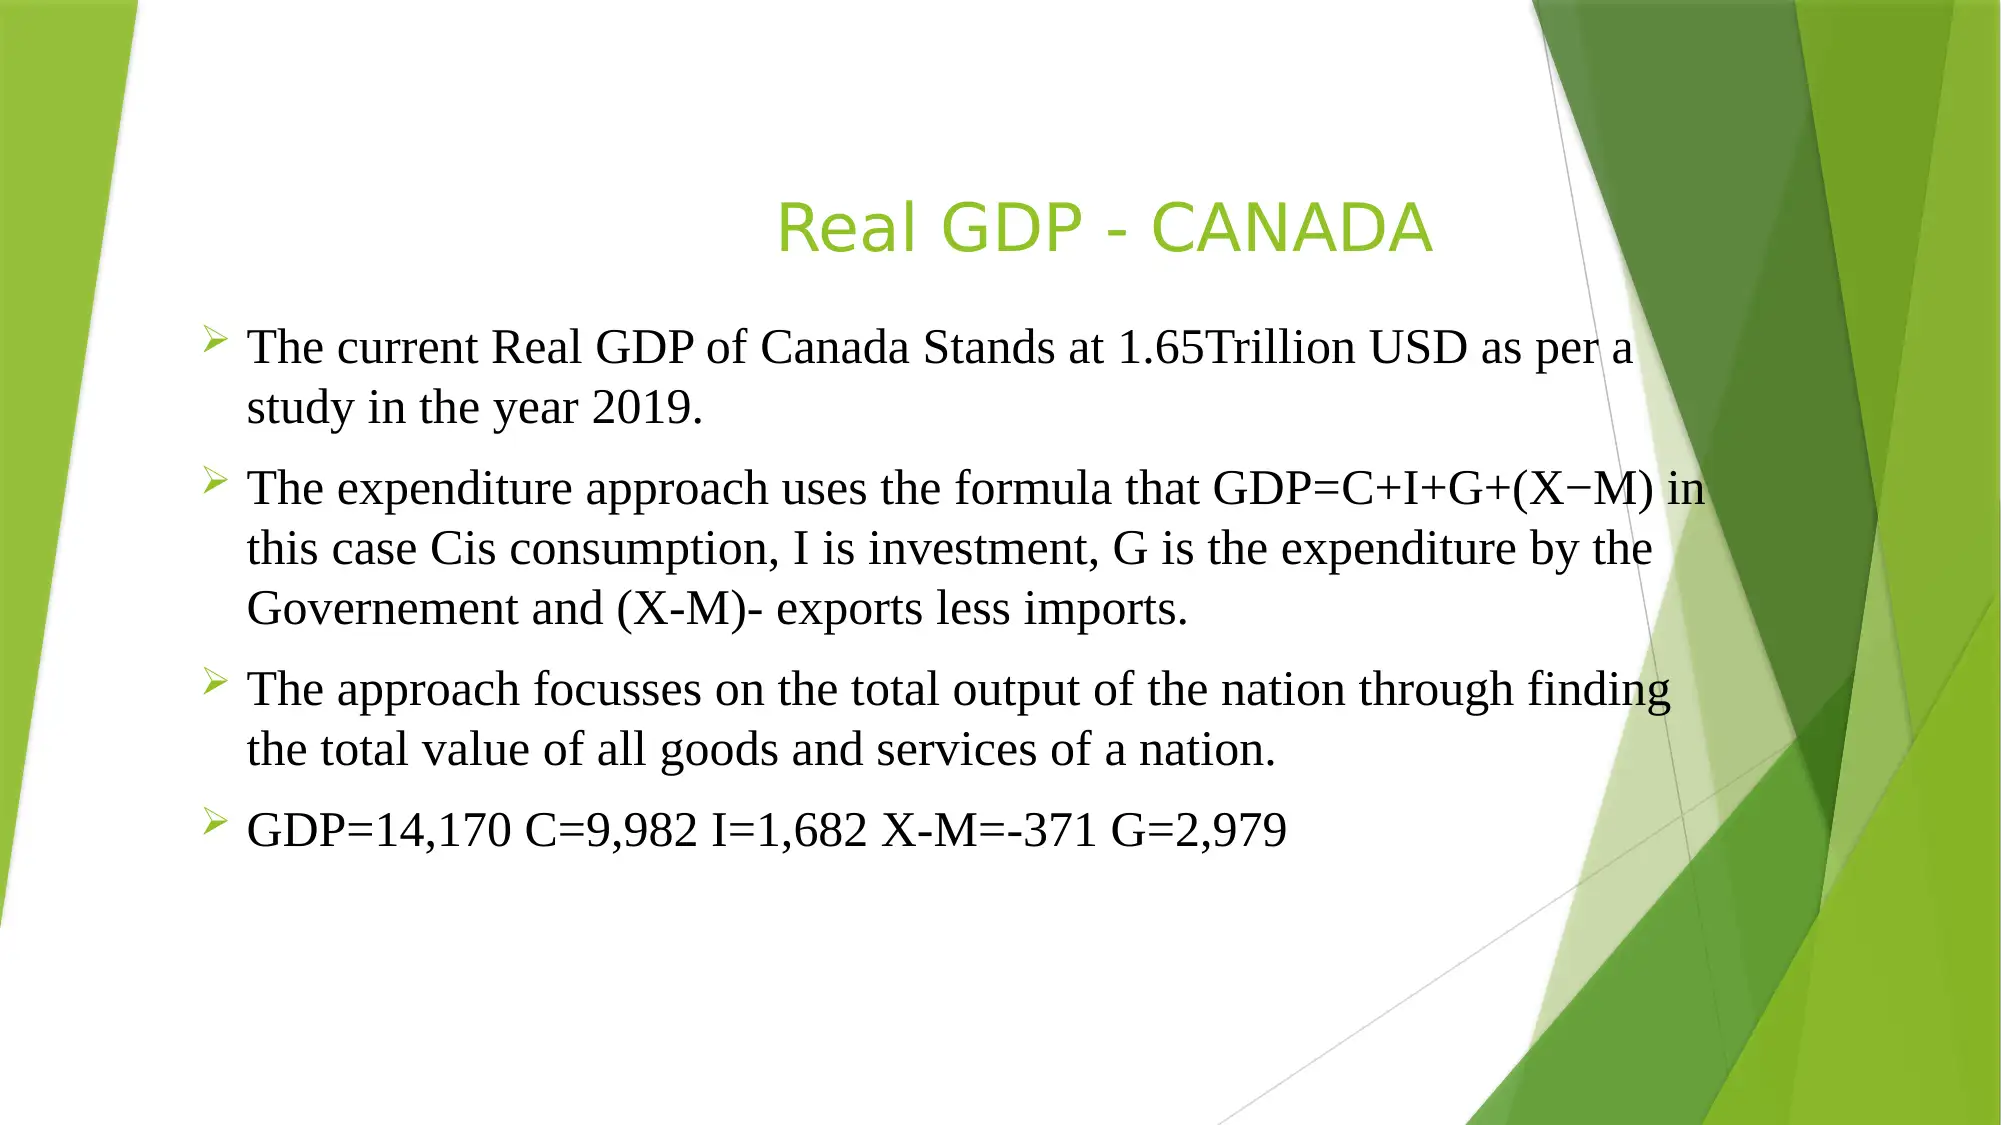
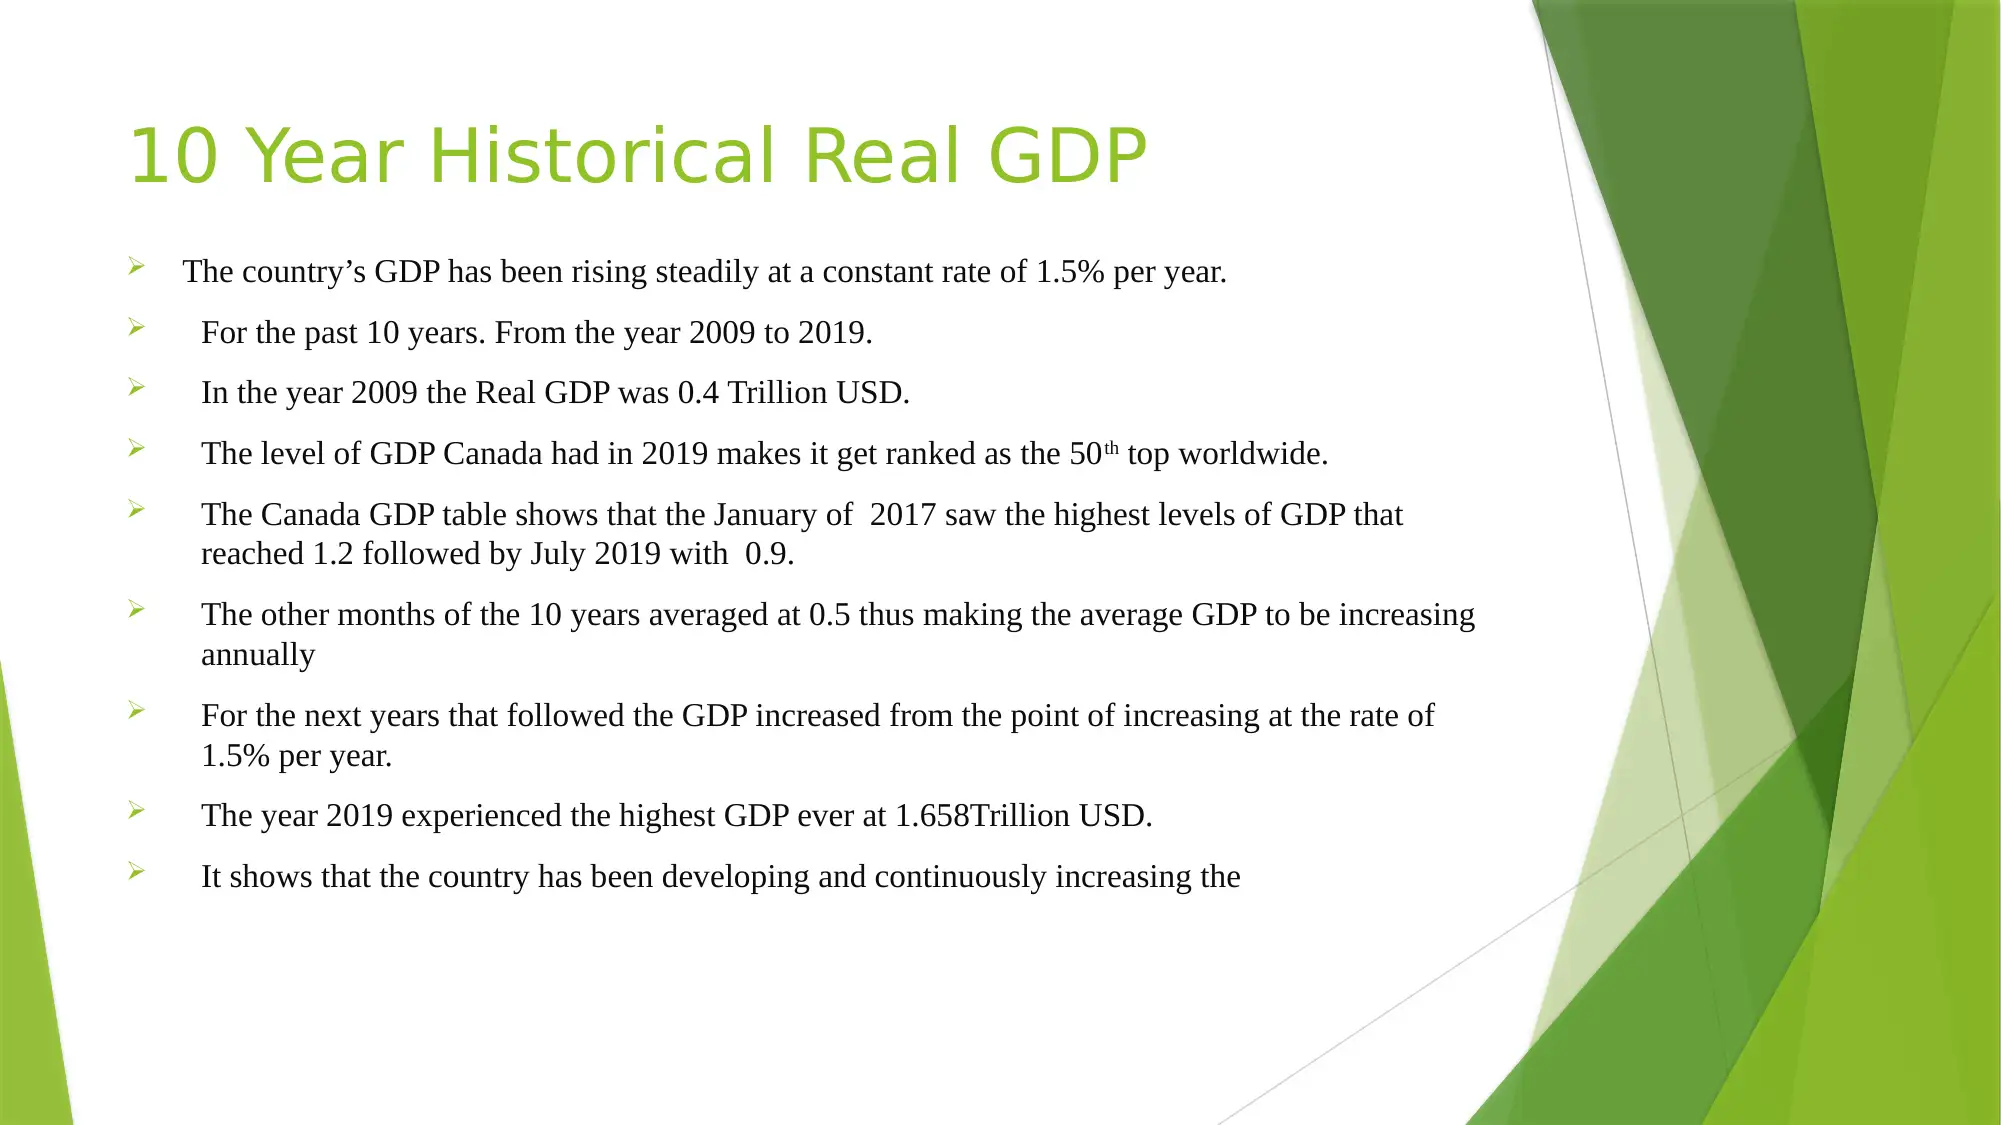
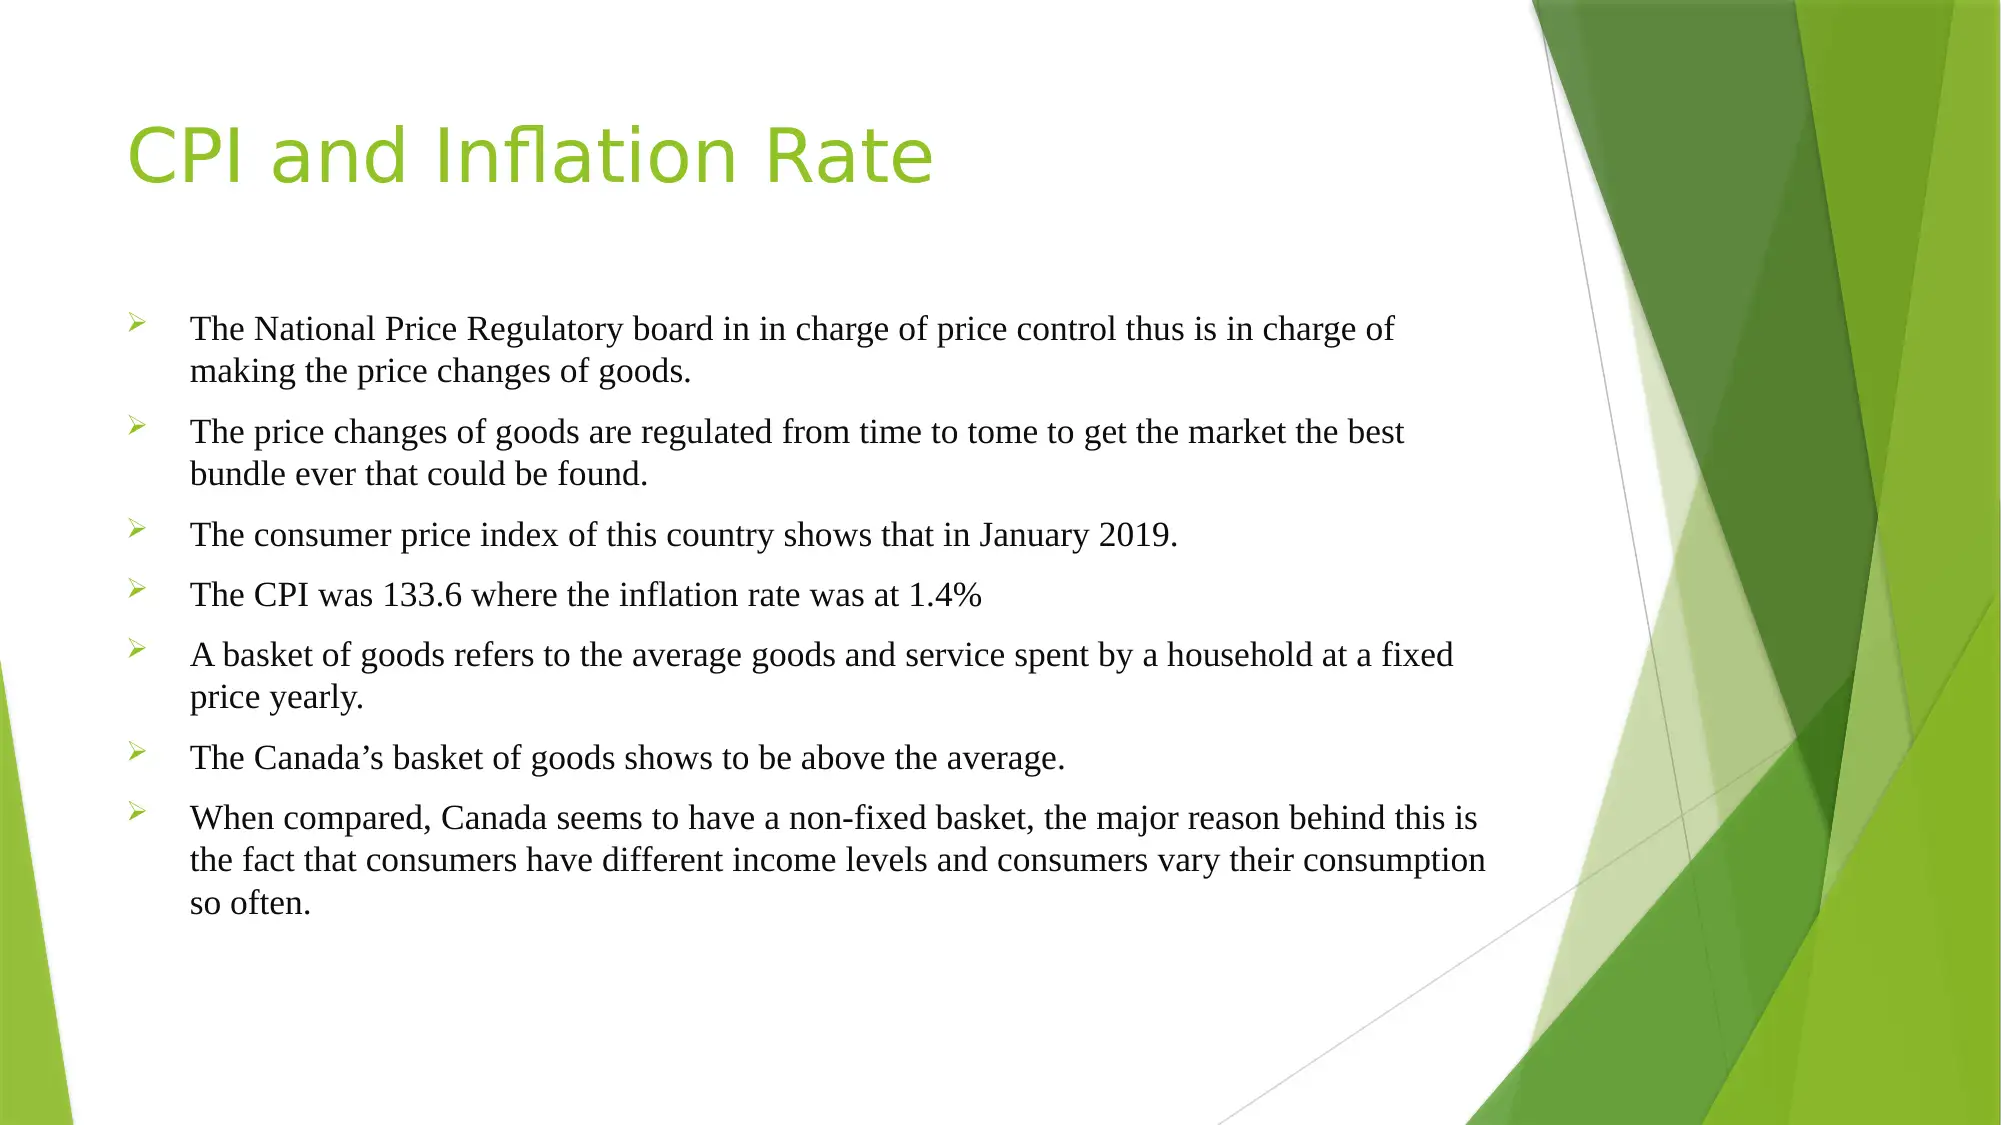
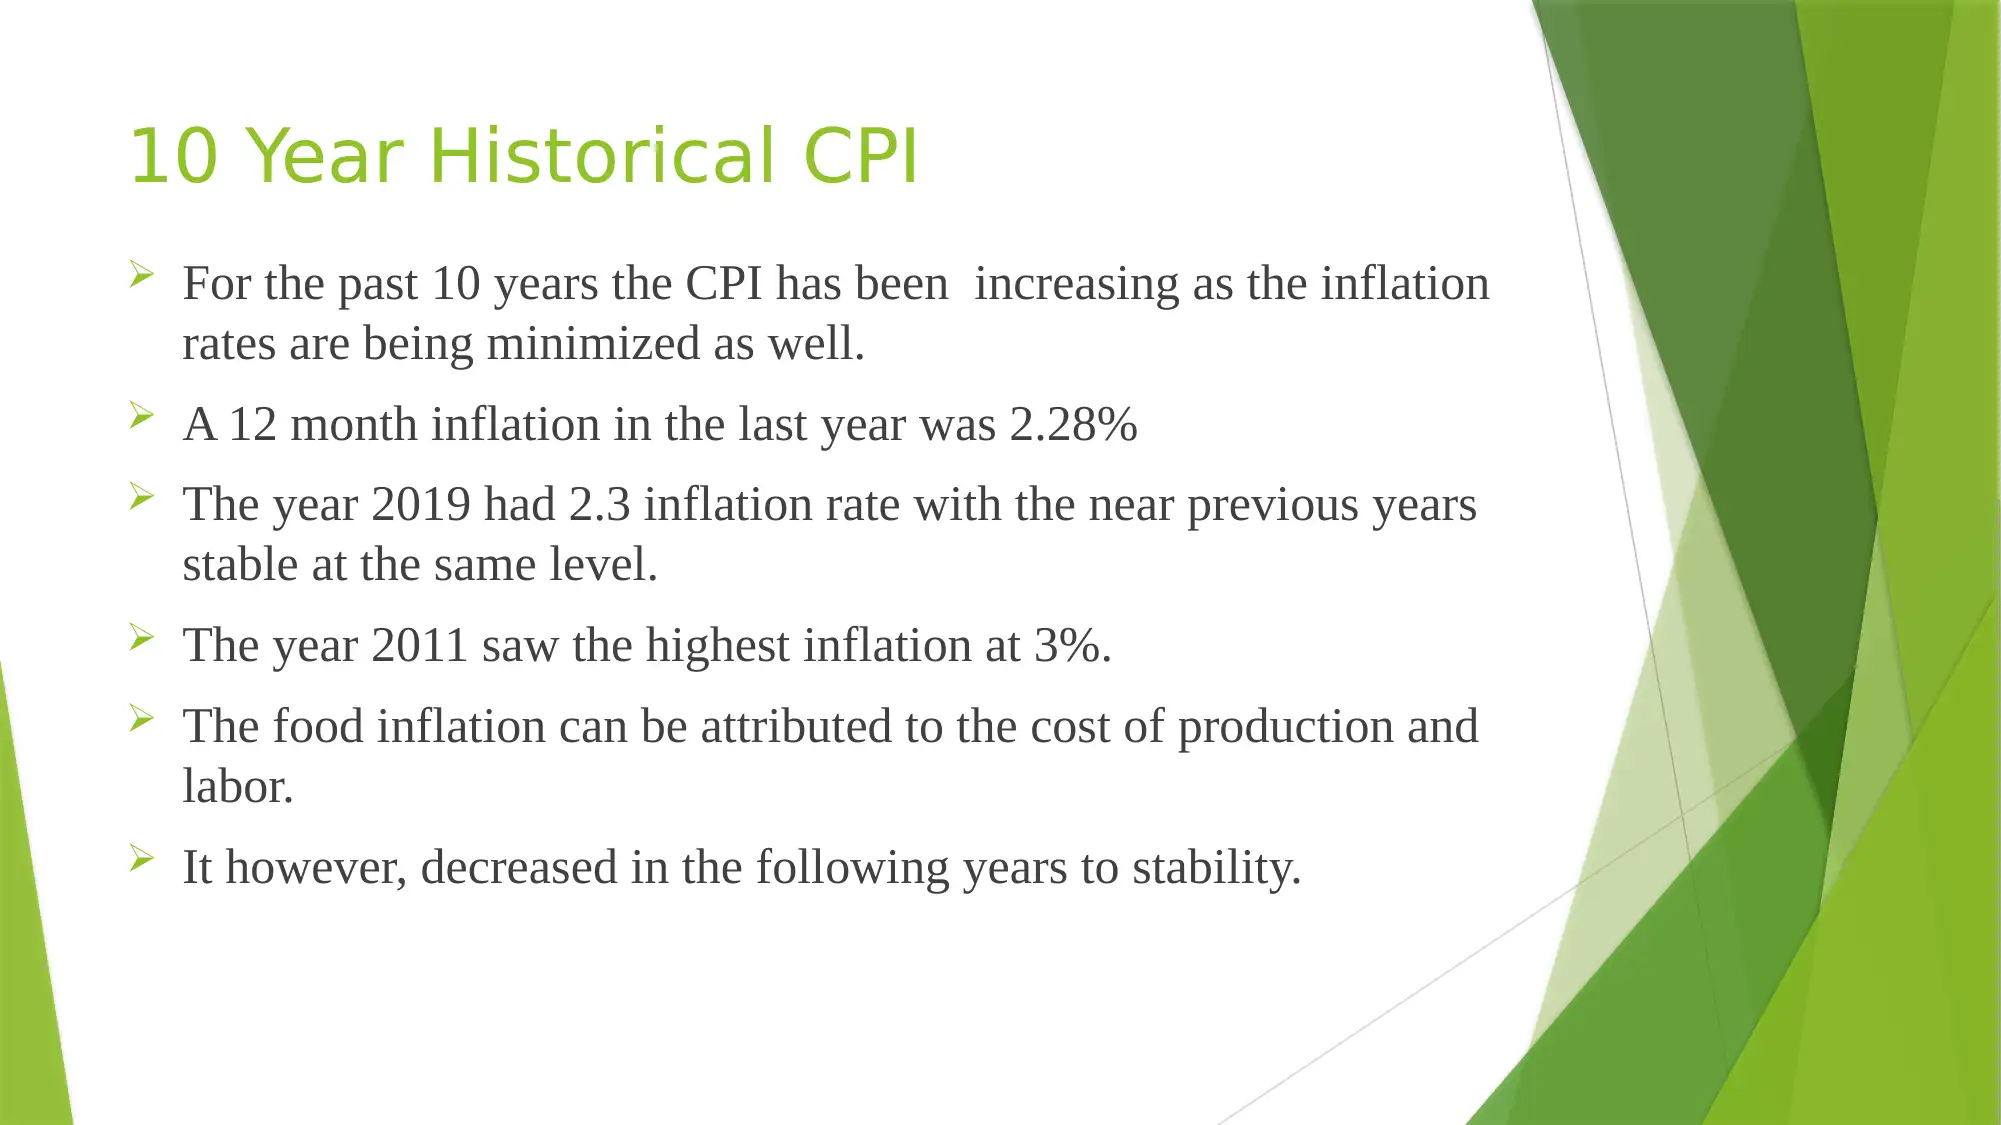
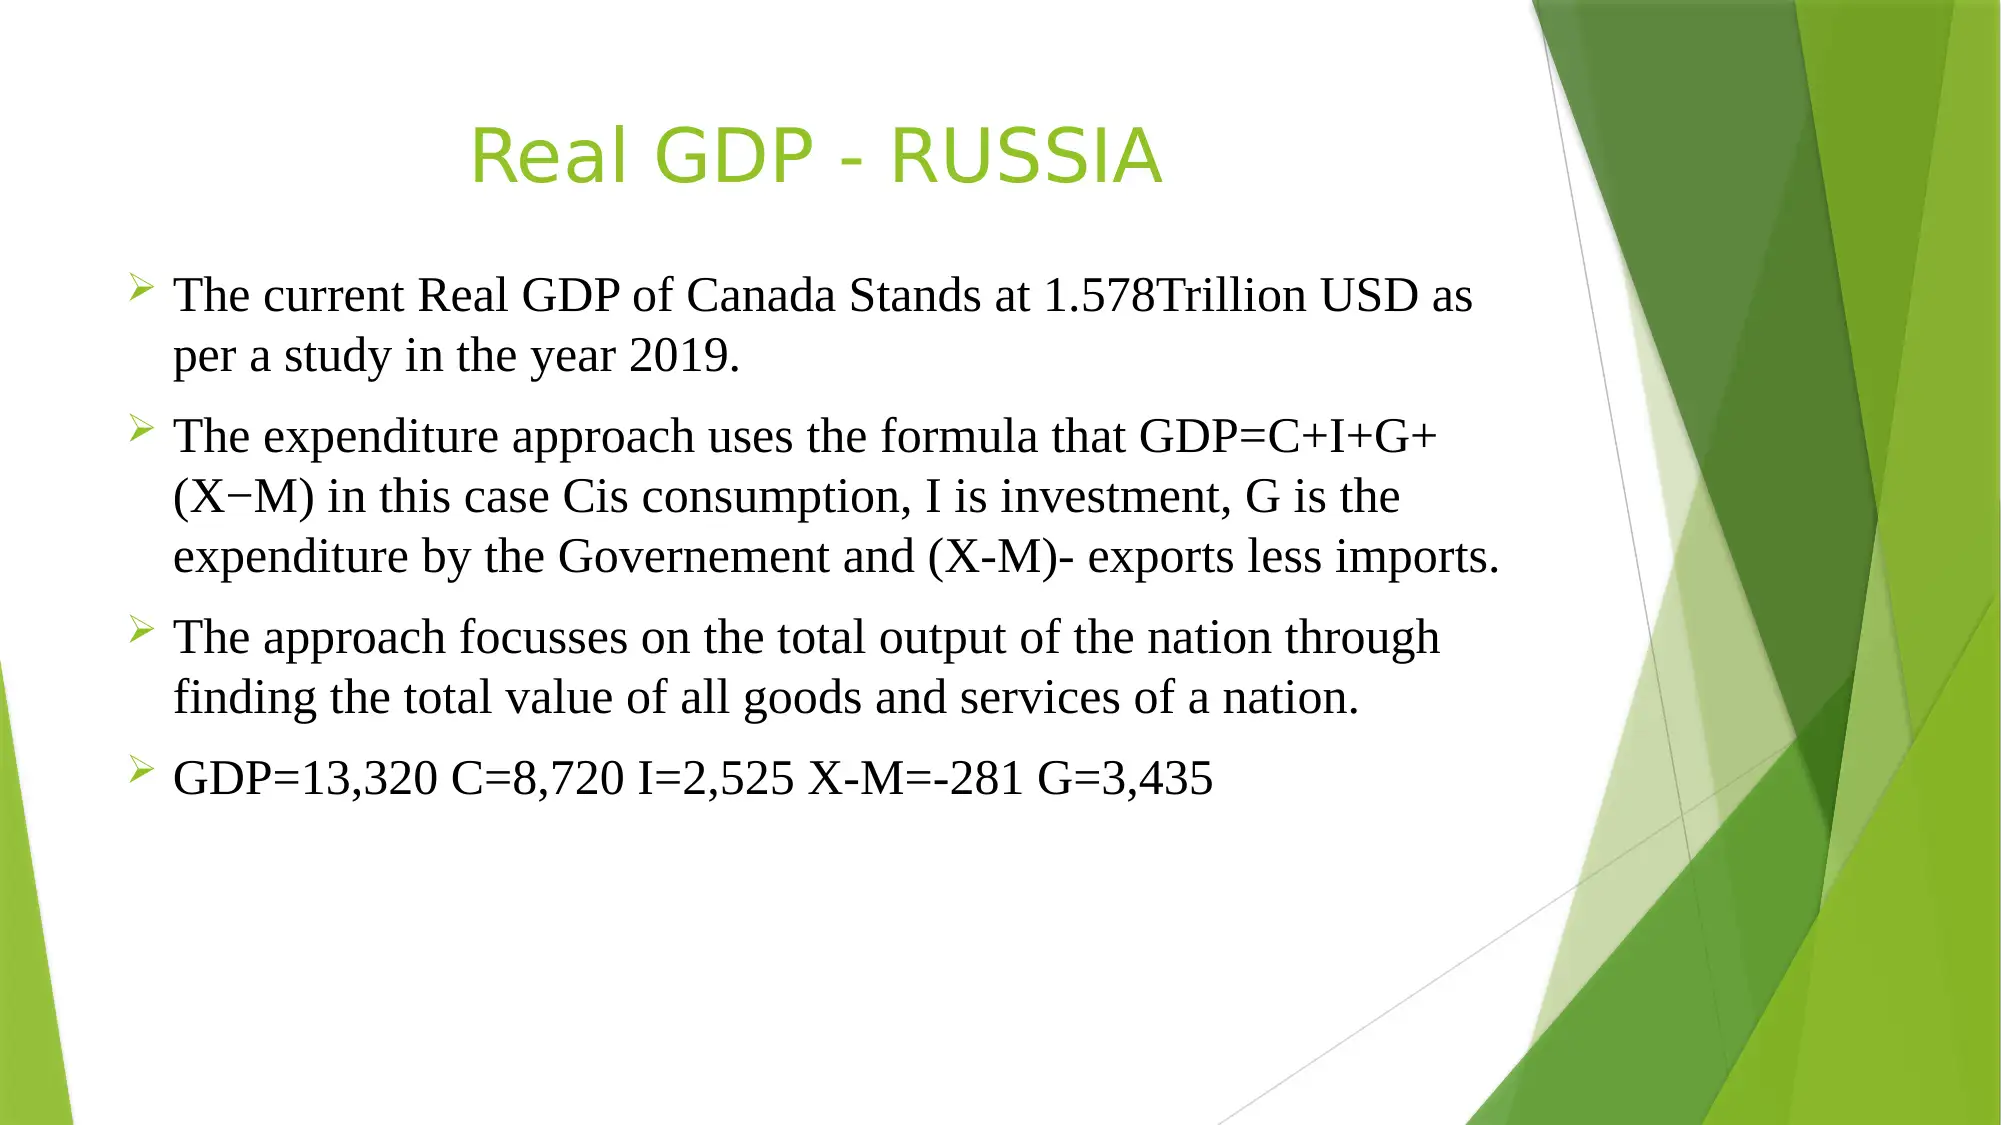
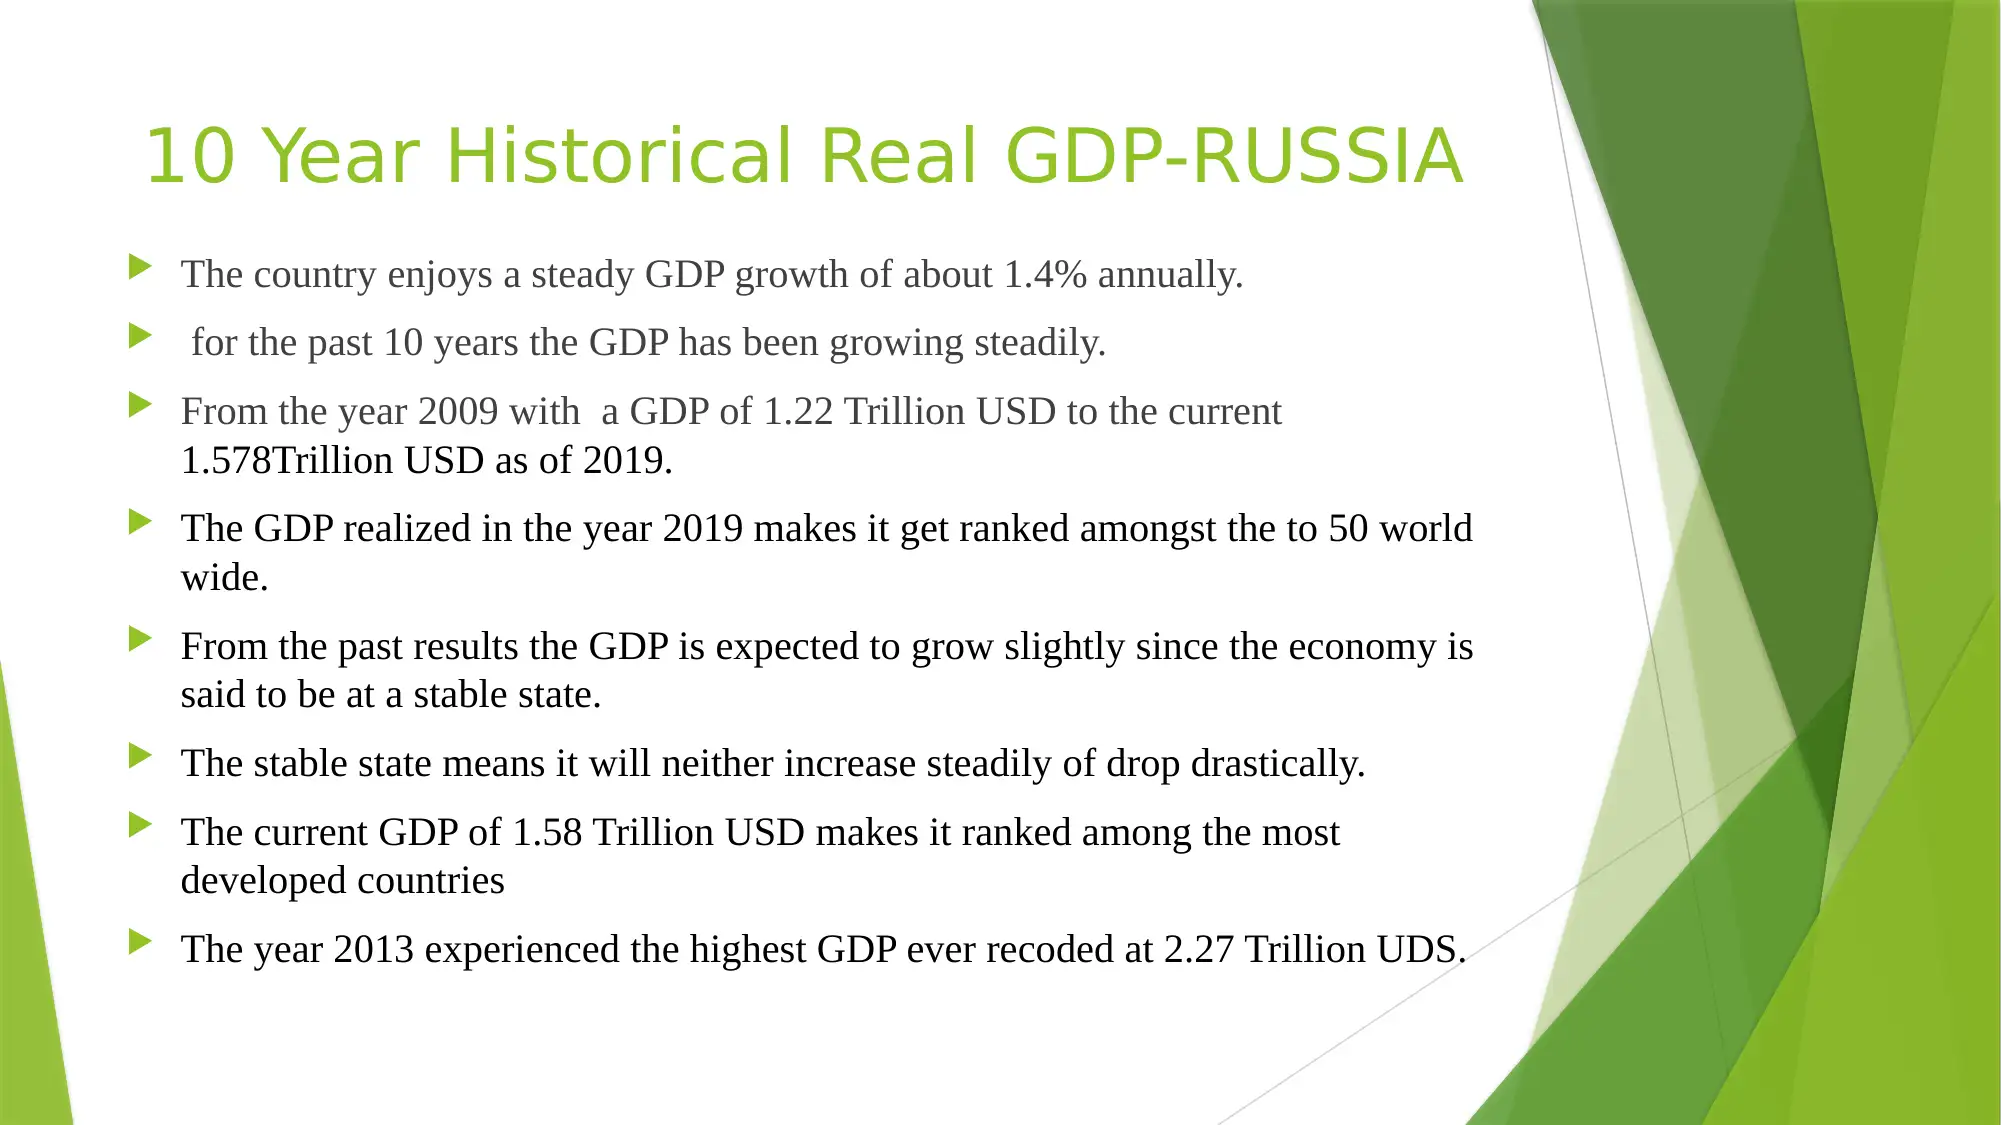
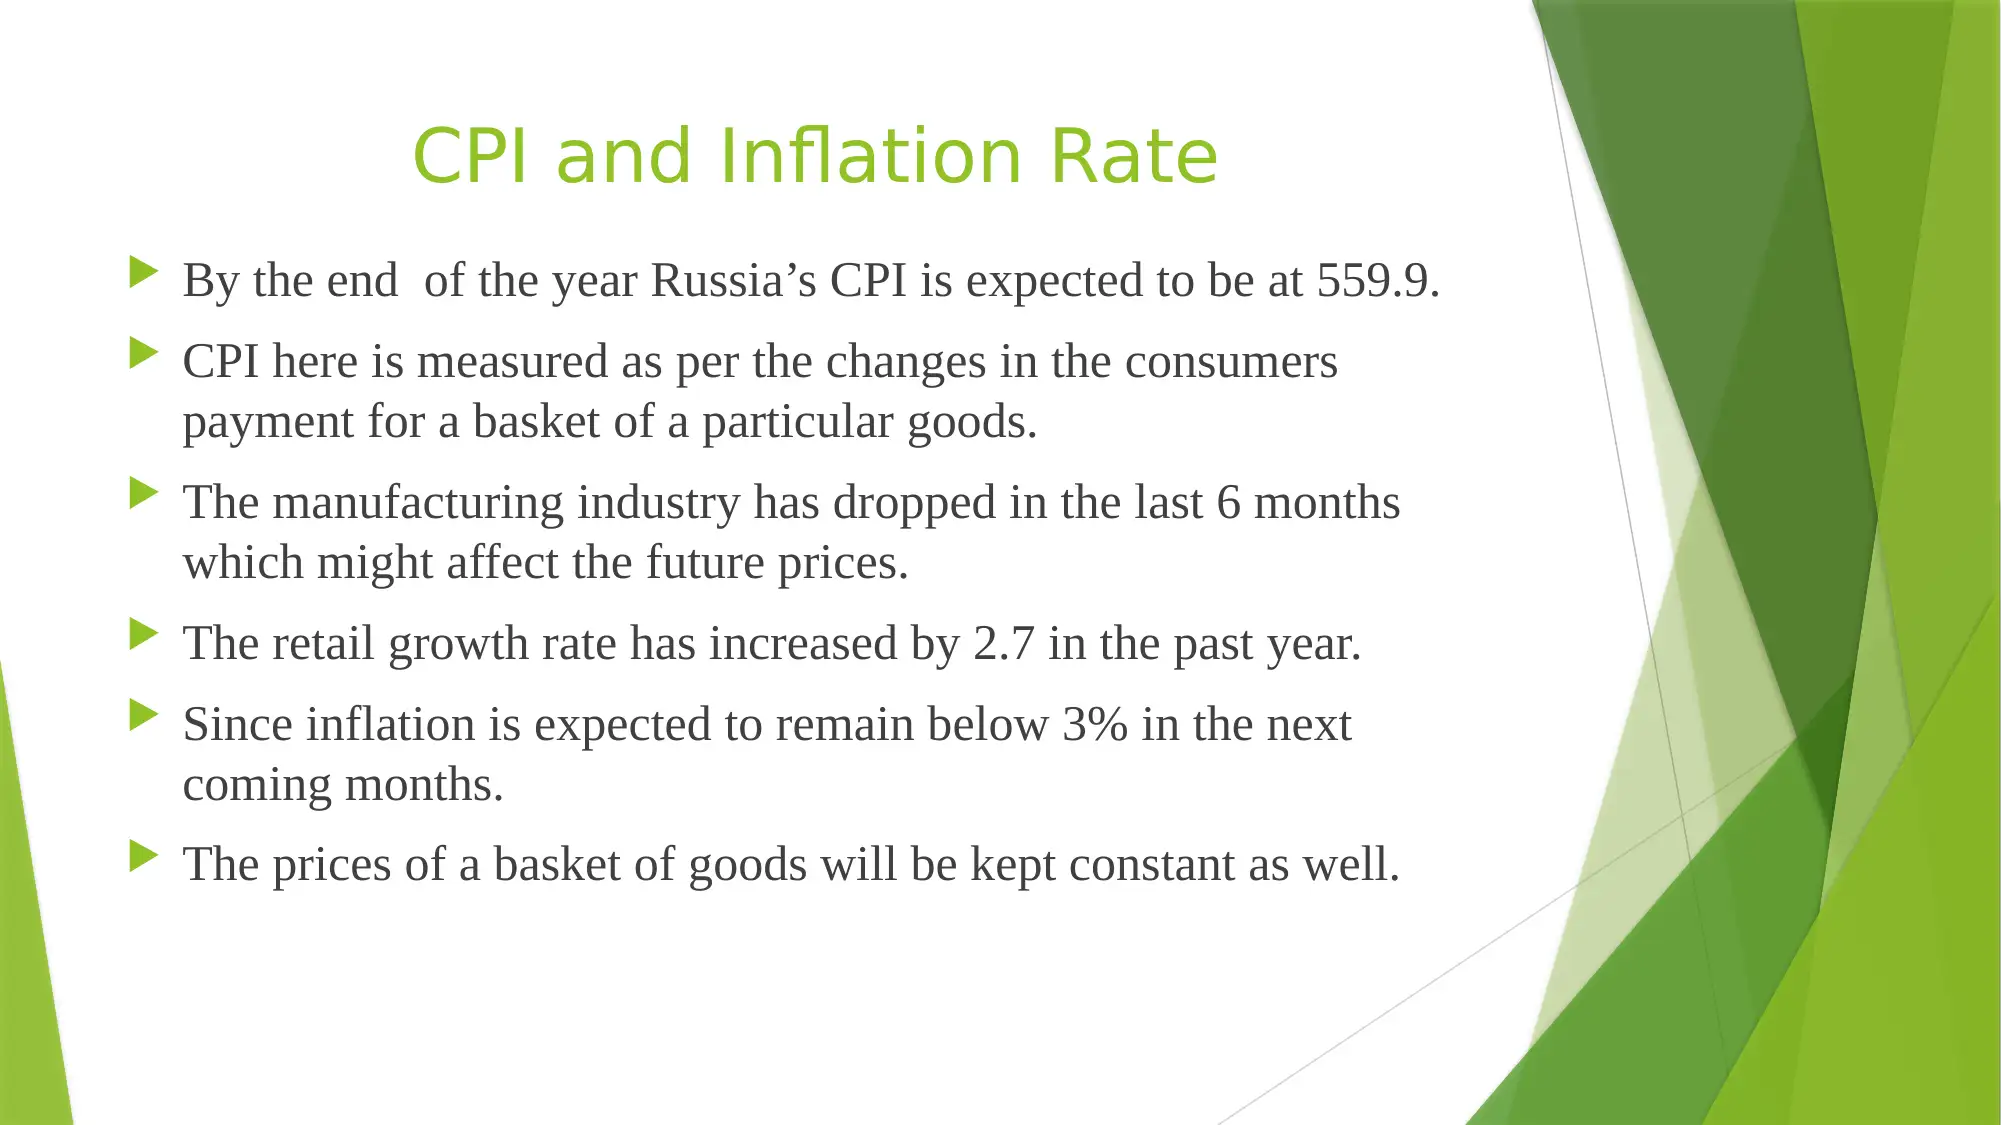
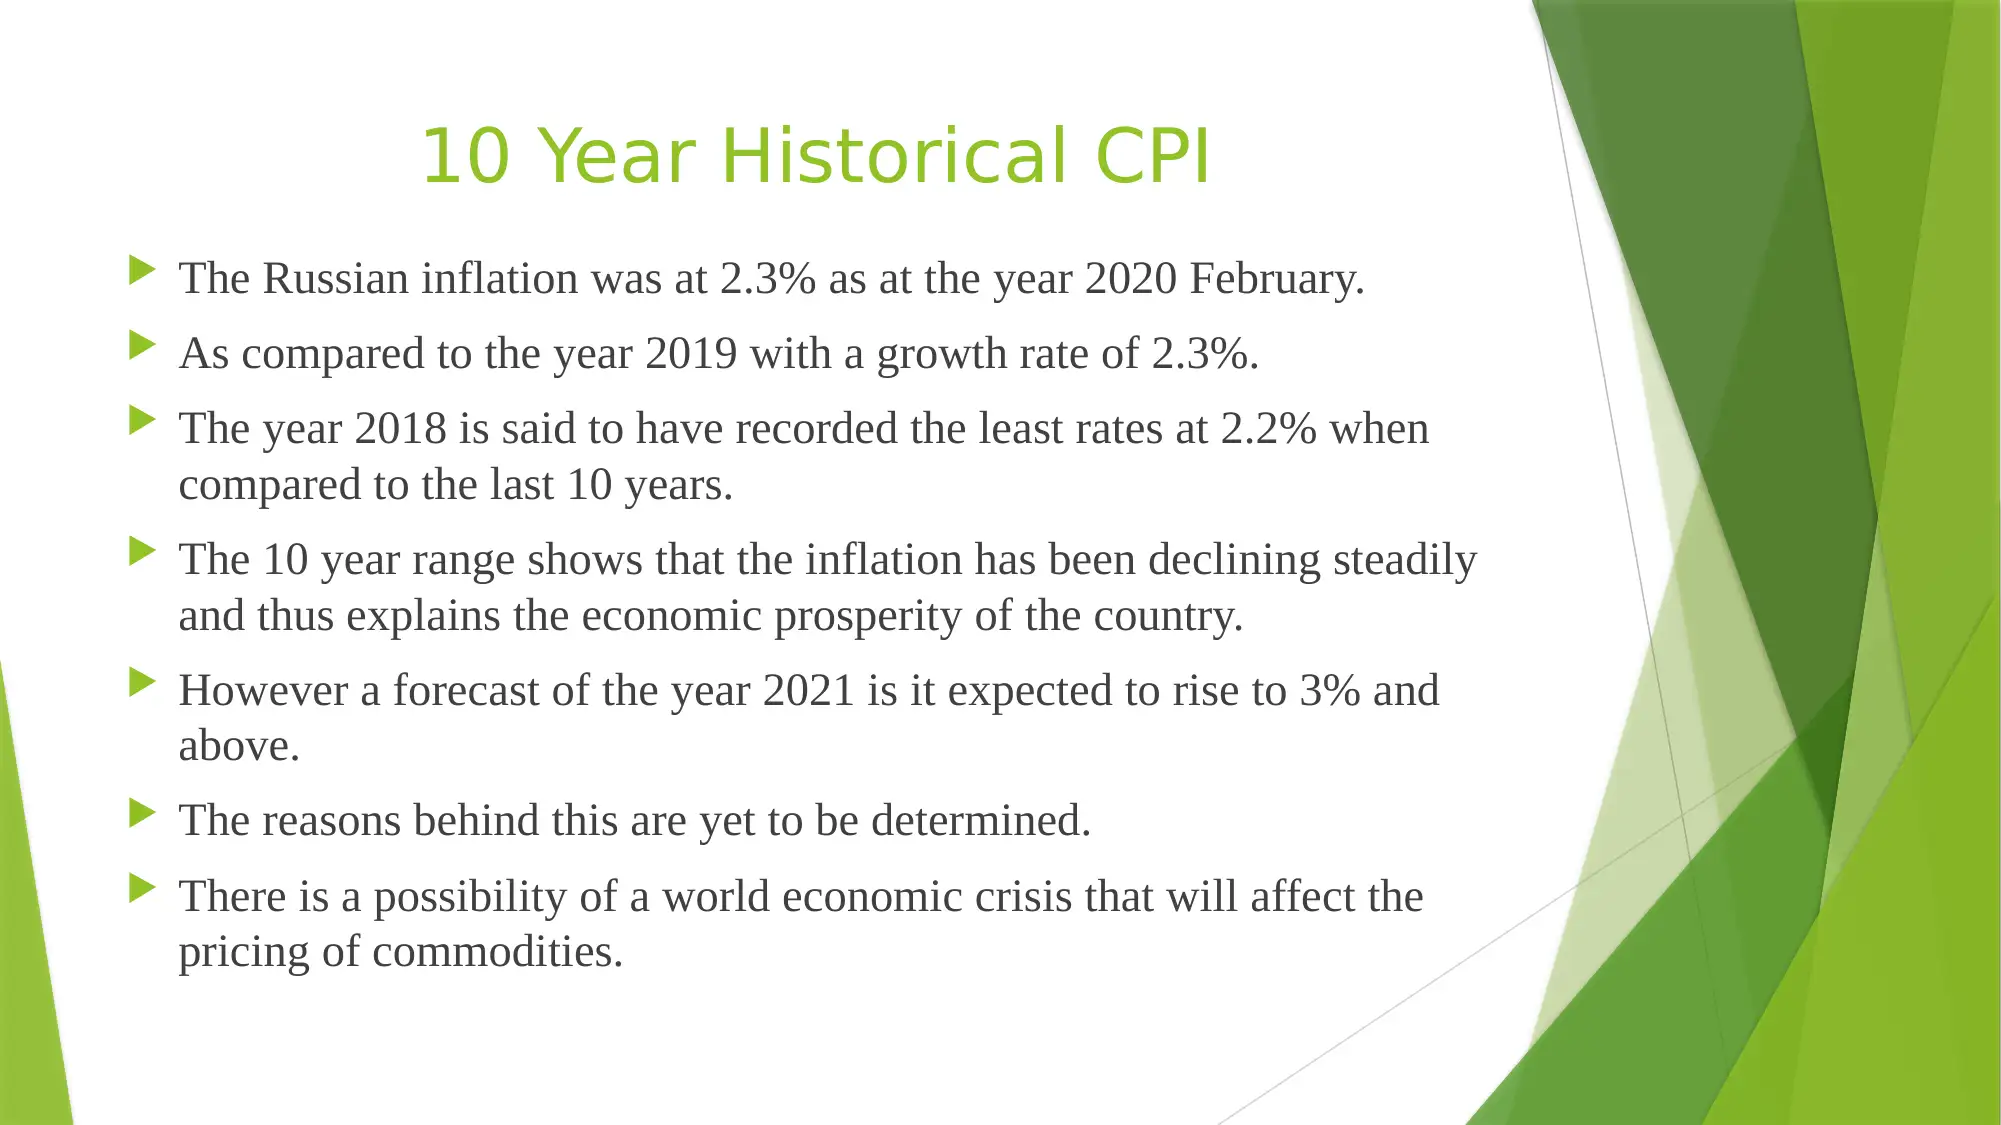
This report provides a comparative analysis of the Real GDP of Canada and Russia, focusing on the period between 2009 and 2019. It uses the expenditure approach (GDP = C + I + G + (X-M)) to assess the GDP of both countries, detailing consumption, investment, government expenditure, and net exports. The report highlights the historical GDP trends, CPI, and inflation rates for both nations, noting Canada's steady GDP growth of 1.5% per year and Russia's stable economic state with a similar growth rate. The analysis also covers the Consumer Price Index (CPI) and inflation rates, examining the factors influencing price changes and the composition of the basket of goods in each country. References to relevant academic sources are included to support the analysis. Desklib provides access to this report and other solved assignments for students.

Real GDP
Student’s Name
Institutional Affiliation
Professor
Course
Date
Student’s Name
Institutional Affiliation
Professor
Course
Date
Paraphrase This Document
Need a fresh take? Get an instant paraphrase of this document with our AI Paraphraser

Real GDP - CANADA
The current Real GDP of Canada Stands at 1.65Trillion USD as per a
study in the year 2019.
The expenditure approach uses the formula that GDP=C+I+G+(X−M) in
this case Cis consumption, I is investment, G is the expenditure by the
Governement and (X-M)- exports less imports.
The approach focusses on the total output of the nation through finding
the total value of all goods and services of a nation.
GDP=14,170 C=9,982 I=1,682 X-M=-371 G=2,979

10 Year Historical Real GDP
The country’s GDP has been rising steadily at a constant rate of 1.5% per year.
For the past 10 years. From the year 2009 to 2019.
In the year 2009 the Real GDP was 0.4 Trillion USD.
The level of GDP Canada had in 2019 makes it get ranked as the 50th top worldwide.
The Canada GDP table shows that the January of 2017 saw the highest levels of GDP that
reached 1.2 followed by July 2019 with 0.9.
The other months of the 10 years averaged at 0.5 thus making the average GDP to be increasing
annually
For the next years that followed the GDP increased from the point of increasing at the rate of
1.5% per year.
The year 2019 experienced the highest GDP ever at 1.658Trillion USD.
It shows that the country has been developing and continuously increasing the
⊘ This is a preview!⊘
Do you want full access?
Subscribe today to unlock all pages.

Trusted by 1+ million students worldwide

CPI and Inflation Rate
The National Price Regulatory board in in charge of price control thus is in charge of
making the price changes of goods.
The price changes of goods are regulated from time to tome to get the market the best
bundle ever that could be found.
The consumer price index of this country shows that in January 2019.
The CPI was 133.6 where the inflation rate was at 1.4%
A basket of goods refers to the average goods and service spent by a household at a fixed
price yearly.
The Canada’s basket of goods shows to be above the average.
When compared, Canada seems to have a non-fixed basket, the major reason behind this is
the fact that consumers have different income levels and consumers vary their consumption
so often.
Paraphrase This Document
Need a fresh take? Get an instant paraphrase of this document with our AI Paraphraser

10 Year Historical CPI
For the past 10 years the CPI has been increasing as the inflation
rates are being minimized as well.
A 12 month inflation in the last year was 2.28%
The year 2019 had 2.3 inflation rate with the near previous years
stable at the same level.
The year 2011 saw the highest inflation at 3%.
The food inflation can be attributed to the cost of production and
labor.
It however, decreased in the following years to stability.

Real GDP - RUSSIA
The current Real GDP of Canada Stands at 1.578Trillion USD as
per a study in the year 2019.
The expenditure approach uses the formula that GDP=C+I+G+
(X−M) in this case Cis consumption, I is investment, G is the
expenditure by the Governement and (X-M)- exports less imports.
The approach focusses on the total output of the nation through
finding the total value of all goods and services of a nation.
GDP=13,320 C=8,720 I=2,525 X-M=-281 G=3,435
⊘ This is a preview!⊘
Do you want full access?
Subscribe today to unlock all pages.

Trusted by 1+ million students worldwide

10 Year Historical Real GDP-RUSSIA
The country enjoys a steady GDP growth of about 1.4% annually.
for the past 10 years the GDP has been growing steadily.
From the year 2009 with a GDP of 1.22 Trillion USD to the current
1.578Trillion USD as of 2019.
The GDP realized in the year 2019 makes it get ranked amongst the to 50 world
wide.
From the past results the GDP is expected to grow slightly since the economy is
said to be at a stable state.
The stable state means it will neither increase steadily of drop drastically.
The current GDP of 1.58 Trillion USD makes it ranked among the most
developed countries
The year 2013 experienced the highest GDP ever recoded at 2.27 Trillion UDS.
Paraphrase This Document
Need a fresh take? Get an instant paraphrase of this document with our AI Paraphraser

CPI and Inflation Rate
By the end of the year Russia’s CPI is expected to be at 559.9.
CPI here is measured as per the changes in the consumers
payment for a basket of a particular goods.
The manufacturing industry has dropped in the last 6 months
which might affect the future prices.
The retail growth rate has increased by 2.7 in the past year.
Since inflation is expected to remain below 3% in the next
coming months.
The prices of a basket of goods will be kept constant as well.

10 Year Historical CPI
The Russian inflation was at 2.3% as at the year 2020 February.
As compared to the year 2019 with a growth rate of 2.3%.
The year 2018 is said to have recorded the least rates at 2.2% when
compared to the last 10 years.
The 10 year range shows that the inflation has been declining steadily
and thus explains the economic prosperity of the country.
However a forecast of the year 2021 is it expected to rise to 3% and
above.
The reasons behind this are yet to be determined.
There is a possibility of a world economic crisis that will affect the
pricing of commodities.
⊘ This is a preview!⊘
Do you want full access?
Subscribe today to unlock all pages.

Trusted by 1+ million students worldwide

References
Bataille, C., & Melton, N. (2017). Energy efficiency and
economic growth: A retrospective CGE analysis for Canada from
2002 to 2012. Energy Economics, 64, 118-130.
Geloso, V. (2019). A price index for Canada, 1688 to
1850. Canadian Journal of Economics/Revue canadienne
d'économique, 52(2), 526-560.
Tweddle, A., Battle, K., & Torjman, S. (2016). Welfare in Canada
2012. Ottawa: Caledon Institute of Social Policy.
1 out of 10
Related Documents

Your All-in-One AI-Powered Toolkit for Academic Success.
+13062052269
info@desklib.com
Available 24*7 on WhatsApp / Email
Unlock your academic potential
Copyright © 2020–2025 A2Z Services. All Rights Reserved. Developed and managed by ZUCOL.