Impact of CSR on Financial Performance: Canadian Banks Analysis
VerifiedAdded on  2020/10/22
|26
|3132
|425
Report
AI Summary
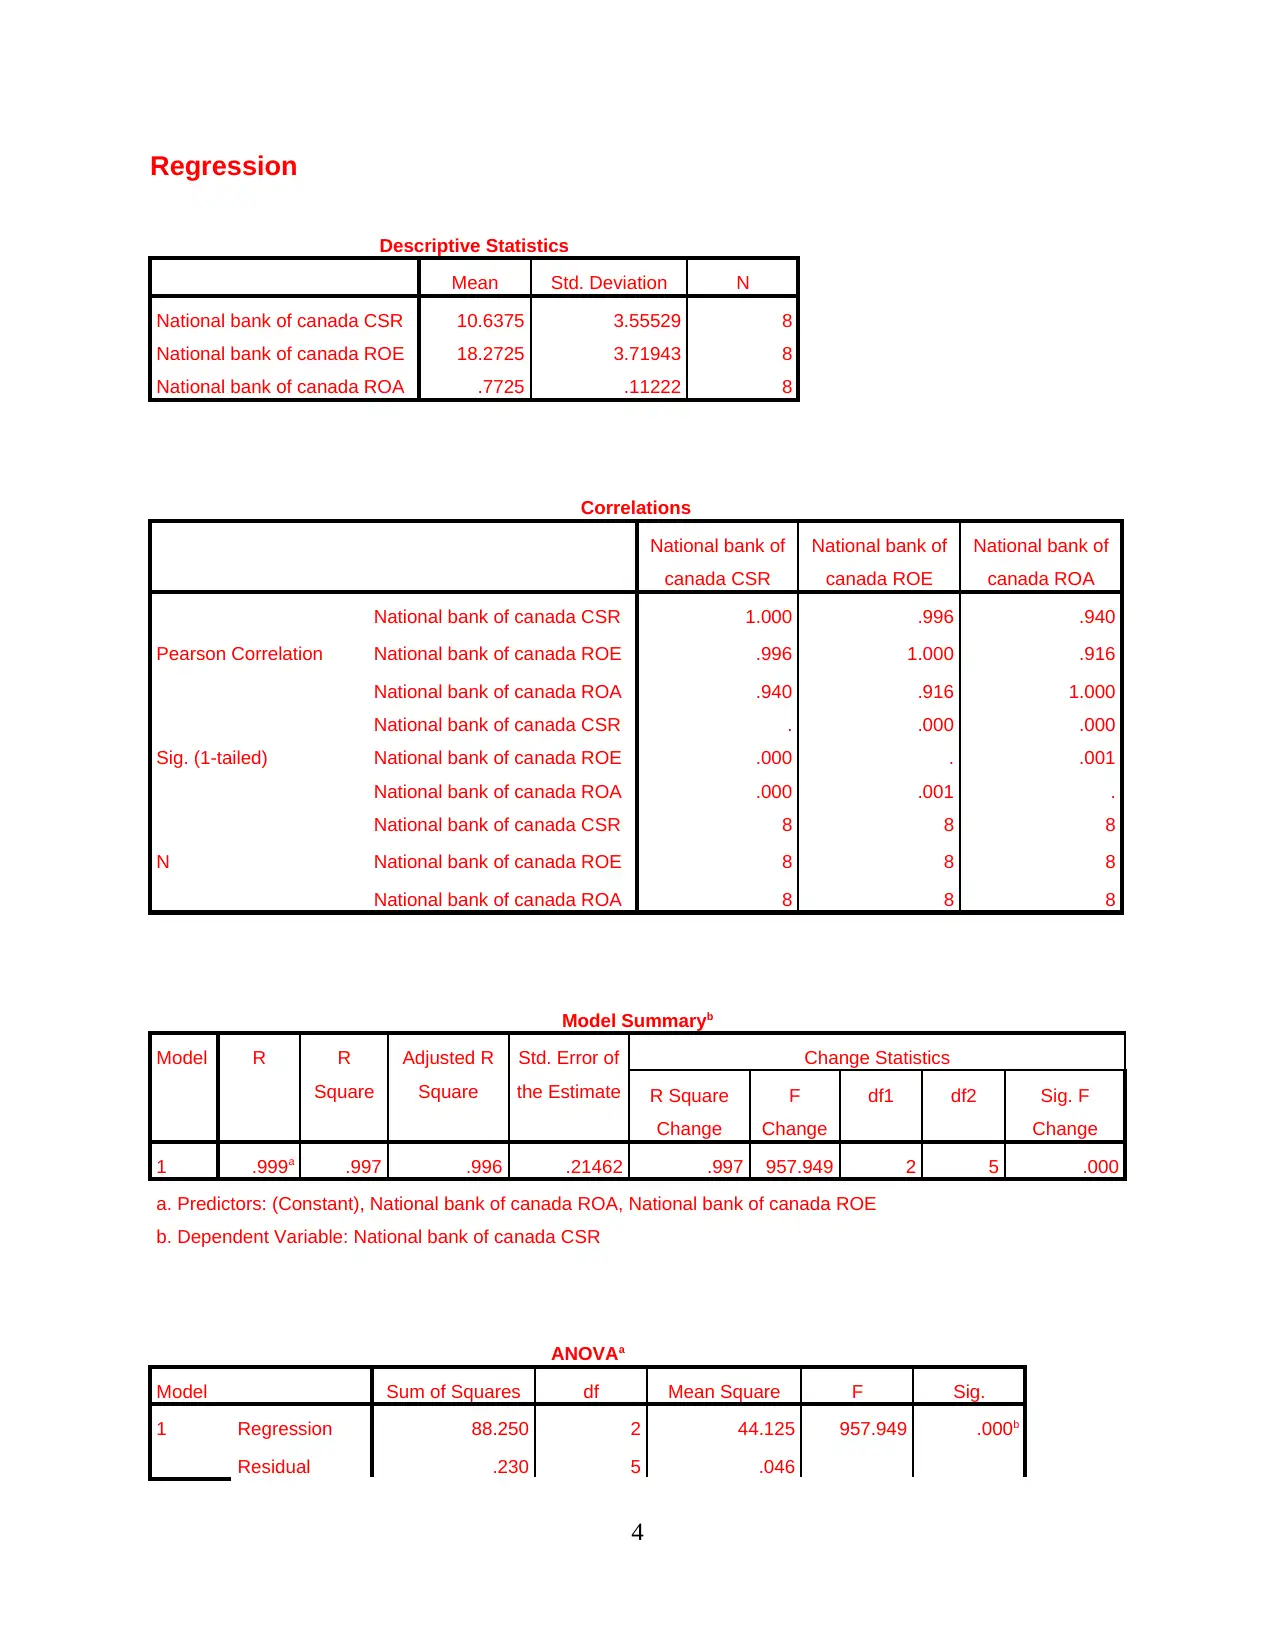
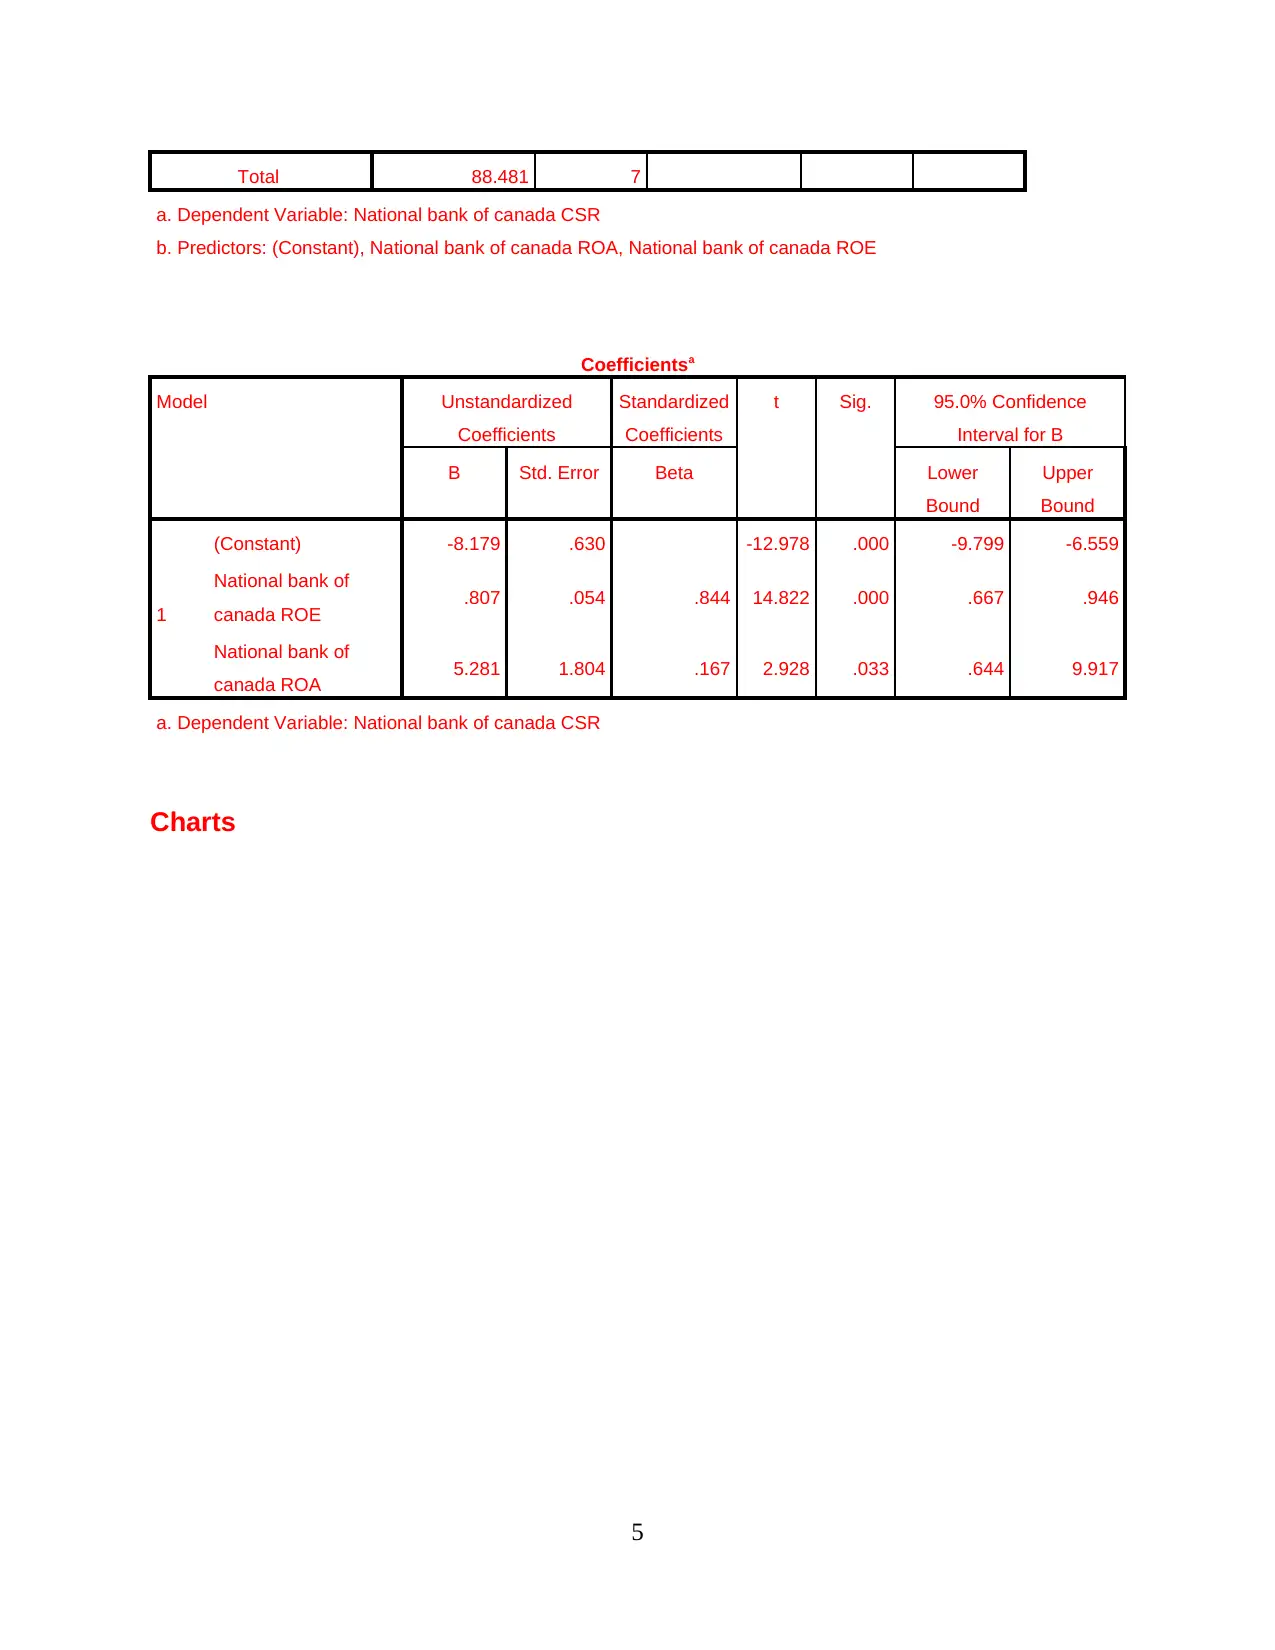
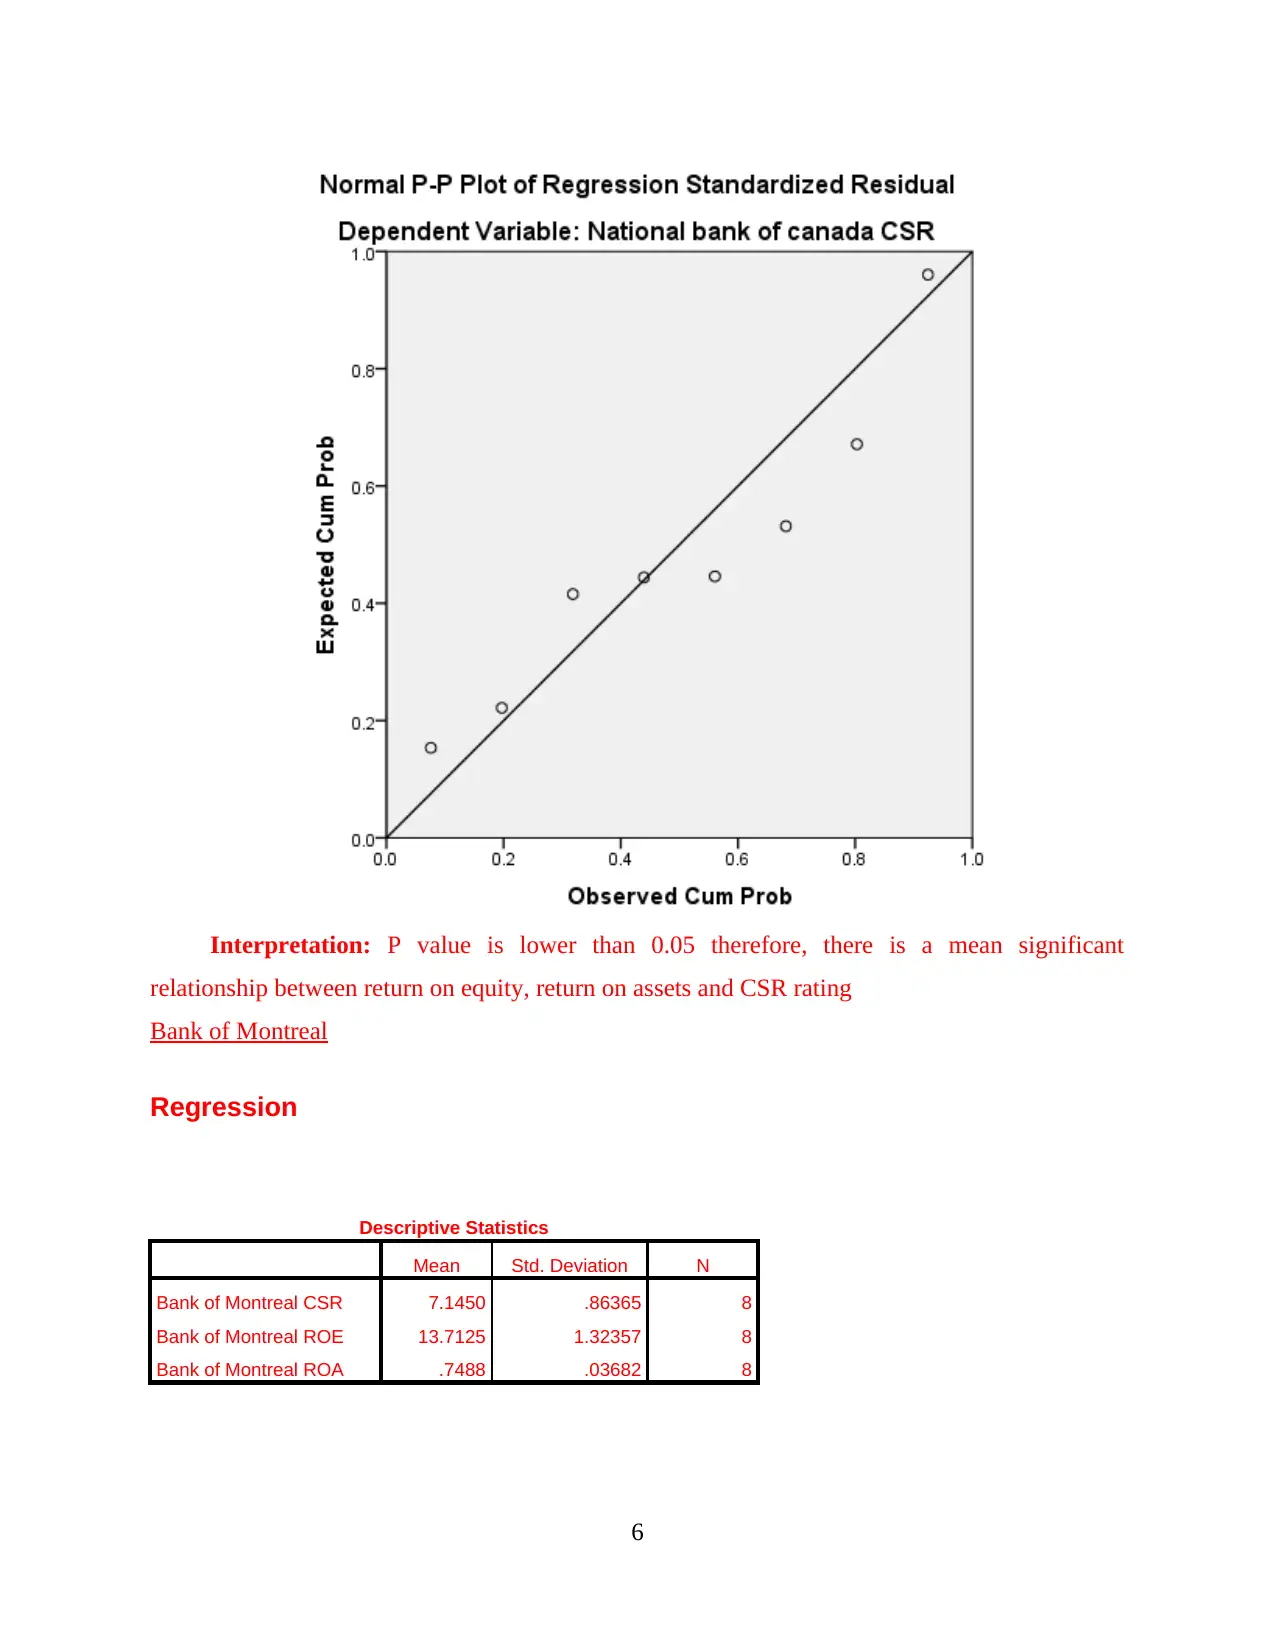
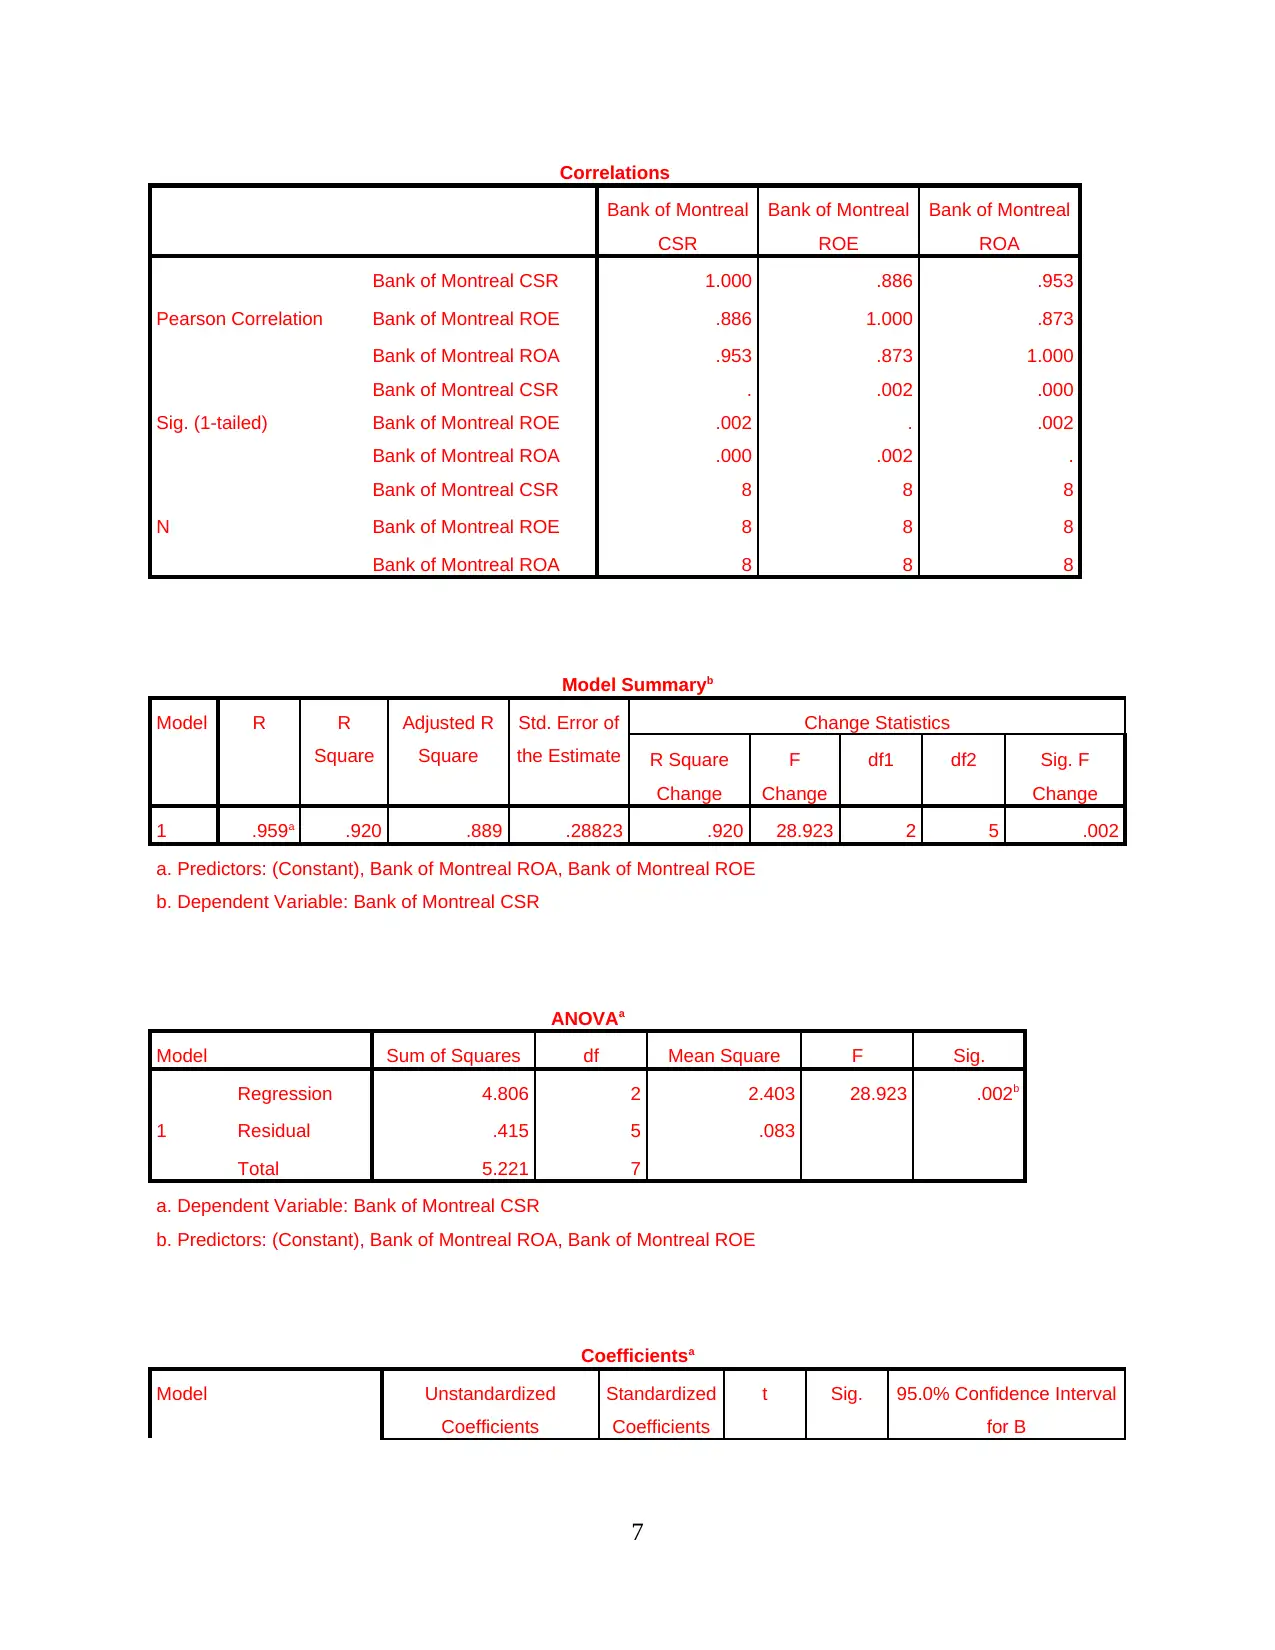
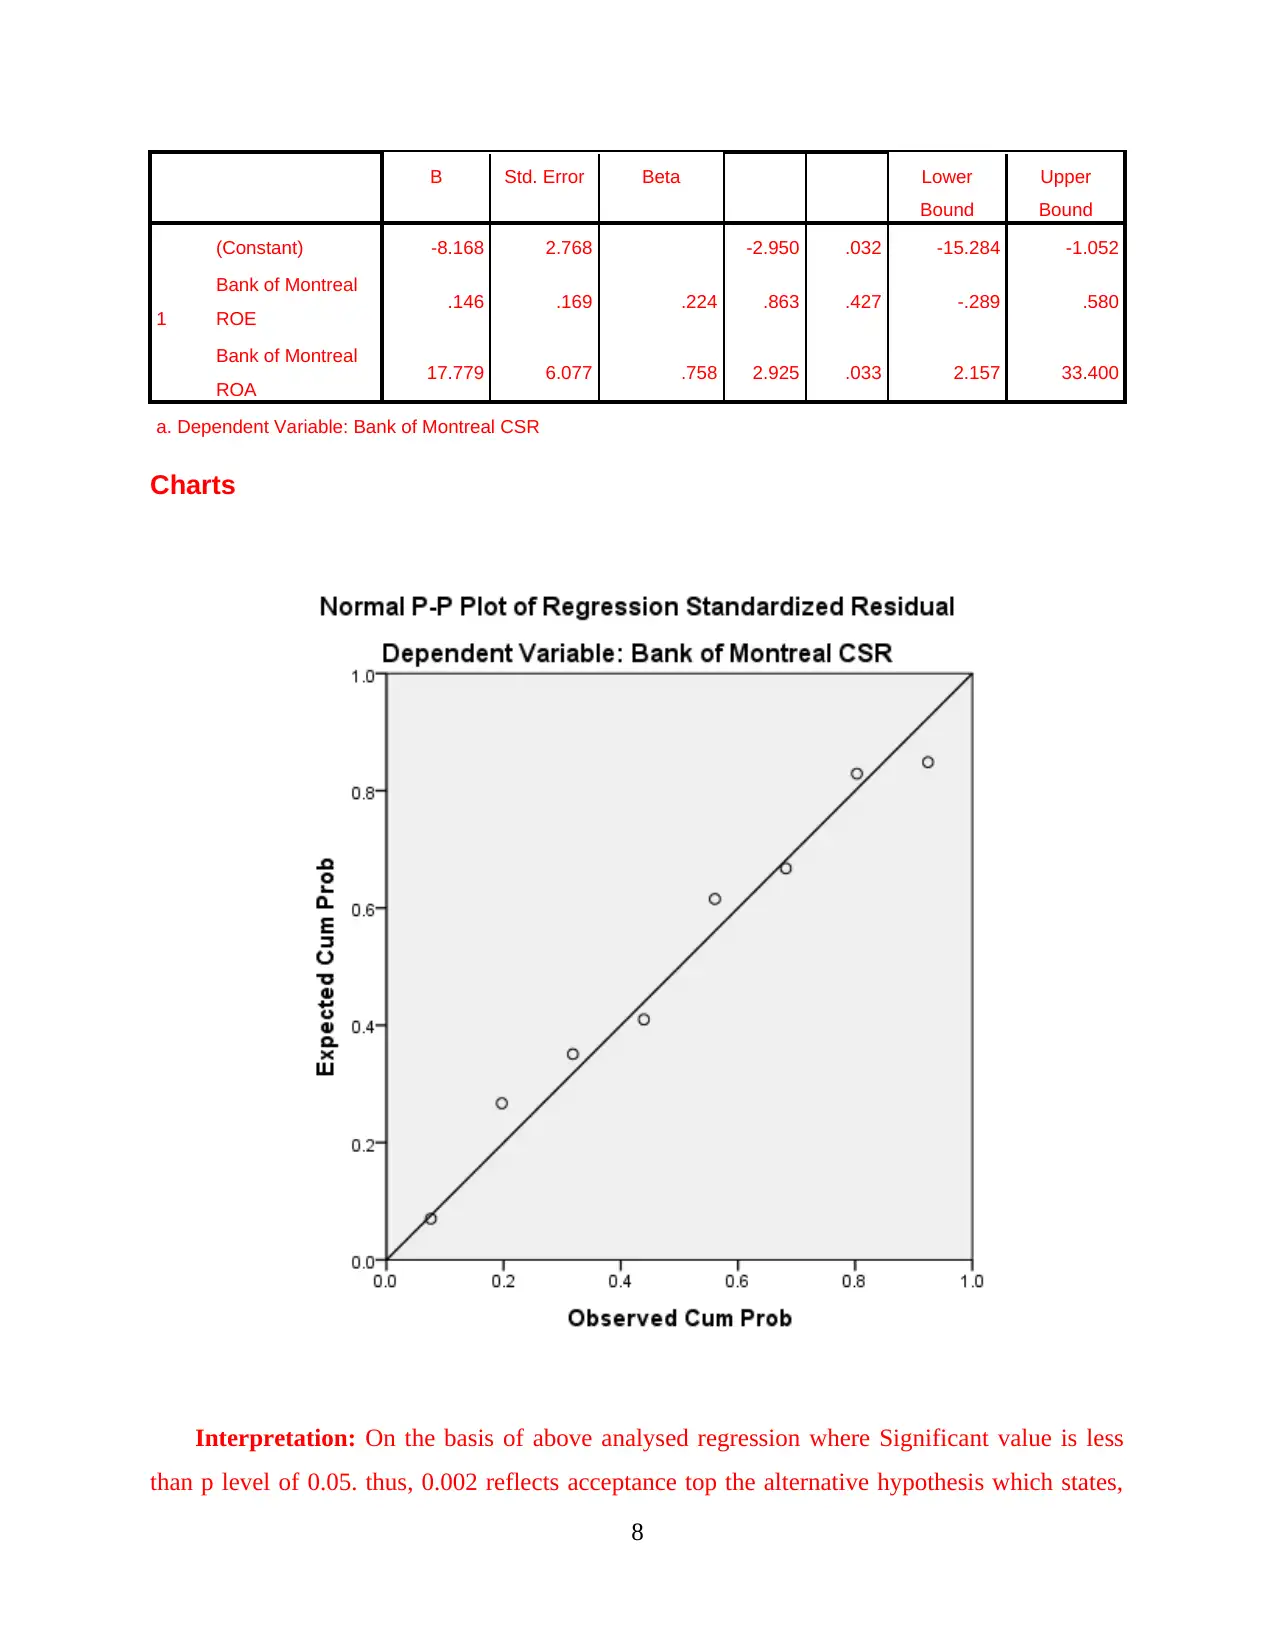
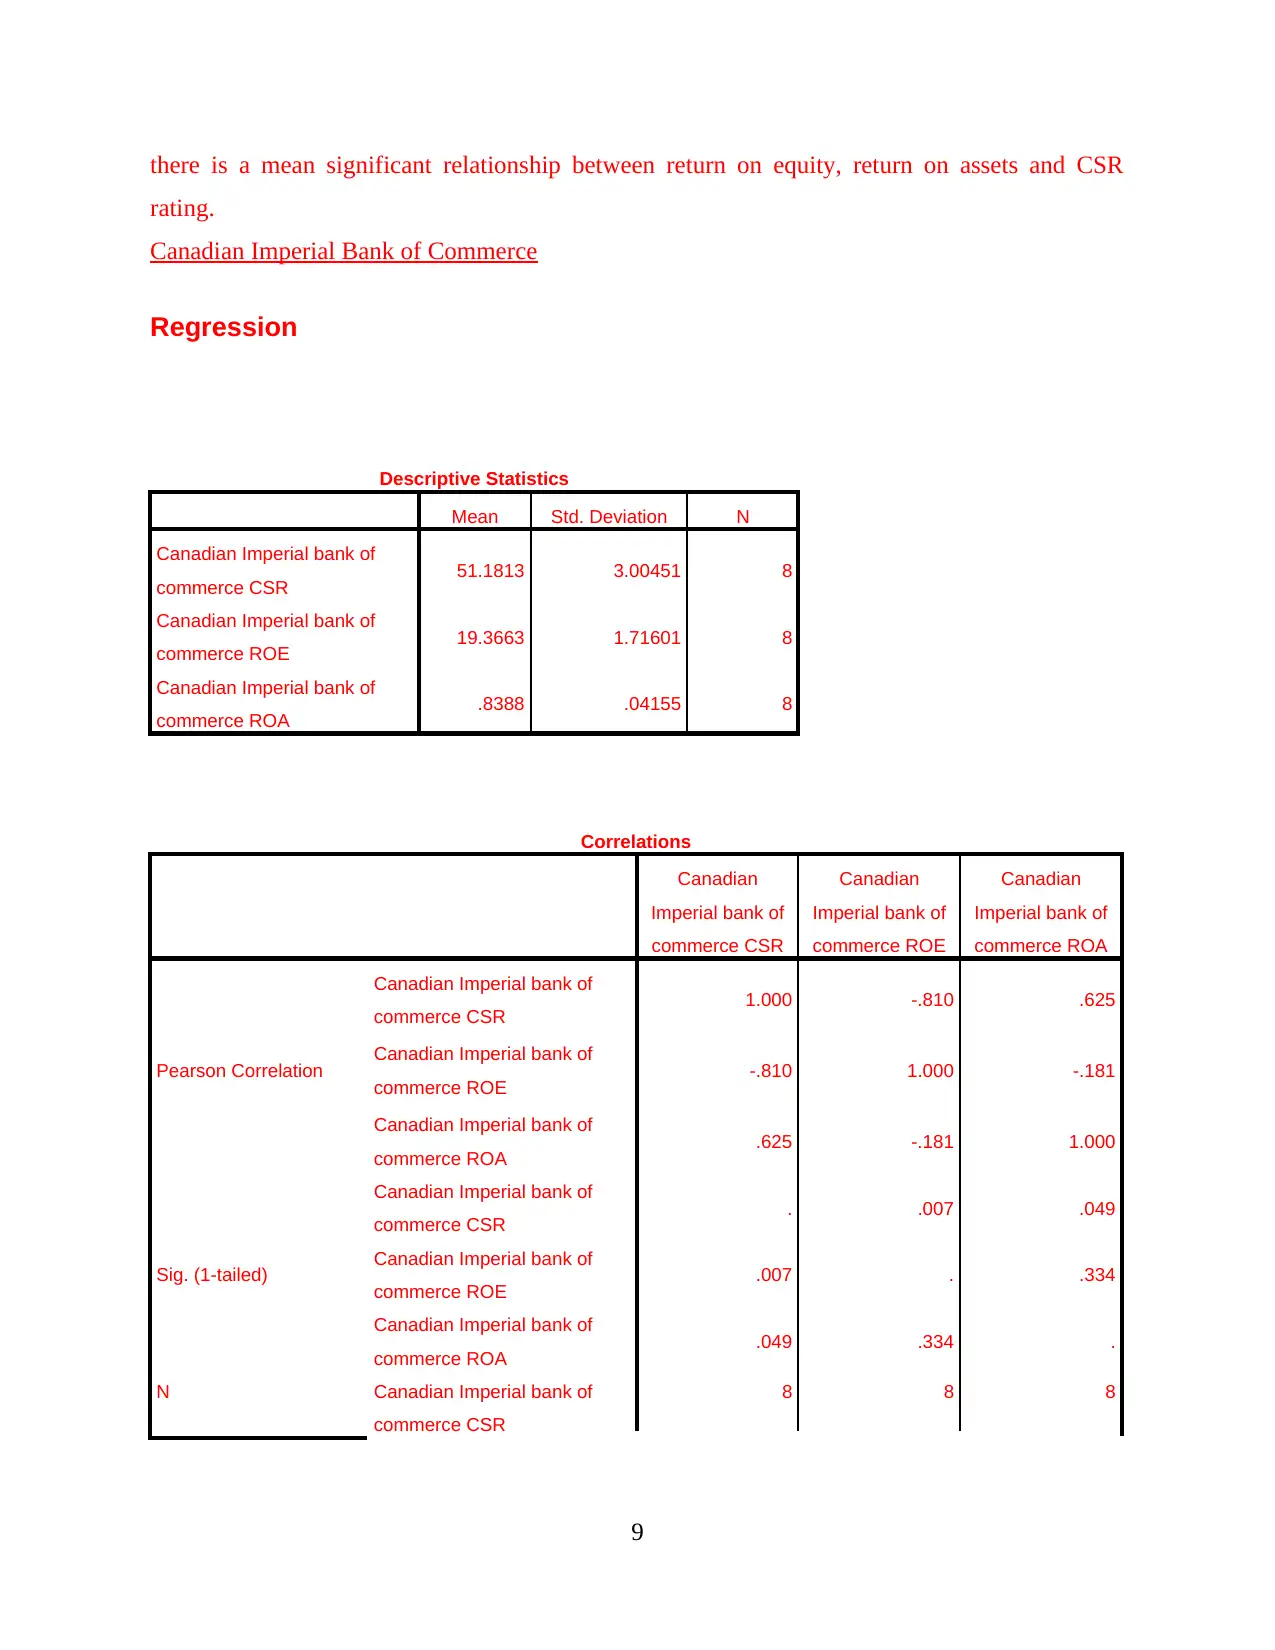
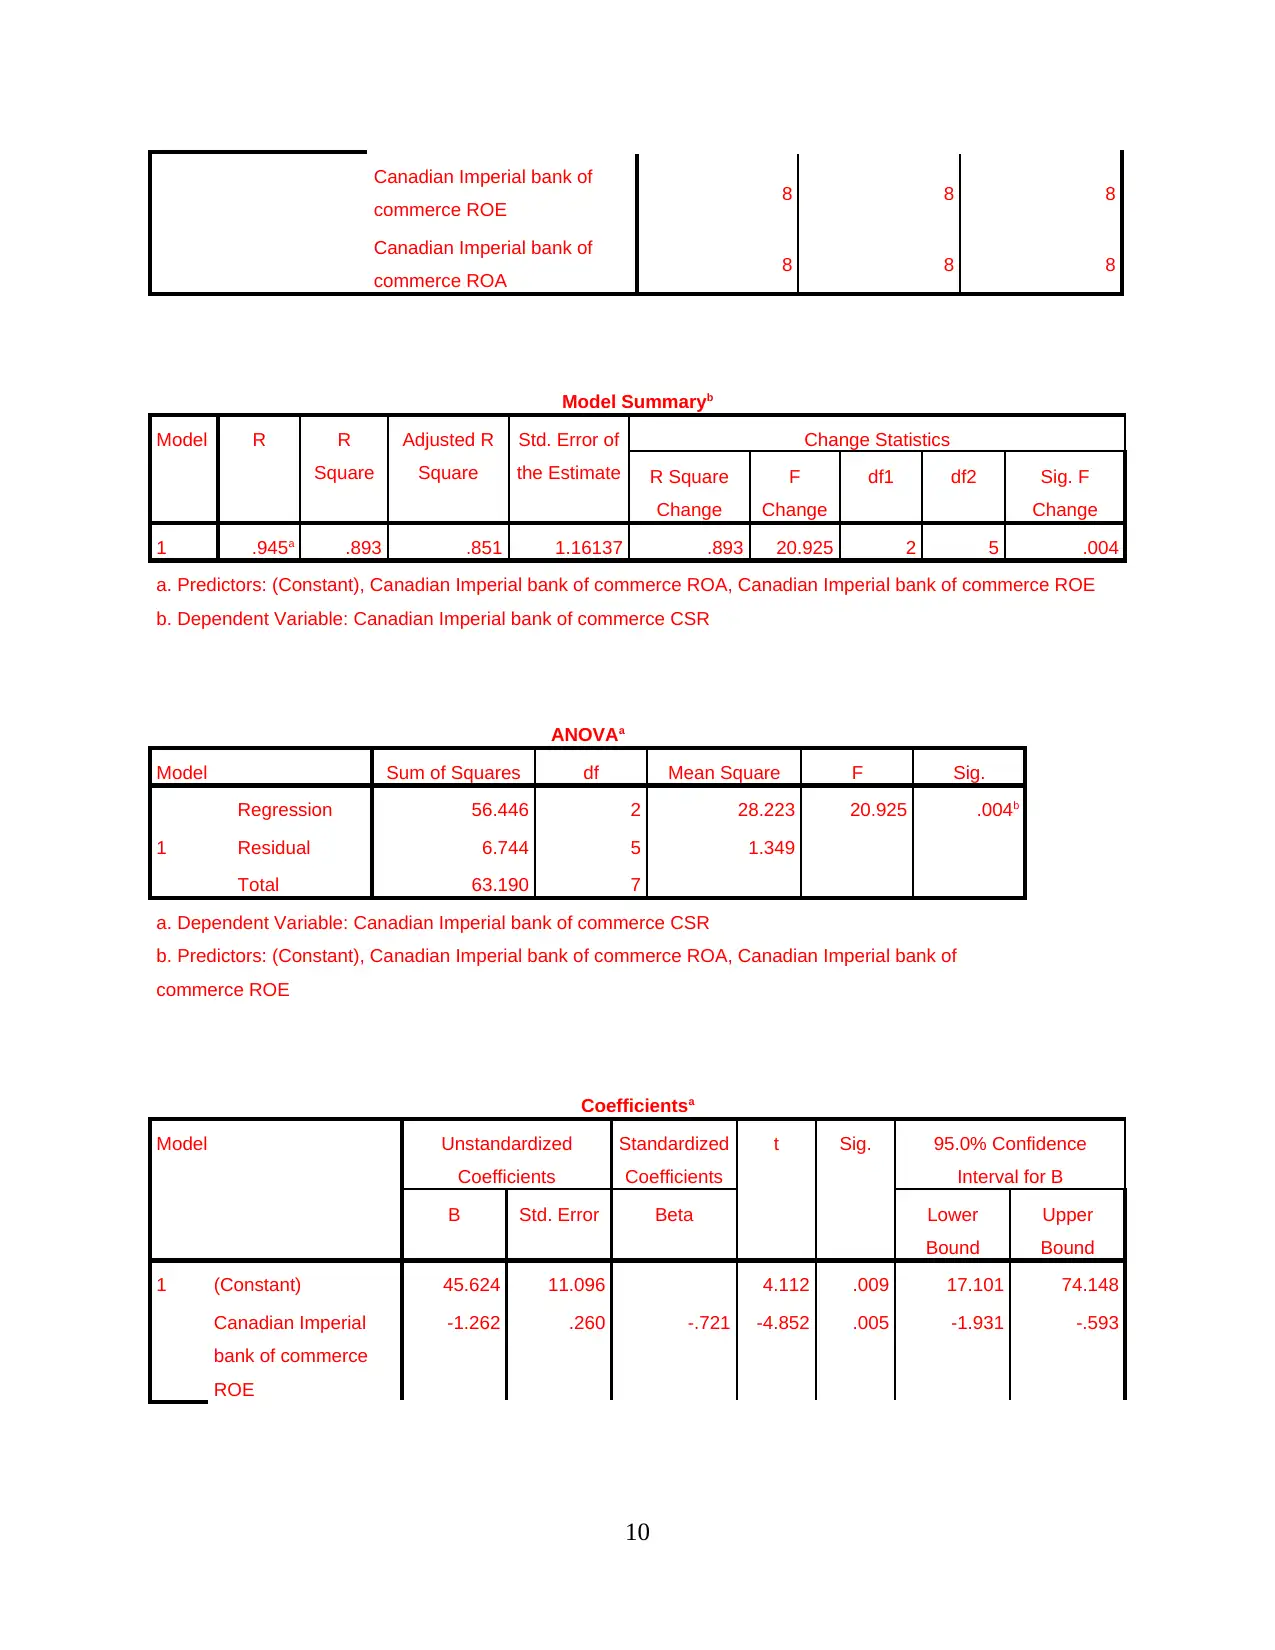
This report presents a regression analysis examining the relationship between Corporate Social Responsibility (CSR) and financial performance metrics, specifically Return on Equity (ROE) and Return on Assets (ROA), across eight major Canadian banks. The study formulates a hypothesis to assess the significance of this relationship, employing descriptive statistics, correlation analysis, and model summaries to interpret the data. The analysis involves a detailed examination of each bank, including Royal Bank of Canada, National Bank of Canada, Bank of Montreal, Canadian Imperial Bank of Commerce, Bank of Nova Scotia, Canadian Western Bank, Laurentian Bank of Canada and Toronto-Dominion Bank. The findings are based on the analysis of descriptive statistics, correlations, model summaries and ANOVA tables, which provide insights into the statistical significance of the relationship between CSR ratings and financial performance. The report concludes with an interpretation of the results, indicating whether the alternative hypothesis, which posits a significant relationship, is accepted or rejected based on p-values and R values derived from the regression analysis. The report highlights the varying degrees of correlation and significance across the different banks, offering a comprehensive view of the impact of CSR on financial outcomes within the Canadian banking sector.

DATA ANALYSIS
Paraphrase This Document
Need a fresh take? Get an instant paraphrase of this document with our AI Paraphraser

TABLE OF CONTENTS
INTRODUCTION...........................................................................................................................1
Hypothesis:..................................................................................................................................1
Royal bank of Canada..................................................................................................................1
National Bank of Canada.............................................................................................................3
Bank of Montreal.........................................................................................................................6
Canadian Imperial Bank of Commerce.......................................................................................9
Bank of Nova Scotia..................................................................................................................12
Canadian Western Bank............................................................................................................14
Laurentian Bank of Canada.......................................................................................................17
Toronto- dominion Bank...........................................................................................................20
CONCLUSION..............................................................................................................................23
REFERENCES..............................................................................................................................24

INTRODUCTION
In this chapter of research project will be consist of various measurement which will be used
to analyse the relationship between variables. Thus, the impacts of CSR (Human rights) on the
financial performance of Canadian Banks have been examined through regression analysis.
Thus, this statistical analysis is being accurate to examine the relationship between two variables.
There has been collection financial information of 8 Canadian Banks such as Return on Equity,
Return on assets and their CSR rating.
Hypothesis:
There has been creation of hypothesis which will be used to analyse the data base and
making effective study over the facts such as:
Hypothesis 1
Null Hypothesis: There is no mean significant relationship between return on equity,
return on assets and CSR rating
Alternative Hypothesis: There is a mean significant relationship between return on
equity, return on assets and CSR rating (Yoo and et.al., 2018)
Royal bank of Canada
Descriptive Statistics
Mean Std. Deviation N
Royal bank of Canada CSR 48.5438 5.36493 8
Royal bank of Canada ROE 17.4712 2.13591 8
Royal bank of Canada ROA .9050 .11747 8
Correlations
Royal bank of
Canada CSR
Royal bank of
Canada ROE
Royal bank of
Canada ROA
Pearson Correlation
Royal bank of Canada CSR 1.000 .197 .590
Royal bank of Canada ROE .197 1.000 .906
Royal bank of Canada ROA .590 .906 1.000
Sig. (1-tailed)
Royal bank of Canada CSR . .320 .062
Royal bank of Canada ROE .320 . .001
Royal bank of Canada ROA .062 .001 .
N Royal bank of Canada CSR 8 8 8
1
⊘ This is a preview!⊘
Do you want full access?
Subscribe today to unlock all pages.

Trusted by 1+ million students worldwide

Royal bank of Canada ROE 8 8 8
Royal bank of Canada ROA 8 8 8
Model Summaryb
Model R R
Square
Adjusted R
Square
Std. Error of
the Estimate
Change Statistics
R Square
Change
F
Change
df1 df2 Sig. F
Change
1 .994a .989 .984 .67590 .989 218.011 2 5 .000
a. Predictors: (Constant), Royal bank of Canada ROA, Royal bank of Canada ROE
b. Dependent Variable: Royal bank of Canada CSR
ANOVAa
Model Sum of Squares df Mean Square F Sig.
1
Regression 199.193 2 99.596 218.011 .000b
Residual 2.284 5 .457
Total 201.477 7
a. Dependent Variable: Royal bank of Canada CSR
b. Predictors: (Constant), Royal bank of Canada ROA, Royal bank of Canada ROE
Coefficientsa
Model Unstandardized
Coefficients
Standardized
Coefficients
t Sig. 95.0% Confidence
Interval for B
B Std. Error Beta Lower
Bound
Upper
Bound
1
(Constant) 36.307 2.111 17.202 .000 30.881 41.732
Royal bank of
Canada ROE -4.753 .283 -1.892 -16.801 .000 -5.480 -4.025
Royal bank of
Canada ROA 105.270 5.143 2.305 20.468 .000 92.049 118.491
a. Dependent Variable: Royal bank of Canada CSR
Charts
2
Paraphrase This Document
Need a fresh take? Get an instant paraphrase of this document with our AI Paraphraser

Interpretation: On the basis of analysing the impacts of ROA and ROE on the CSR rating
on Royal bank of Canada where regression analysis has been conducted by the researcher. Thus,
the outcomes reflected R value as 0.994 which states the data is 99.4% relevant to each other.
Similarly, in relation with analysing the significant value of the data set which determines
outcomes lower than p value of 0.05, therefore, there will be acceptance to the alternative
hypothesis such as, there is a mean significant relationship between return on equity, return on
assets and CSR rating
National Bank of Canada
3

Regression
Descriptive Statistics
Mean Std. Deviation N
National bank of canada CSR 10.6375 3.55529 8
National bank of canada ROE 18.2725 3.71943 8
National bank of canada ROA .7725 .11222 8
Correlations
National bank of
canada CSR
National bank of
canada ROE
National bank of
canada ROA
Pearson Correlation
National bank of canada CSR 1.000 .996 .940
National bank of canada ROE .996 1.000 .916
National bank of canada ROA .940 .916 1.000
Sig. (1-tailed)
National bank of canada CSR . .000 .000
National bank of canada ROE .000 . .001
National bank of canada ROA .000 .001 .
N
National bank of canada CSR 8 8 8
National bank of canada ROE 8 8 8
National bank of canada ROA 8 8 8
Model Summaryb
Model R R
Square
Adjusted R
Square
Std. Error of
the Estimate
Change Statistics
R Square
Change
F
Change
df1 df2 Sig. F
Change
1 .999a .997 .996 .21462 .997 957.949 2 5 .000
a. Predictors: (Constant), National bank of canada ROA, National bank of canada ROE
b. Dependent Variable: National bank of canada CSR
ANOVAa
Model Sum of Squares df Mean Square F Sig.
1 Regression 88.250 2 44.125 957.949 .000b
Residual .230 5 .046
4
⊘ This is a preview!⊘
Do you want full access?
Subscribe today to unlock all pages.

Trusted by 1+ million students worldwide

Total 88.481 7
a. Dependent Variable: National bank of canada CSR
b. Predictors: (Constant), National bank of canada ROA, National bank of canada ROE
Coefficientsa
Model Unstandardized
Coefficients
Standardized
Coefficients
t Sig. 95.0% Confidence
Interval for B
B Std. Error Beta Lower
Bound
Upper
Bound
1
(Constant) -8.179 .630 -12.978 .000 -9.799 -6.559
National bank of
canada ROE .807 .054 .844 14.822 .000 .667 .946
National bank of
canada ROA 5.281 1.804 .167 2.928 .033 .644 9.917
a. Dependent Variable: National bank of canada CSR
Charts
5
a. Dependent Variable: National bank of canada CSR
b. Predictors: (Constant), National bank of canada ROA, National bank of canada ROE
Coefficientsa
Model Unstandardized
Coefficients
Standardized
Coefficients
t Sig. 95.0% Confidence
Interval for B
B Std. Error Beta Lower
Bound
Upper
Bound
1
(Constant) -8.179 .630 -12.978 .000 -9.799 -6.559
National bank of
canada ROE .807 .054 .844 14.822 .000 .667 .946
National bank of
canada ROA 5.281 1.804 .167 2.928 .033 .644 9.917
a. Dependent Variable: National bank of canada CSR
Charts
5
Paraphrase This Document
Need a fresh take? Get an instant paraphrase of this document with our AI Paraphraser

Interpretation: P value is lower than 0.05 therefore, there is a mean significant
relationship between return on equity, return on assets and CSR rating
Bank of Montreal
Regression
Descriptive Statistics
Mean Std. Deviation N
Bank of Montreal CSR 7.1450 .86365 8
Bank of Montreal ROE 13.7125 1.32357 8
Bank of Montreal ROA .7488 .03682 8
6
relationship between return on equity, return on assets and CSR rating
Bank of Montreal
Regression
Descriptive Statistics
Mean Std. Deviation N
Bank of Montreal CSR 7.1450 .86365 8
Bank of Montreal ROE 13.7125 1.32357 8
Bank of Montreal ROA .7488 .03682 8
6

Correlations
Bank of Montreal
CSR
Bank of Montreal
ROE
Bank of Montreal
ROA
Pearson Correlation
Bank of Montreal CSR 1.000 .886 .953
Bank of Montreal ROE .886 1.000 .873
Bank of Montreal ROA .953 .873 1.000
Sig. (1-tailed)
Bank of Montreal CSR . .002 .000
Bank of Montreal ROE .002 . .002
Bank of Montreal ROA .000 .002 .
N
Bank of Montreal CSR 8 8 8
Bank of Montreal ROE 8 8 8
Bank of Montreal ROA 8 8 8
Model Summaryb
Model R R
Square
Adjusted R
Square
Std. Error of
the Estimate
Change Statistics
R Square
Change
F
Change
df1 df2 Sig. F
Change
1 .959a .920 .889 .28823 .920 28.923 2 5 .002
a. Predictors: (Constant), Bank of Montreal ROA, Bank of Montreal ROE
b. Dependent Variable: Bank of Montreal CSR
ANOVAa
Model Sum of Squares df Mean Square F Sig.
1
Regression 4.806 2 2.403 28.923 .002b
Residual .415 5 .083
Total 5.221 7
a. Dependent Variable: Bank of Montreal CSR
b. Predictors: (Constant), Bank of Montreal ROA, Bank of Montreal ROE
Coefficientsa
Model Unstandardized
Coefficients
Standardized
Coefficients
t Sig. 95.0% Confidence Interval
for B
7
Bank of Montreal
CSR
Bank of Montreal
ROE
Bank of Montreal
ROA
Pearson Correlation
Bank of Montreal CSR 1.000 .886 .953
Bank of Montreal ROE .886 1.000 .873
Bank of Montreal ROA .953 .873 1.000
Sig. (1-tailed)
Bank of Montreal CSR . .002 .000
Bank of Montreal ROE .002 . .002
Bank of Montreal ROA .000 .002 .
N
Bank of Montreal CSR 8 8 8
Bank of Montreal ROE 8 8 8
Bank of Montreal ROA 8 8 8
Model Summaryb
Model R R
Square
Adjusted R
Square
Std. Error of
the Estimate
Change Statistics
R Square
Change
F
Change
df1 df2 Sig. F
Change
1 .959a .920 .889 .28823 .920 28.923 2 5 .002
a. Predictors: (Constant), Bank of Montreal ROA, Bank of Montreal ROE
b. Dependent Variable: Bank of Montreal CSR
ANOVAa
Model Sum of Squares df Mean Square F Sig.
1
Regression 4.806 2 2.403 28.923 .002b
Residual .415 5 .083
Total 5.221 7
a. Dependent Variable: Bank of Montreal CSR
b. Predictors: (Constant), Bank of Montreal ROA, Bank of Montreal ROE
Coefficientsa
Model Unstandardized
Coefficients
Standardized
Coefficients
t Sig. 95.0% Confidence Interval
for B
7
⊘ This is a preview!⊘
Do you want full access?
Subscribe today to unlock all pages.

Trusted by 1+ million students worldwide

B Std. Error Beta Lower
Bound
Upper
Bound
1
(Constant) -8.168 2.768 -2.950 .032 -15.284 -1.052
Bank of Montreal
ROE .146 .169 .224 .863 .427 -.289 .580
Bank of Montreal
ROA 17.779 6.077 .758 2.925 .033 2.157 33.400
a. Dependent Variable: Bank of Montreal CSR
Charts
Interpretation: On the basis of above analysed regression where Significant value is less
than p level of 0.05. thus, 0.002 reflects acceptance top the alternative hypothesis which states,
8
Bound
Upper
Bound
1
(Constant) -8.168 2.768 -2.950 .032 -15.284 -1.052
Bank of Montreal
ROE .146 .169 .224 .863 .427 -.289 .580
Bank of Montreal
ROA 17.779 6.077 .758 2.925 .033 2.157 33.400
a. Dependent Variable: Bank of Montreal CSR
Charts
Interpretation: On the basis of above analysed regression where Significant value is less
than p level of 0.05. thus, 0.002 reflects acceptance top the alternative hypothesis which states,
8
Paraphrase This Document
Need a fresh take? Get an instant paraphrase of this document with our AI Paraphraser

there is a mean significant relationship between return on equity, return on assets and CSR
rating.
Canadian Imperial Bank of Commerce
Regression
Descriptive Statistics
Mean Std. Deviation N
Canadian Imperial bank of
commerce CSR 51.1813 3.00451 8
Canadian Imperial bank of
commerce ROE 19.3663 1.71601 8
Canadian Imperial bank of
commerce ROA .8388 .04155 8
Correlations
Canadian
Imperial bank of
commerce CSR
Canadian
Imperial bank of
commerce ROE
Canadian
Imperial bank of
commerce ROA
Pearson Correlation
Canadian Imperial bank of
commerce CSR 1.000 -.810 .625
Canadian Imperial bank of
commerce ROE -.810 1.000 -.181
Canadian Imperial bank of
commerce ROA .625 -.181 1.000
Sig. (1-tailed)
Canadian Imperial bank of
commerce CSR . .007 .049
Canadian Imperial bank of
commerce ROE .007 . .334
Canadian Imperial bank of
commerce ROA .049 .334 .
N Canadian Imperial bank of
commerce CSR
8 8 8
9

Canadian Imperial bank of
commerce ROE 8 8 8
Canadian Imperial bank of
commerce ROA 8 8 8
Model Summaryb
Model R R
Square
Adjusted R
Square
Std. Error of
the Estimate
Change Statistics
R Square
Change
F
Change
df1 df2 Sig. F
Change
1 .945a .893 .851 1.16137 .893 20.925 2 5 .004
a. Predictors: (Constant), Canadian Imperial bank of commerce ROA, Canadian Imperial bank of commerce ROE
b. Dependent Variable: Canadian Imperial bank of commerce CSR
ANOVAa
Model Sum of Squares df Mean Square F Sig.
1
Regression 56.446 2 28.223 20.925 .004b
Residual 6.744 5 1.349
Total 63.190 7
a. Dependent Variable: Canadian Imperial bank of commerce CSR
b. Predictors: (Constant), Canadian Imperial bank of commerce ROA, Canadian Imperial bank of
commerce ROE
Coefficientsa
Model Unstandardized
Coefficients
Standardized
Coefficients
t Sig. 95.0% Confidence
Interval for B
B Std. Error Beta Lower
Bound
Upper
Bound
1 (Constant) 45.624 11.096 4.112 .009 17.101 74.148
Canadian Imperial
bank of commerce
ROE
-1.262 .260 -.721 -4.852 .005 -1.931 -.593
10
⊘ This is a preview!⊘
Do you want full access?
Subscribe today to unlock all pages.

Trusted by 1+ million students worldwide
1 out of 26

Your All-in-One AI-Powered Toolkit for Academic Success.
 +13062052269
info@desklib.com
Available 24*7 on WhatsApp / Email
Unlock your academic potential
Copyright © 2020–2025 A2Z Services. All Rights Reserved. Developed and managed by ZUCOL.