Criminology 2341 Literature Review: Canadian Criminal Justice Issues
VerifiedAdded on 2023/04/21
|24
|12850
|413
Literature Review
AI Summary
This literature review analyzes the Canadian Criminal Justice System, focusing on crime rates, incarceration, and socioeconomic inequality. The review examines the decline in crime rates since the early 1990s and the concurrent expansion of the correctional population in the United States. It explores how crime and punishment changes have impacted inequality, with crime declines benefiting poorer and minority cities, while increased incarceration disproportionately affects poor, minority males. The review also explores the debate on incarceration's role in crime decline, the impact of probation and fines, and the unequal distribution of crime victimization. The review is based on eight journal articles (from 2010-present, with a majority of Canadian content) and identifies key themes within the Canadian Criminal Justice System and the administration of this system. The author also provided a paragraph on each journal article and included the first page of each article as requested in the assignment brief.
Journal of Economic Perspectives—Volume 30, Number 2—Spring 2016—Pages 103
After peaking in the early 1990s, official measures of violent and property
crime rates have dropped to levels not seen since the 1960s. Proportional
declines in the most serious offenses have been particularly pronounced.
For example, murders/manslaughter per 100,000 declined by more than half,
from 9.8 in 1991 to 4.5 in 2014, the lowest recorded murder rate since 1960. The
violent crime rate overall fell by approximately half over this period, while overall
property crime rates fell by nearly 50 percent. Juxtaposed against this declinin
crime rate has been an enormous and unprecedented expansion in US correc-
tional populations. Between 1980 and 2013, the prison incarceration rate increased
nearly 3.5 times, the jail incarceration rate increased by nearly three times, while
the community correction supervision rate (numbers of people on probation or
parole per 100,000) increased by 2.6 times. By 2013, roughly 3 percent of the adult
population in the United States was under some form of criminal justice supervi-
sion. During this time period, the United States transitioned from a nation with
an incarceration rate slightly higher than that of western European nations to the
nation with the highest incarceration rate in the world.
These two coinciding trends present a provocative contrast, illustrating the
conflicting manner in which changes in crime and punishment over the past few
decades have impacted socioeconomic inequality in the United States. As we will
Crime, the Criminal Justice System, an
Socioeconomic Inequality
■ Magnus Lofstrom is a Senior Fellow, Public Policy Institute of California, San Francisc
California. Steven Raphael is Professor of Public Policy, Goldman School of Public Polic
University of California, Berkeley, California. Their email addresses are lofstrom@ppic
and stevenraphael@berkeley.edu.
† For supplementary materials such as appendices, datasets, and author disclosure statements, see the
article page at
http://dx.doi.org/10.1257/jep.30.2.103 doi=10.1257/jep.30.2.103
Magnus Lofstrom and Steven Raphael
Paraphrase This Document
Need a fresh take? Get an instant paraphrase of this document with our AI Paraphraser
104 Journal of Economic Perspectives
show, crime rates declined the most in poorer and more minority cities, and within
cities in the poorest neighborhoods. In other words, the benefits of the crime
decline have been progressively distributed. By contrast, the social costs created
by the unprecedented expansion in correctional populations have been regres-
sively distributed, with poor, disproportionately minority males (African-American
males in particular) being most directly impacted and poor minority families (again
African-American families in particular) disproportionately bearing the collateral
social costs of the stiffening of US sentencing policy.
There is an ongoing debate on the extent to which the rise in incarceration and
the extended reach of the criminal justice system drove recent declines in crime.
There is fairly strong evidence for the United States and other nations that incarcer-
ation can have sizeable effects in reducing crime, operating largely through physical
incapacitation. These effects, however, diminish with scale. Expanding the use of
incarceration along the intensive margin of longer sentences results in the incar-
ceration of individuals into advanced ages when the propensity to offend declines,
while expanding along the extensive margin will lead to the incarceration of indi-
viduals who are less criminally active. There is less evidence that the more extensive
use of probation, and the increased propensity of courts to levy fines and fees on
those convicted of serious and less-serious criminal offenses, have contributed to
crime declines.
In what follows, we document that poor and minority communities have dispro-
portionately experienced both the decline in crime and the increase in criminal justice
sanctioning. We argue that the coincidence of these two trends do not necessarily
mean that one has caused the other. In particular, the crime decline commencing
in the early 1990s is observed in other countries that have not greatly expanded the
scope and reach of their criminal justice systems. Moreover, while increases in incar-
ceration during the 1980s likely suppressed peak crime rates in the early 1990s, the
decline in crime since that time corresponds to a period of rapid growth in incar-
ceration levels for which there is little evidence of an appreciable impact on crime.
Finally, the recent experiences of several states with reducing incarceration suggest
that the contribution of higher incarceration rates to crime abatement is limited at
current levels. The experience of California where the state was forced by a federal
court to reduce its incarceration rate to 1990 levels is particularly instructive. In the
conclusion, we argue that public policy can and should pursue ongoing reductions
in crime and in the inequality of crime victimization, while simultaneously seeking to
reduce the inequality of criminal justice sanctioning.
Inequality in Criminal Victimization
There are two principal sources of crime data in the United States. First, the
Uniform Crime Reports (UCR) provide counts of crimes known to the police by
month and crime type. Second, the National Crime Victimization Survey (NCVS)
provides crime rate estimates based on an annual household survey conducted by
Magnus Lofstrom and Steven Raphael 105
the US Census Bureau. Crime rates tabulated from the NCVS tend to be higher
than those tabulated from the UCR due to underreporting of crimes to the police.
In addition, there can be notable differences in trend estimates from these tw
data sources. For example, during the 1970s and 1980s, the NCVS shows overall
decreases in crime while crime rates as measured by the UCR increase substantially.1
In recent years, trends in these two data sources tend to align. Both suggest
increase in serious violent crime during the 1980s. As we will soon see, both show
very pronounced declines in crime and victimization since the early 1990s. The
simultaneous analysis of these two data sources permits a more complete picture of
how crime/victimization risk varies with socioeconomic characteristics.
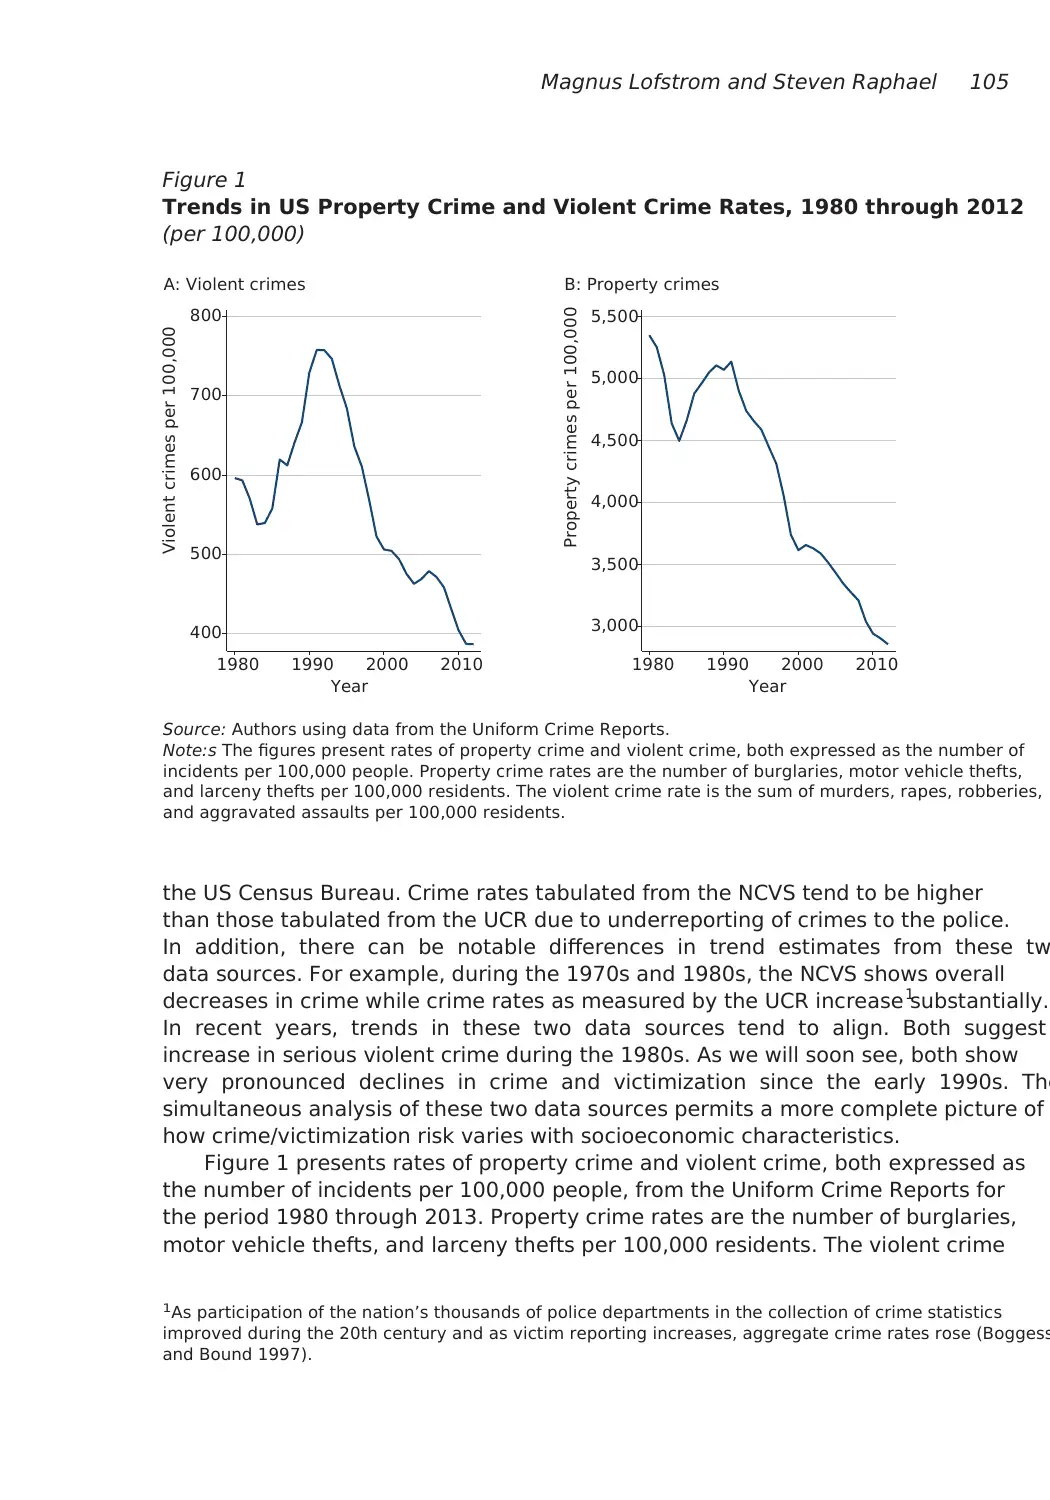
Figure 1 presents rates of property crime and violent crime, both expressed as
the number of incidents per 100,000 people, from the Uniform Crime Reports for
the period 1980 through 2013. Property crime rates are the number of burglaries,
motor vehicle thefts, and larceny thefts per 100,000 residents. The violent crime
1As participation of the nation’s thousands of police departments in the collection of crime statistics
improved during the 20th century and as victim reporting increases, aggregate crime rates rose (Boggess
and Bound 1997).
Figure 1
Trends in US Property Crime and Violent Crime Rates, 1980 through 2012
(per 100,000)
Source: Authors using data from the Uniform Crime Reports.
Note:s The figures present rates of property crime and violent crime, both expressed as the number of
incidents per 100,000 people. Property crime rates are the number of burglaries, motor vehicle thefts,
and larceny thefts per 100,000 residents. The violent crime rate is the sum of murders, rapes, robberies,
and aggravated assaults per 100,000 residents.
A: Violent crimes
400
500
600
700
800
Violent crimes per 100,000
1980 1990 2000 2010
Year
3,000
3,500
4,000
4,500
5,000
5,500
Property crimes per 100,000
1980 1990 2000 2010
Year
B: Property crimes
the US Census Bureau. Crime rates tabulated from the NCVS tend to be higher
than those tabulated from the UCR due to underreporting of crimes to the police.
In addition, there can be notable differences in trend estimates from these tw
data sources. For example, during the 1970s and 1980s, the NCVS shows overall
decreases in crime while crime rates as measured by the UCR increase substantially.1
In recent years, trends in these two data sources tend to align. Both suggest
increase in serious violent crime during the 1980s. As we will soon see, both show
very pronounced declines in crime and victimization since the early 1990s. The
simultaneous analysis of these two data sources permits a more complete picture of
how crime/victimization risk varies with socioeconomic characteristics.
Figure 1 presents rates of property crime and violent crime, both expressed as
the number of incidents per 100,000 people, from the Uniform Crime Reports for
the period 1980 through 2013. Property crime rates are the number of burglaries,
motor vehicle thefts, and larceny thefts per 100,000 residents. The violent crime
1As participation of the nation’s thousands of police departments in the collection of crime statistics
improved during the 20th century and as victim reporting increases, aggregate crime rates rose (Boggess
and Bound 1997).
Figure 1
Trends in US Property Crime and Violent Crime Rates, 1980 through 2012
(per 100,000)
Source: Authors using data from the Uniform Crime Reports.
Note:s The figures present rates of property crime and violent crime, both expressed as the number of
incidents per 100,000 people. Property crime rates are the number of burglaries, motor vehicle thefts,
and larceny thefts per 100,000 residents. The violent crime rate is the sum of murders, rapes, robberies,
and aggravated assaults per 100,000 residents.
A: Violent crimes
400
500
600
700
800
Violent crimes per 100,000
1980 1990 2000 2010
Year
3,000
3,500
4,000
4,500
5,000
5,500
Property crimes per 100,000
1980 1990 2000 2010
Year
B: Property crimes
⊘ This is a preview!⊘
Do you want full access?
Subscribe today to unlock all pages.
Trusted by 1+ million students worldwide
106 Journal of Economic Perspectives
rate is the sum of murders, rapes, robberies, and aggravated assaults per 100,000
residents. These seven felony crimes (often referred to as the FBI’s “part 1” felony
offenses) provide the standard categorization of serious offenses in the United
States. Both series show peaks in 1991. While there are some doubts about whether
the UCR-measured increase in property crime during the late 1980s captures an
actual rise in crime or trends in crime reporting by both victims and agencies
participating in the UCR (Boggess and Bound 1997), the increase in serious violent
crime—and homicide in particular—beginning around 1985 is a well-documented
fact (Blumstein and Rosenfeld 1998). Figure 1 also reveals very large declines in
crime rates from 1991 on. Violent crime rates dropped by more than half over this
period, while property crime rates fell by nearly half. As we will see shortly, victimiza-
tion statistics reveal very similar overall patterns.
One cannot use the historical data from the Uniform Crime Reports to explore
in a direct way how crime rates as experienced by different socioeconomic groups
have changed over time. For the most part, the data are summarized at the law
enforcement agency level with little micro-level information on specific criminal
incidents.2 However, police agencies tend to correspond geographically with incor-
porated cities, and cities vary considerably with respect to average socioeconomic
and demographic characteristics. Hence, one can assess the incidence of the crime
decline by examining the relationship between changes in crime rates across cities
with different socioeconomic characteristics.
Figures 2 and 3 present such an analysis for the years 1990 and 2008 based on
the data set produced by Kneebone and Raphael (2011). The data describe crime
rates and demographic characteristics for the roughly 5,400 cities located within the
nation’s 100 largest US metropolitan areas. Figure 2 groups the cities covered by
these data into deciles by the proportion of city residents that are African-American
in 2000, and displays the average violent and property crime rates for each group
for 1990 and 2008 (decile breaks are tabulated weighting by total 2000 city popu-
lation). Figure 3 presents comparable results when cities are stratified by deciles
according to the proportion of city residents that are below the poverty line (again
weighted by the 2000 total population).
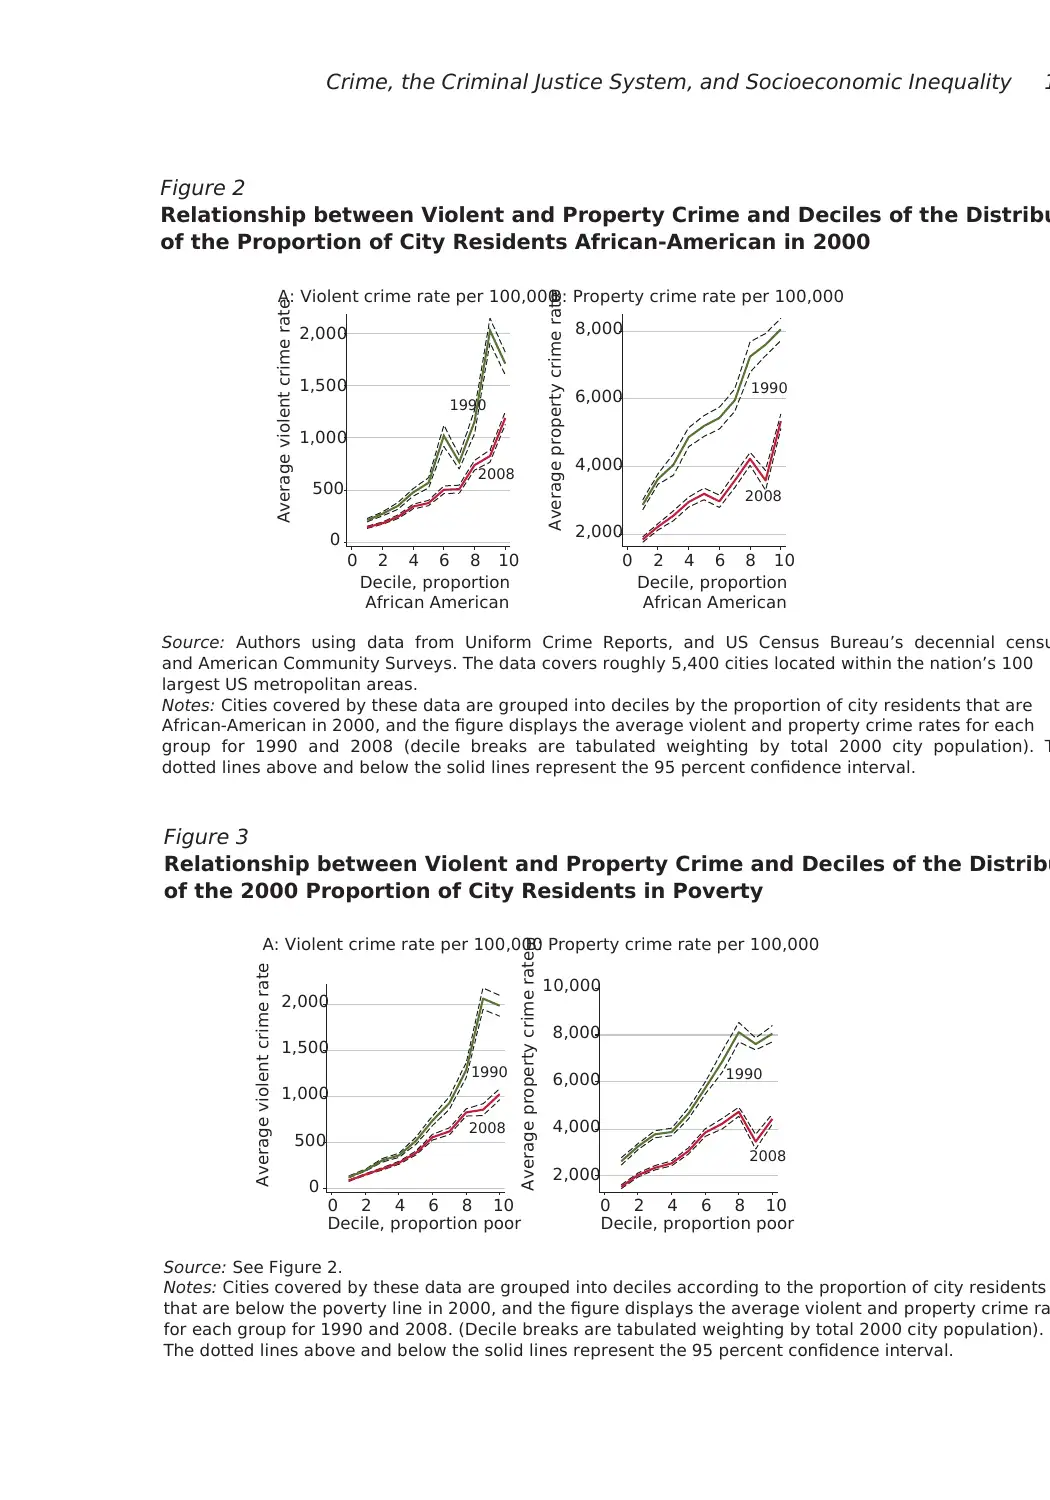
Property crime rates and violent crime rates are notably higher in cities where
a higher proportion of residents are African-American in both years. In addition,
crime rates are declining across all deciles. However, the figure reveals larger abso-
lute drops in cities with proportionally larger African-American population. While
the ratio of crime rates in decile 10 to crime rates in decile 1 actually increase slightly
between 1990 and 2008, the absolute differences in crime rates narrow considerably.
For example, the average violent crime rate in tenth-decile cities in 1990 exceeded
2The Uniform Crime Reports is slowly shifting towards the National Incident Based Reporting System
(NIBRS), which includes detailed micro-level information on specific criminal incidents. As of 2012,
agencies covering roughly 30 percent of the US population report criminal incidents through the NIBRS.
See 2012 “NIBRS Participation by State,” Federal Bureau of Investigation, https://www.fbi.gov/ about-us/
cjis/ucr/nibrs/2012/resources/ nibrs-participation-by-state (a pdf file), accessed on September 18, 2015.
rate is the sum of murders, rapes, robberies, and aggravated assaults per 100,000
residents. These seven felony crimes (often referred to as the FBI’s “part 1” felony
offenses) provide the standard categorization of serious offenses in the United
States. Both series show peaks in 1991. While there are some doubts about whether
the UCR-measured increase in property crime during the late 1980s captures an
actual rise in crime or trends in crime reporting by both victims and agencies
participating in the UCR (Boggess and Bound 1997), the increase in serious violent
crime—and homicide in particular—beginning around 1985 is a well-documented
fact (Blumstein and Rosenfeld 1998). Figure 1 also reveals very large declines in
crime rates from 1991 on. Violent crime rates dropped by more than half over this
period, while property crime rates fell by nearly half. As we will see shortly, victimiza-
tion statistics reveal very similar overall patterns.
One cannot use the historical data from the Uniform Crime Reports to explore
in a direct way how crime rates as experienced by different socioeconomic groups
have changed over time. For the most part, the data are summarized at the law
enforcement agency level with little micro-level information on specific criminal
incidents.2 However, police agencies tend to correspond geographically with incor-
porated cities, and cities vary considerably with respect to average socioeconomic
and demographic characteristics. Hence, one can assess the incidence of the crime
decline by examining the relationship between changes in crime rates across cities
with different socioeconomic characteristics.
Figures 2 and 3 present such an analysis for the years 1990 and 2008 based on
the data set produced by Kneebone and Raphael (2011). The data describe crime
rates and demographic characteristics for the roughly 5,400 cities located within the
nation’s 100 largest US metropolitan areas. Figure 2 groups the cities covered by
these data into deciles by the proportion of city residents that are African-American
in 2000, and displays the average violent and property crime rates for each group
for 1990 and 2008 (decile breaks are tabulated weighting by total 2000 city popu-
lation). Figure 3 presents comparable results when cities are stratified by deciles
according to the proportion of city residents that are below the poverty line (again
weighted by the 2000 total population).
Property crime rates and violent crime rates are notably higher in cities where
a higher proportion of residents are African-American in both years. In addition,
crime rates are declining across all deciles. However, the figure reveals larger abso-
lute drops in cities with proportionally larger African-American population. While
the ratio of crime rates in decile 10 to crime rates in decile 1 actually increase slightly
between 1990 and 2008, the absolute differences in crime rates narrow considerably.
For example, the average violent crime rate in tenth-decile cities in 1990 exceeded
2The Uniform Crime Reports is slowly shifting towards the National Incident Based Reporting System
(NIBRS), which includes detailed micro-level information on specific criminal incidents. As of 2012,
agencies covering roughly 30 percent of the US population report criminal incidents through the NIBRS.
See 2012 “NIBRS Participation by State,” Federal Bureau of Investigation, https://www.fbi.gov/ about-us/
cjis/ucr/nibrs/2012/resources/ nibrs-participation-by-state (a pdf file), accessed on September 18, 2015.
Paraphrase This Document
Need a fresh take? Get an instant paraphrase of this document with our AI Paraphraser
Crime, the Criminal Justice System, and Socioeconomic Inequality 1
Figure 2
Relationship between Violent and Property Crime and Deciles of the Distribu
of the Proportion of City Residents African-American in 2000
Source: Authors using data from Uniform Crime Reports, and US Census Bureau’s decennial censu
and American Community Surveys. The data covers roughly 5,400 cities located within the nation’s 100
largest US metropolitan areas.
Notes: Cities covered by these data are grouped into deciles by the proportion of city residents that are
African-American in 2000, and the figure displays the average violent and property crime rates for each
group for 1990 and 2008 (decile breaks are tabulated weighting by total 2000 city population). T
dotted lines above and below the solid lines represent the 95 percent confidence interval.
A: Violent crime rate per 100,000B: Property crime rate per 100,000
1990
2008
0
500
1,000
1,500
2,000
Average violent crime rate
0 2 4 6 8 10
Decile, proportion
African American
1990
2008
2,000
4,000
6,000
8,000
Average property crime rate
0 2 4 6 8 10
Decile, proportion
African American
Figure 3
Relationship between Violent and Property Crime and Deciles of the Distribu
of the 2000 Proportion of City Residents in Poverty
Source: See Figure 2.
Notes: Cities covered by these data are grouped into deciles according to the proportion of city residents
that are below the poverty line in 2000, and the figure displays the average violent and property crime ra
for each group for 1990 and 2008. (Decile breaks are tabulated weighting by total 2000 city population).
The dotted lines above and below the solid lines represent the 95 percent confidence interval.
1990
2008
0
500
1,000
1,500
2,000
Average violent crime rate
0 2 4 6 8 10
Decile, proportion poor
1990
2008
2,000
4,000
6,000
8,000
10,000
Average property crime rate
0 2 4 6 8 10
Decile, proportion poor
A: Violent crime rate per 100,000B: Property crime rate per 100,000
108 Journal of Economic Perspectives
that of first-decile cities by 1,498 per 100,000. By 2008, this difference shrinks to
1,045 per 100,000. The comparable differences for property crime rates are 5,179
per 100,000 in 1990 and 3,495 per 100,000 in 2008.
Figure 3 reveals comparable changes in the relationship between city-level
poverty rates andcity-level crime rates. Again, in both years, crime rates are appre-
ciably higher in cities in which a higher share of the population was below the
poverty line, and the drop in crime over time is apparent. However, the inequality
between cities with the highest and lower poverty rates narrows considerably over
this 18-year period. Here we observe a narrowing of both the ratio of crime rates
as well as the absolute difference. Expressed as a ratio, the 1990 violent crime rate
among the cities in the top poverty decile was 15.8 times the rate for the cities in the
lowest poverty decile. By 2008, the ratio falls to 11.9. When expressed in levels, in
1990 the violent crime rate in the cities in the upper decile for poverty rates exceeds
the violent crime rate in cities in the lowest decile for poverty rates by 1,860 inci-
dents per 100,000. By 2008, the absolute difference in violent crime rates shrinks to
941 per 100,000. We see comparable narrowing in the differences between poorer
and less-poor cities in property crime rates.
Within cities, crime tends to be geographically concentrated in poorer neigh-
borhoods with proportionally larger minority populations. In recent years, many
police departments have begun to make public geo-coded incident-level data
permitting analysis of more granular geographic inequality in crime rates. However,
official crimes and clearances collected under the Uniform Crime Reports are only
summarized at the agency level. We are not aware of a national data source that
provides geographically disaggregated crime data for the time period corresponding
to the great crime decline.3 Cohen and Gorr (2006), however, have assembled
data on crime counts by census tract for the cities of Pittsburgh, Pennsylvania, and
Rochester, New York, covering the period 1990 through 2001. Here we employ the
data for Pittsburgh to assess whether thecross-city difference in the crime declines
observed in Figures 2 and 3 are also evident at a more geographically disaggregated
level. Over this time period, total violent crimes reported to the Pittsburgh police
decline by 34 percent while total property crimes reported fall by 44 percent. Over
this time period, Pittsburgh’s population declines by roughly 10 percent. Hence,
the period in time corresponds to an appreciable decline in crime rates.
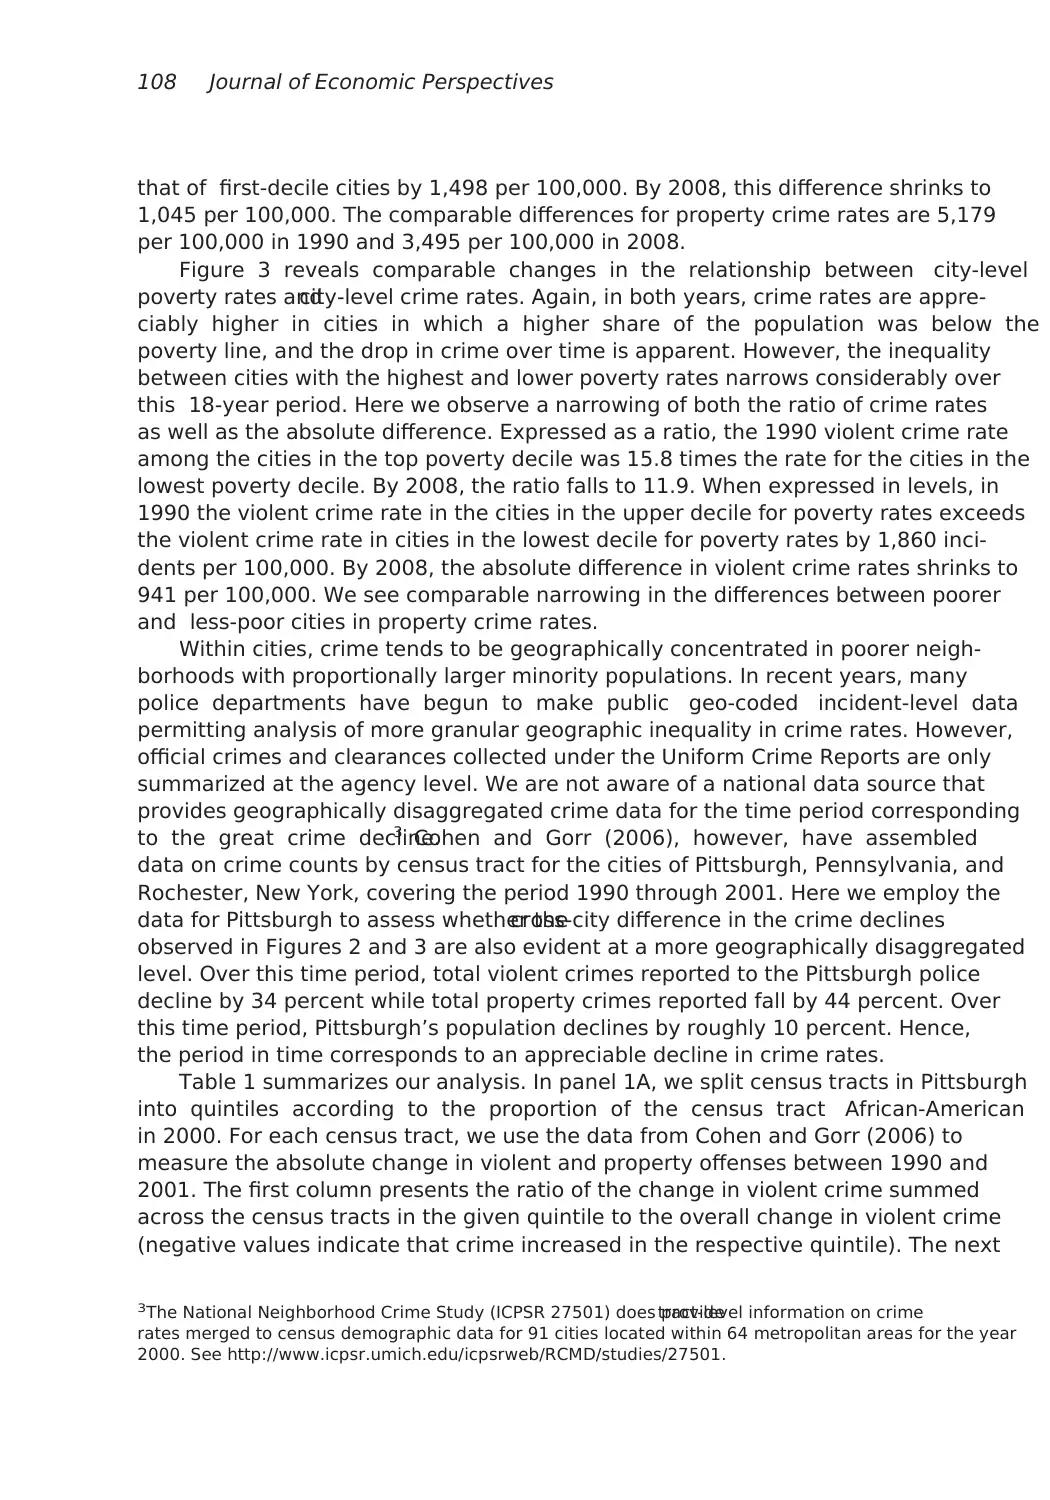
Table 1 summarizes our analysis. In panel 1A, we split census tracts in Pittsburgh
into quintiles according to the proportion of the census tract African-American
in 2000. For each census tract, we use the data from Cohen and Gorr (2006) to
measure the absolute change in violent and property offenses between 1990 and
2001. The first column presents the ratio of the change in violent crime summed
across the census tracts in the given quintile to the overall change in violent crime
(negative values indicate that crime increased in the respective quintile). The next
3The National Neighborhood Crime Study (ICPSR 27501) does providetract-level information on crime
rates merged to census demographic data for 91 cities located within 64 metropolitan areas for the year
2000. See http://www.icpsr.umich.edu/icpsrweb/RCMD/studies/27501.
that of first-decile cities by 1,498 per 100,000. By 2008, this difference shrinks to
1,045 per 100,000. The comparable differences for property crime rates are 5,179
per 100,000 in 1990 and 3,495 per 100,000 in 2008.
Figure 3 reveals comparable changes in the relationship between city-level
poverty rates andcity-level crime rates. Again, in both years, crime rates are appre-
ciably higher in cities in which a higher share of the population was below the
poverty line, and the drop in crime over time is apparent. However, the inequality
between cities with the highest and lower poverty rates narrows considerably over
this 18-year period. Here we observe a narrowing of both the ratio of crime rates
as well as the absolute difference. Expressed as a ratio, the 1990 violent crime rate
among the cities in the top poverty decile was 15.8 times the rate for the cities in the
lowest poverty decile. By 2008, the ratio falls to 11.9. When expressed in levels, in
1990 the violent crime rate in the cities in the upper decile for poverty rates exceeds
the violent crime rate in cities in the lowest decile for poverty rates by 1,860 inci-
dents per 100,000. By 2008, the absolute difference in violent crime rates shrinks to
941 per 100,000. We see comparable narrowing in the differences between poorer
and less-poor cities in property crime rates.
Within cities, crime tends to be geographically concentrated in poorer neigh-
borhoods with proportionally larger minority populations. In recent years, many
police departments have begun to make public geo-coded incident-level data
permitting analysis of more granular geographic inequality in crime rates. However,
official crimes and clearances collected under the Uniform Crime Reports are only
summarized at the agency level. We are not aware of a national data source that
provides geographically disaggregated crime data for the time period corresponding
to the great crime decline.3 Cohen and Gorr (2006), however, have assembled
data on crime counts by census tract for the cities of Pittsburgh, Pennsylvania, and
Rochester, New York, covering the period 1990 through 2001. Here we employ the
data for Pittsburgh to assess whether thecross-city difference in the crime declines
observed in Figures 2 and 3 are also evident at a more geographically disaggregated
level. Over this time period, total violent crimes reported to the Pittsburgh police
decline by 34 percent while total property crimes reported fall by 44 percent. Over
this time period, Pittsburgh’s population declines by roughly 10 percent. Hence,
the period in time corresponds to an appreciable decline in crime rates.
Table 1 summarizes our analysis. In panel 1A, we split census tracts in Pittsburgh
into quintiles according to the proportion of the census tract African-American
in 2000. For each census tract, we use the data from Cohen and Gorr (2006) to
measure the absolute change in violent and property offenses between 1990 and
2001. The first column presents the ratio of the change in violent crime summed
across the census tracts in the given quintile to the overall change in violent crime
(negative values indicate that crime increased in the respective quintile). The next
3The National Neighborhood Crime Study (ICPSR 27501) does providetract-level information on crime
rates merged to census demographic data for 91 cities located within 64 metropolitan areas for the year
2000. See http://www.icpsr.umich.edu/icpsrweb/RCMD/studies/27501.
⊘ This is a preview!⊘
Do you want full access?
Subscribe today to unlock all pages.
Trusted by 1+ million students worldwide
Magnus Lofstrom and Steven Raphael 109
column presents similar tabulations for property crime. The third column shows the
proportion of the city’s population in 2000 in each tract group while the final two
columns show the proportion African-American and the proportion poor in each
group. Panel 1B produces a similar analysis where census tracts are stratified into
quintiles according to the proportion of tract residents that are below the poverty
line in the 2000 census.
The table reveals a very geographically concentrated crime decline within the
city of Pittsburgh. The decline in violent crime in the 20 percent of tracts with the
highest proportion black amounts to 54 percent of the overall decline in violent
crime citywide. These tracts account for 23 percent of the city’s population, have
an average proportion black among tract residents of 0.78 and an average propor-
tion poor of 0.32. Similarly, the decline in violent crime in the poorest quintile
of tracts amounts to 60 percent of the citywide decline in violent crime incidents,
despite these tracts being home to only 17 percent of the city’s population. The
Table 1
Distribution of the Decline in Crime in Pittsburgh, Pennsylvania, between 19
and 2001 by Census Tract Racial Composition and Poverty Rates
Panel A: Distribution by tracts stratified by quintiles according to the proportion of neighborhood
residents that are African American in 2000
Quintile of
proportion
black
Ratio of total
violent crime
decline in quintile
to overall decline
in the city
Ratio of total
property crime
decline in quintile
to overall decline
in the city
Proportion of
2000 resident
population
Proportion
black
Proportion
poor
Q1 –0.01 0.07 0.17 0.05 0.15
Q2 0.03 0.17 0.18 0.10 0.16
Q3 0.12 0.18 0.24 0.17 0.19
Q4 0.31 0.23 0.19 0.47 0.29
Q5 0.54 0.34 0.23 0.78 0.32
Panel B: Distribution by tracts stratified by quintiles according to the proportion of neighborhood
residents that are poor in 2000
Quintile of
proportion
poor
Ratio of total
violent crime
decline in quintile
to overall decline
in the city
Ratio of total
property crime
decline in quintile
to overall decline
in the city
Proportion of
2000 resident
population
Proportion
black
Proportion
poor
Q1 0.07 0.14 0.21 0.08 0.06
Q2 –0.01 0.12 0.23 0.17 0.12
Q3 0.04 0.14 0.20 0.23 0.18
Q4 0.30 0.29 0.19 0.42 0.27
Q5 0.60 0.31 0.17 0.67 0.47
Source: Authors using population data from the 2000 Census summary tape files 1 and 3A, and crime data
from Cohen and Gorr (2006).
Paraphrase This Document
Need a fresh take? Get an instant paraphrase of this document with our AI Paraphraser
110 Journal of Economic Perspectives
violent crime declines are considerably smaller in tracts with smaller proportions
African-American and smaller proportion poor. Interestingly, while the decline in
property crime is also skewed towards poorer and more minority census tracts, the
geographic incidence of this decline is more even across the city’s neighborhoods.4
Ideally, we would like to analyze trends in individual orhousehold-level victim-
ization rates for different income groups, such as quintiles of the household income
distribution. Unfortunately, the income variable in the National Crime Victimiza-
tion Statistics only reports household income ranges. Moreover, the nominal values
of this variable are coded similarly over time, making it quite difficult to consis-
tently subdivide the income distribution as nominal income increases with inflation.
However, we can use the NCVS data on race/ethnicity to assess whether the cross-city
patterns that we have documented (as well as the within-city patterns for Pittsburgh)
are consistent with interpersonal victimization differentials.
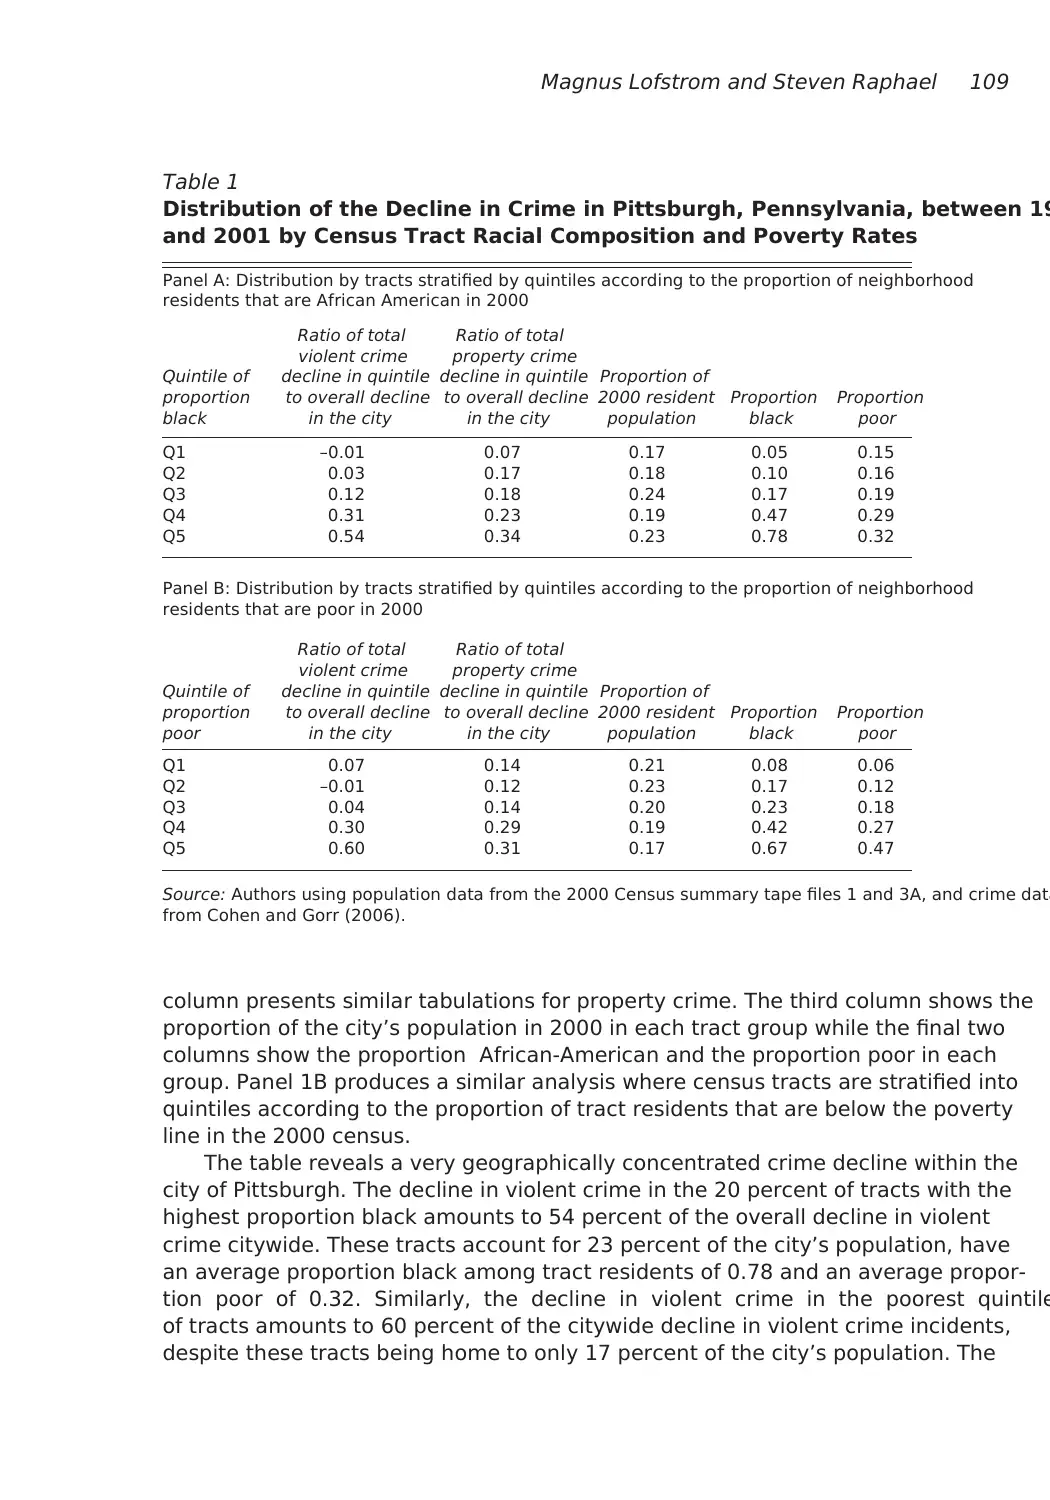
Figure 4 presentsthe violent and property crime victimizationrates by
race/ethnicity for the period 1993 through 2013. For property crime, rates are
4The crime decline since the early 1990s has also considerably narrowed the difference in crime rates
between the national central cities and suburbs (Kneebone and Raphael 2011).
Figure 4
Violent Victimization and Property Victimizations by Race/Ethnicity, 1993 thro
2013
Source: Authors using data from the National Crime Victimization Statistics.
Notes: Property crime, rates are expressed per 1,000 households according to the race of the household
head. The serious violent victimization rate is measured per 1,000 residents 12 years of age and over and
excludes homicide.
A: Violent victimizations excluding homicides
(per 1,000 US residents 12 and over)
B: Property victimizations
(per 1,000 households)
Gian: In the key, please Change "hispanicproperty" to "Hispanic" Also, it is probably better to use 1
key for the two panels.
10
20
30
40
50
1995 2000 2005 2010 2015
Non-Hispanic Black Hispanic
Non-Hispanic White
100
200
300
400
500
1995 2000 2005 2010 2015
violent crime declines are considerably smaller in tracts with smaller proportions
African-American and smaller proportion poor. Interestingly, while the decline in
property crime is also skewed towards poorer and more minority census tracts, the
geographic incidence of this decline is more even across the city’s neighborhoods.4
Ideally, we would like to analyze trends in individual orhousehold-level victim-
ization rates for different income groups, such as quintiles of the household income
distribution. Unfortunately, the income variable in the National Crime Victimiza-
tion Statistics only reports household income ranges. Moreover, the nominal values
of this variable are coded similarly over time, making it quite difficult to consis-
tently subdivide the income distribution as nominal income increases with inflation.
However, we can use the NCVS data on race/ethnicity to assess whether the cross-city
patterns that we have documented (as well as the within-city patterns for Pittsburgh)
are consistent with interpersonal victimization differentials.
Figure 4 presentsthe violent and property crime victimizationrates by
race/ethnicity for the period 1993 through 2013. For property crime, rates are
4The crime decline since the early 1990s has also considerably narrowed the difference in crime rates
between the national central cities and suburbs (Kneebone and Raphael 2011).
Figure 4
Violent Victimization and Property Victimizations by Race/Ethnicity, 1993 thro
2013
Source: Authors using data from the National Crime Victimization Statistics.
Notes: Property crime, rates are expressed per 1,000 households according to the race of the household
head. The serious violent victimization rate is measured per 1,000 residents 12 years of age and over and
excludes homicide.
A: Violent victimizations excluding homicides
(per 1,000 US residents 12 and over)
B: Property victimizations
(per 1,000 households)
Gian: In the key, please Change "hispanicproperty" to "Hispanic" Also, it is probably better to use 1
key for the two panels.
10
20
30
40
50
1995 2000 2005 2010 2015
Non-Hispanic Black Hispanic
Non-Hispanic White
100
200
300
400
500
1995 2000 2005 2010 2015
Crime, the Criminal Justice System, and Socioeconomic Inequality 1
expressed per 1,000 households according to the race of the household head. The
serious violent victimization rate is measured per 1,000 residents 12 years of age and
over and excludes homicide. The patterns in Figure 4 confirm ourcross-city and
limited within-city analysis. Victimization rates decline sharply for all race/ethnic
groups. However, the absolute and relative declines are largest for African-American
and Hispanics. Given the average income differentials and differences in poverty
rates between whites, Hispanics, andAfrican-Americans, these results strongly indi-
cate thatlower-income households experienced disproportionately large reductions
in criminal victimization since the beginning of the crime decline.
The most pronounced disparities in criminal victimization in the United States
are found in homicide rates. There are enormous interracial disparities in homi-
cide, with very strong interactions between gender and age. While these disparities
are evident in all years with recorded data (O’Flaherty and Sethi 2010), they change
drastically over time with shocks to drug markets and broader trends in crime rates.
In 2008, the black homicide rate of 19.6 per 100,000 was nearly six times the white
homicide rate (3.3 per 100,000). In 1991, at the peak of the run-up in black homi-
cide rates beginning in 1986, the black homicide rate of 39.4 per 100,000 was over
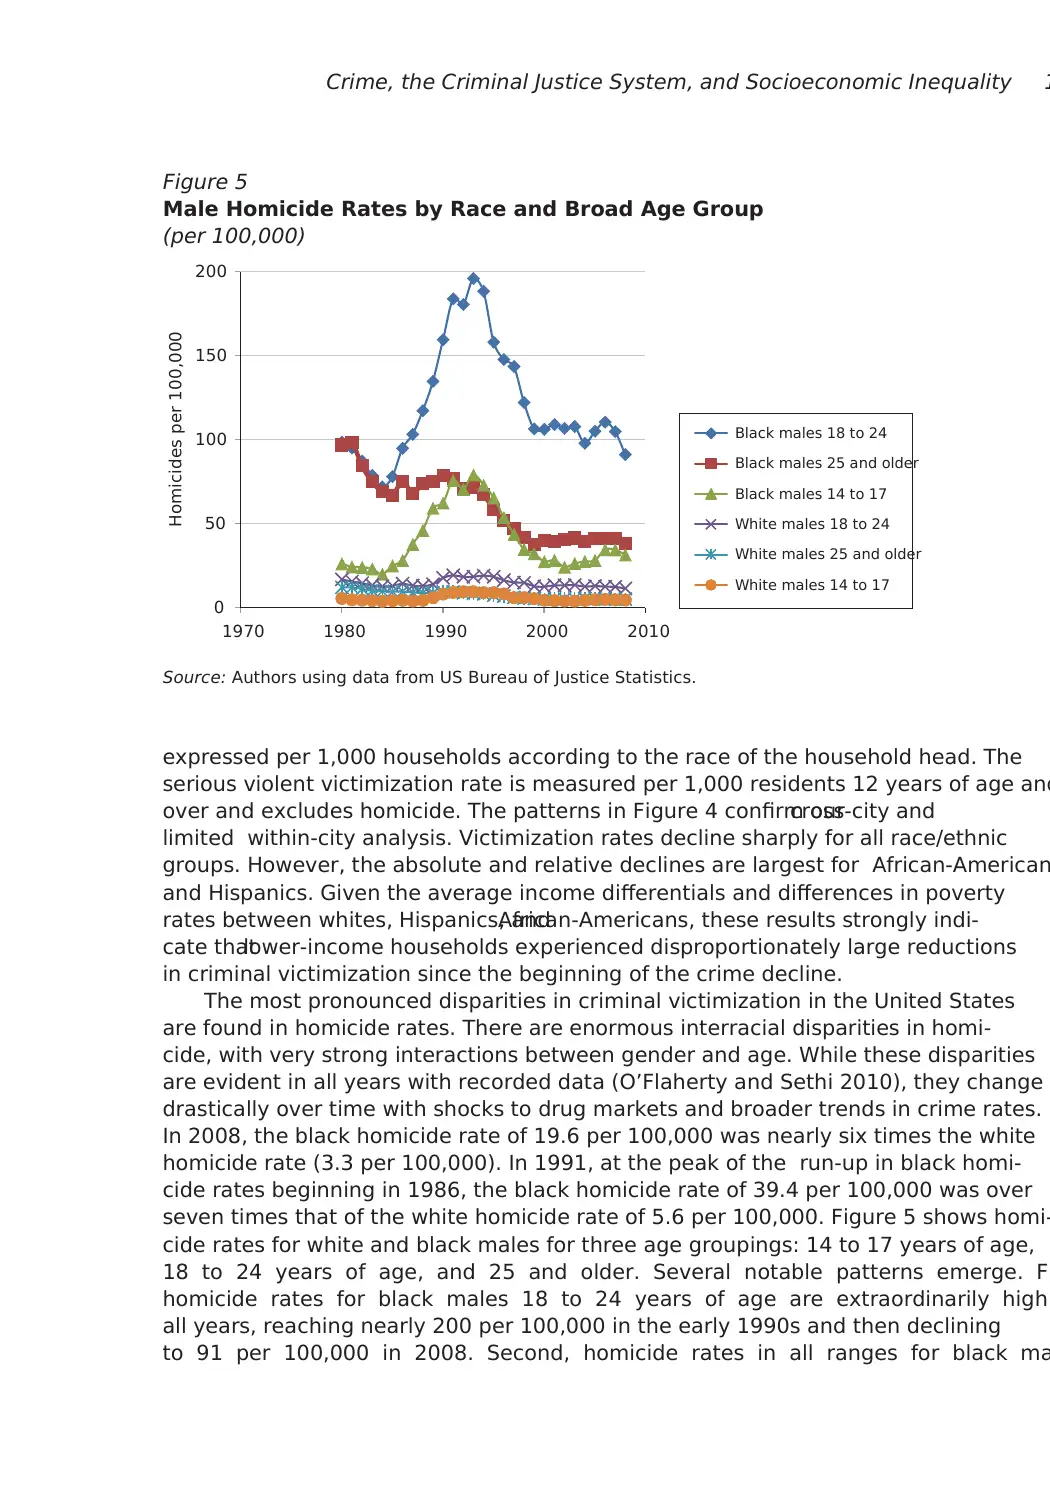
seven times that of the white homicide rate of 5.6 per 100,000. Figure 5 shows homi-
cide rates for white and black males for three age groupings: 14 to 17 years of age,
18 to 24 years of age, and 25 and older. Several notable patterns emerge. Fi
homicide rates for black males 18 to 24 years of age are extraordinarily high
all years, reaching nearly 200 per 100,000 in the early 1990s and then declining
to 91 per 100,000 in 2008. Second, homicide rates in all ranges for black ma
Figure 5
Male Homicide Rates by Race and Broad Age Group
(per 100,000)
Source: Authors using data from US Bureau of Justice Statistics.
0
50
100
150
200
1970 1980 1990 2000 2010
Black males 18 to 24
Black males 25 and older
Black males 14 to 17
White males 18 to 24
White males 25 and older
White males 14 to 17
Homicides per 100,000
expressed per 1,000 households according to the race of the household head. The
serious violent victimization rate is measured per 1,000 residents 12 years of age and
over and excludes homicide. The patterns in Figure 4 confirm ourcross-city and
limited within-city analysis. Victimization rates decline sharply for all race/ethnic
groups. However, the absolute and relative declines are largest for African-American
and Hispanics. Given the average income differentials and differences in poverty
rates between whites, Hispanics, andAfrican-Americans, these results strongly indi-
cate thatlower-income households experienced disproportionately large reductions
in criminal victimization since the beginning of the crime decline.
The most pronounced disparities in criminal victimization in the United States
are found in homicide rates. There are enormous interracial disparities in homi-
cide, with very strong interactions between gender and age. While these disparities
are evident in all years with recorded data (O’Flaherty and Sethi 2010), they change
drastically over time with shocks to drug markets and broader trends in crime rates.
In 2008, the black homicide rate of 19.6 per 100,000 was nearly six times the white
homicide rate (3.3 per 100,000). In 1991, at the peak of the run-up in black homi-
cide rates beginning in 1986, the black homicide rate of 39.4 per 100,000 was over
seven times that of the white homicide rate of 5.6 per 100,000. Figure 5 shows homi-
cide rates for white and black males for three age groupings: 14 to 17 years of age,
18 to 24 years of age, and 25 and older. Several notable patterns emerge. Fi
homicide rates for black males 18 to 24 years of age are extraordinarily high
all years, reaching nearly 200 per 100,000 in the early 1990s and then declining
to 91 per 100,000 in 2008. Second, homicide rates in all ranges for black ma
Figure 5
Male Homicide Rates by Race and Broad Age Group
(per 100,000)
Source: Authors using data from US Bureau of Justice Statistics.
0
50
100
150
200
1970 1980 1990 2000 2010
Black males 18 to 24
Black males 25 and older
Black males 14 to 17
White males 18 to 24
White males 25 and older
White males 14 to 17
Homicides per 100,000
⊘ This is a preview!⊘
Do you want full access?
Subscribe today to unlock all pages.
Trusted by 1+ million students worldwide
112 Journal of Economic Perspectives
exceed homicide rates for white males. Third, black male homicide rates have
fallen dramatically since the early 1990s, falling by half for males 18 and over and
by over 60 percent for 14 to 17 year-old black males. White male homicide rates also
dropped by roughly 40 to 50 percent, but from a much lower base.
Despite the decline in homicide rates since 1991, the homicide rates currently
experienced by black males in the United States remain stunningly high. Under-
standing and addressing the high homicide rates for African-American males
constitutes one of the most important criminal justice problems faced by the United
States.
Inequality in the Incidence of the Direct and Indirect Costs of
Punishment
The operation of the US criminal justice system is costly. For example, Anderson
(2012) estimates annual US criminal justice expenditures circa 2010 of roughly $113
billion on police, $81 billion on corrections, $76 billion in expenditure by various
federal agencies, and $84 billion devoted to combating drug trafficking. Beyond
expenditures, criminal justice enforcement imposes costs on those convicted of
crimes, their family members, and their communities. Some of these social costs
are the direct and intended result of punishment, while others are indirect and
unintended. For example, the forced removal from noninstitutionalized society
associated with incarceration or the restrictions on liberties associated with a proba-
tion term are the direct and intended consequences.5 The material deprivation
of family members associated with losing an adult earner represent costs that are
indirect and unintended. The prevalence and magnitude of thesehard-to-measure
direct and indirect social costs have increased and in an unequal manner over the
past four decades. This has disproportionately affected poor minority communities,
and in particular African-American men.
Before proceeding, a few institutional definitions regarding US corrections
practices are in order. “Prisons” generally house those who are convicted of felonies
and sentenced to serve at least one year. “Jails” house individuals awaiting arraign-
ment and or trial, or those who are sentenced to relatively short incarceration
spells. Many who are convicted of both felonies and misdemeanors are sentenced
to probation in lieu of incarceration, or sometimes in combination with a short
5To be clear, the fact that consequences are intended does not imply that they are socially optimal
Assessing the optimality of a given set of sentencing practices requires the articulation of a set of norma-
tive principals governing sentencing policy. For example, the recent National Academies of Science study
of US incarceration rates articulated a normative framework for sentencing reform based on proportion-
ality, procedural fairness, recognition of the possibilities for redemption and other deontological criteria
stressing human rights and common citizenship (Travis, Western, and Redburn 2014). Alternatively, one
may specify a more consequentialist position whereby the value of crime prevention net of enforcement
costs defines the objective. In both frameworks, the direct effects of punishment associated with a given
set of sentencing practices can be either too little or excessive.
Paraphrase This Document
Need a fresh take? Get an instant paraphrase of this document with our AI Paraphraser
Magnus Lofstrom and Steven Raphael 113
jail sentence. Individuals on probation are monitored in the community with the
degrees of stringency often depending on risk assessments conducted by local proba
tion departments. Probation may be revoked for noncompliance with the conditions
of probation, a legal action that can result in a jail or prison term. Finally, most prison
releases are conditional from prison to a parole term. Paroled individuals are techni-
cally still under the custody of the state department of corrections and can have their
conditional release revoked for technical reasons (missing appointments, leaving the
county, testing positive for drugs) or for committing new crimes (Petersilia 1998).
Because each US state has its own penal code, sentencing structure, and department
of corrections, sentencing and correctional practices vary appreciably across states.
Within states, each county has its own district attorney, sheriff’s department (in charg
of county jails), and probation departments, with practices varying widely across coun
ties within states. In addition, there is a federal prison system for those who commit
federal felony offenses and a separate system for processing federal cases.
Starting in the 1970s, federal and state jurisdictions across the United States
toughened sentencing practices. Several underlying patterns are key to under-
standing the effects of these changes in practice. First, for the most serious crimes,
we do not observe an increase in arrest rates or the number of arrests per crime. The
one exception concerns drug arrests, where there is a pronounced increase in drug
arrest rates starting in the mid-1980s that has been sustained through the present.
Second, conditional on being arrested for a crime, the likelihood of being admitted
to prison has increased for all offenses, especially those offenses for which the like-
lihood of being admitted to prison conditional on an arrest was low in years past
(Neal and Rick 2015; Raphael and Stoll 2013; Travis, Western, and Redburn 2014).
Third, effective sentence lengths (that is, the ultimate time served) within crime
categories have gotten longer (Raphael and Stoll 2009, 2013; Neal and Rick 2015;
Travis, Western, and Redburn 2014). This is especially true for the most seriou
crimes with a high likelihood of being admitted to prison upon conviction, such as
murder, robbery, or rape/sexual assault. However, it is also observed forless-serious
crimes. Finally, nearly all of the growth since 1980 can be explained by tough
sentences involving both more frequent use of prisons to punish felony offenses, as
well as longer expected time served either conditional on conviction (Neal and Rick
2015) or conditional on prison admission (Raphael and Stoll 2013).
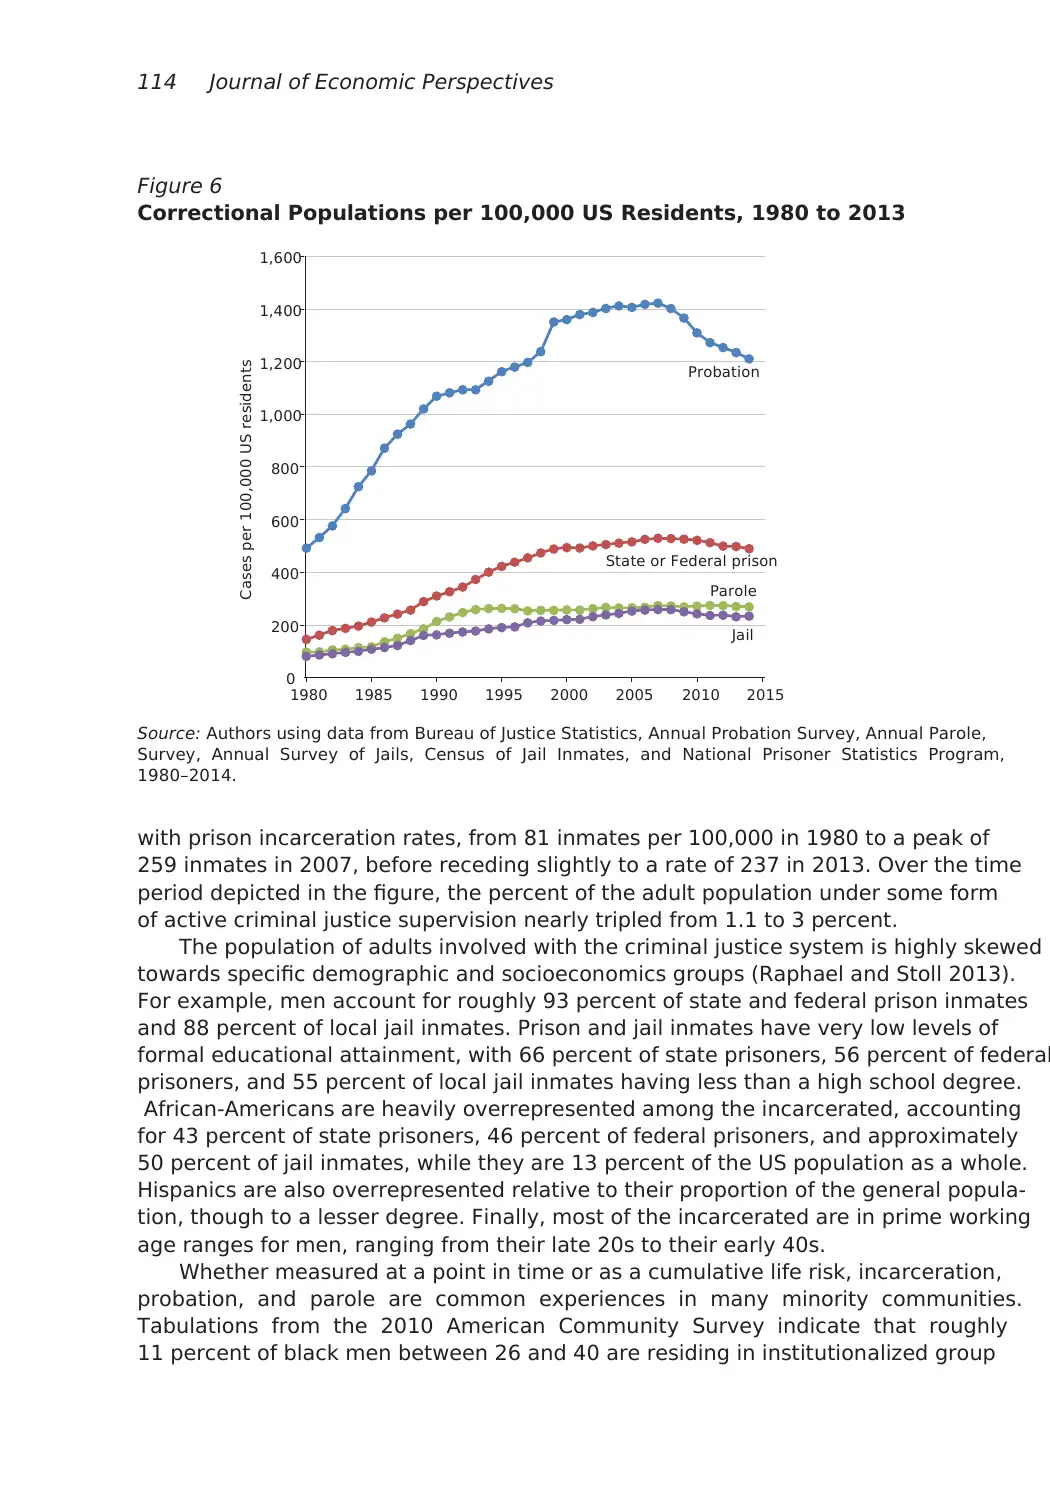
These changes have greatly expanded the reach of the criminal justice system,
such that the proportion of American residents involved with the criminal justice
system has reached historic highs. Figure 6 presents time series for various correc-
tional populations, all expressed per 100,000 US residents. Between 1980 and
2013, all rates increased dramatically. The probation caseload is the largest in
any given year, with roughly 500 per 100,000 on probation in 1980, expanding to
over 1,200 per 100,000 in 2013. Between 1980 and 2007, the number of inmates
in a state or federal prison increased from 145 per 100,000 to 530 per 100,0
In recent years, the prison incarceration rate has receded somewhat, in large part
due to policy reforms in California, the state with thesecond-largest prison system
in the country following the federal system. Jail incarceration rates have increased
jail sentence. Individuals on probation are monitored in the community with the
degrees of stringency often depending on risk assessments conducted by local proba
tion departments. Probation may be revoked for noncompliance with the conditions
of probation, a legal action that can result in a jail or prison term. Finally, most prison
releases are conditional from prison to a parole term. Paroled individuals are techni-
cally still under the custody of the state department of corrections and can have their
conditional release revoked for technical reasons (missing appointments, leaving the
county, testing positive for drugs) or for committing new crimes (Petersilia 1998).
Because each US state has its own penal code, sentencing structure, and department
of corrections, sentencing and correctional practices vary appreciably across states.
Within states, each county has its own district attorney, sheriff’s department (in charg
of county jails), and probation departments, with practices varying widely across coun
ties within states. In addition, there is a federal prison system for those who commit
federal felony offenses and a separate system for processing federal cases.
Starting in the 1970s, federal and state jurisdictions across the United States
toughened sentencing practices. Several underlying patterns are key to under-
standing the effects of these changes in practice. First, for the most serious crimes,
we do not observe an increase in arrest rates or the number of arrests per crime. The
one exception concerns drug arrests, where there is a pronounced increase in drug
arrest rates starting in the mid-1980s that has been sustained through the present.
Second, conditional on being arrested for a crime, the likelihood of being admitted
to prison has increased for all offenses, especially those offenses for which the like-
lihood of being admitted to prison conditional on an arrest was low in years past
(Neal and Rick 2015; Raphael and Stoll 2013; Travis, Western, and Redburn 2014).
Third, effective sentence lengths (that is, the ultimate time served) within crime
categories have gotten longer (Raphael and Stoll 2009, 2013; Neal and Rick 2015;
Travis, Western, and Redburn 2014). This is especially true for the most seriou
crimes with a high likelihood of being admitted to prison upon conviction, such as
murder, robbery, or rape/sexual assault. However, it is also observed forless-serious
crimes. Finally, nearly all of the growth since 1980 can be explained by tough
sentences involving both more frequent use of prisons to punish felony offenses, as
well as longer expected time served either conditional on conviction (Neal and Rick
2015) or conditional on prison admission (Raphael and Stoll 2013).
These changes have greatly expanded the reach of the criminal justice system,
such that the proportion of American residents involved with the criminal justice
system has reached historic highs. Figure 6 presents time series for various correc-
tional populations, all expressed per 100,000 US residents. Between 1980 and
2013, all rates increased dramatically. The probation caseload is the largest in
any given year, with roughly 500 per 100,000 on probation in 1980, expanding to
over 1,200 per 100,000 in 2013. Between 1980 and 2007, the number of inmates
in a state or federal prison increased from 145 per 100,000 to 530 per 100,0
In recent years, the prison incarceration rate has receded somewhat, in large part
due to policy reforms in California, the state with thesecond-largest prison system
in the country following the federal system. Jail incarceration rates have increased
114 Journal of Economic Perspectives
with prison incarceration rates, from 81 inmates per 100,000 in 1980 to a peak of
259 inmates in 2007, before receding slightly to a rate of 237 in 2013. Over the time
period depicted in the figure, the percent of the adult population under some form
of active criminal justice supervision nearly tripled from 1.1 to 3 percent.
The population of adults involved with the criminal justice system is highly skewed
towards specific demographic and socioeconomics groups (Raphael and Stoll 2013).
For example, men account for roughly 93 percent of state and federal prison inmates
and 88 percent of local jail inmates. Prison and jail inmates have very low levels of
formal educational attainment, with 66 percent of state prisoners, 56 percent of federal
prisoners, and 55 percent of local jail inmates having less than a high school degree.
African-Americans are heavily overrepresented among the incarcerated, accounting
for 43 percent of state prisoners, 46 percent of federal prisoners, and approximately
50 percent of jail inmates, while they are 13 percent of the US population as a whole.
Hispanics are also overrepresented relative to their proportion of the general popula-
tion, though to a lesser degree. Finally, most of the incarcerated are in prime working
age ranges for men, ranging from their late 20s to their early 40s.
Whether measured at a point in time or as a cumulative life risk, incarceration,
probation, and parole are common experiences in many minority communities.
Tabulations from the 2010 American Community Survey indicate that roughly
11 percent of black men between 26 and 40 are residing in institutionalized group
Figure 6
Correctional Populations per 100,000 US Residents, 1980 to 2013
Source: Authors using data from Bureau of Justice Statistics, Annual Probation Survey, Annual Parole,
Survey, Annual Survey of Jails, Census of Jail Inmates, and National Prisoner Statistics Program,
1980–2014.
0
200
400
600
800
1,000
1,200
1,400
1,600
1980 1985 1990 1995 2000 2005 2010 2015
Cases per 100,000 US residents
Probation
State or Federal prison
Parole
Jail
⊘ This is a preview!⊘
Do you want full access?
Subscribe today to unlock all pages.
Trusted by 1+ million students worldwide
1 out of 24
Your All-in-One AI-Powered Toolkit for Academic Success.
+13062052269
info@desklib.com
Available 24*7 on WhatsApp / Email
![[object Object]](/_next/static/media/star-bottom.7253800d.svg)
Unlock your academic potential
Copyright © 2020–2026 A2Z Services. All Rights Reserved. Developed and managed by ZUCOL.