University Finance Report: CANN Group Limited Cost of Capital Analysis
VerifiedAdded on 2022/10/04
|14
|2969
|19
Report
AI Summary
This report provides a comprehensive financial analysis of CANN Group Limited, focusing on the determination of its weighted average cost of capital (WACC). The analysis begins with an introduction to CANN Group's business, which involves research into the medical benefits of cannabis. The report then details the assumptions made in the analysis, including market rate of return and risk-free rate, followed by the calculation of beta using both daily and monthly stock price data. The cost of equity is calculated using the Capital Asset Pricing Model (CAPM), and the cost of debt is determined based on the company's lease liability and financing costs. The cost of capital is then calculated, considering both market and book values of equity and debt. The report also explores capital structure theories and their relevance to CANN Group, and provides a detailed analysis of the company's gearing ratios. The report concludes by highlighting the issues encountered during the analysis, such as data limitations and assumptions, and offers recommendations for future financial planning. This report is a valuable resource for understanding the financial performance and capital structure of CANN Group Limited, providing insights for investment decisions and financial management.
Running head: CANN GROUP ANALYSIS
CANN Group Analysis
Name of the Student:
Name of the University:
Author Note:
CANN Group Analysis
Name of the Student:
Name of the University:
Author Note:
Paraphrase This Document
Need a fresh take? Get an instant paraphrase of this document with our AI Paraphraser
1CANN GROUP ANALYSIS
Executive Summary:
The cost of capital of a company is a factor which determines the minimum required return a
firm needs to earn to satisfy the stakeholders of the company. CANN Group Limited is a
company which is based on researching various medical benefits of cannabis to help medical
patients around the globe. The report consists of determination of the equity cost, debt cost
and ultimately the cost of capital of the organisation. The capital structure of the organisation
is analysed which involves analysing the level of financing and ownership of the firm. The
various capital structure theory are explained and justified in this report in regards to the
capital structure of the organisation. The gearing ratio of the company are calculated to
further provide a detailed and thorough analysis of the capital structure of the organisation.
2CANN GROUP ANALYSIS
Table of Contents
Introduction:...............................................................................................................................3
Discussion:.................................................................................................................................3
Assumption in the Analysis:..................................................................................................3
Calculation of Beta:................................................................................................................3
Cost of Equity:.......................................................................................................................4
Cost of Debt:..........................................................................................................................5
Cost of Capital:......................................................................................................................5
Capital Structure:...................................................................................................................7
Ratio:......................................................................................................................................7
Issues in the Analysis:............................................................................................................9
Conclusion:..............................................................................................................................10
Recommendation:....................................................................................................................10
References:...............................................................................................................................12
⊘ This is a preview!⊘
Do you want full access?
Subscribe today to unlock all pages.
Trusted by 1+ million students worldwide
3CANN GROUP ANALYSIS
Introduction:
The following report consists of the analysis of the company CANN Group Limited.
The company is based on providing and conducting research on the role of Cannabis for
medical benefits and its helpfulness to medical patients. The company was listed on the
Australian stock exchange on fifth may two thousand and seventeen. It is the first company
which conducts research on cannabis to be listed on the Australian stock exchange. The
purpose of this report is to calculate and evaluate the capital cost of the organisation using the
data provided in the annual report of the organisation. Also the various gearing ratio of the
company is calculated in the report to analyse the capital structure of the organisation. The
capital structure of the organisation is analysed with the various theory which are relevant to
the capital structure.
Discussion:
Assumption in the Analysis:
The analysis of the CANN Group Limited requires a series of assumptions to be
undertaken given in the following points,
The market rate of return to be taken to calculate the equity cost is taken as 7%
The risk free rate of the project is taken as 1.86% which the return of the 10 year
government bond.
The tax rate of the project is assumed to be 20% since the company has not paid any
taxes thus the tax rate which is effective in the company cannot be determined.
The market value of debt is assumed to be the book value of debt.
Paraphrase This Document
Need a fresh take? Get an instant paraphrase of this document with our AI Paraphraser
4CANN GROUP ANALYSIS
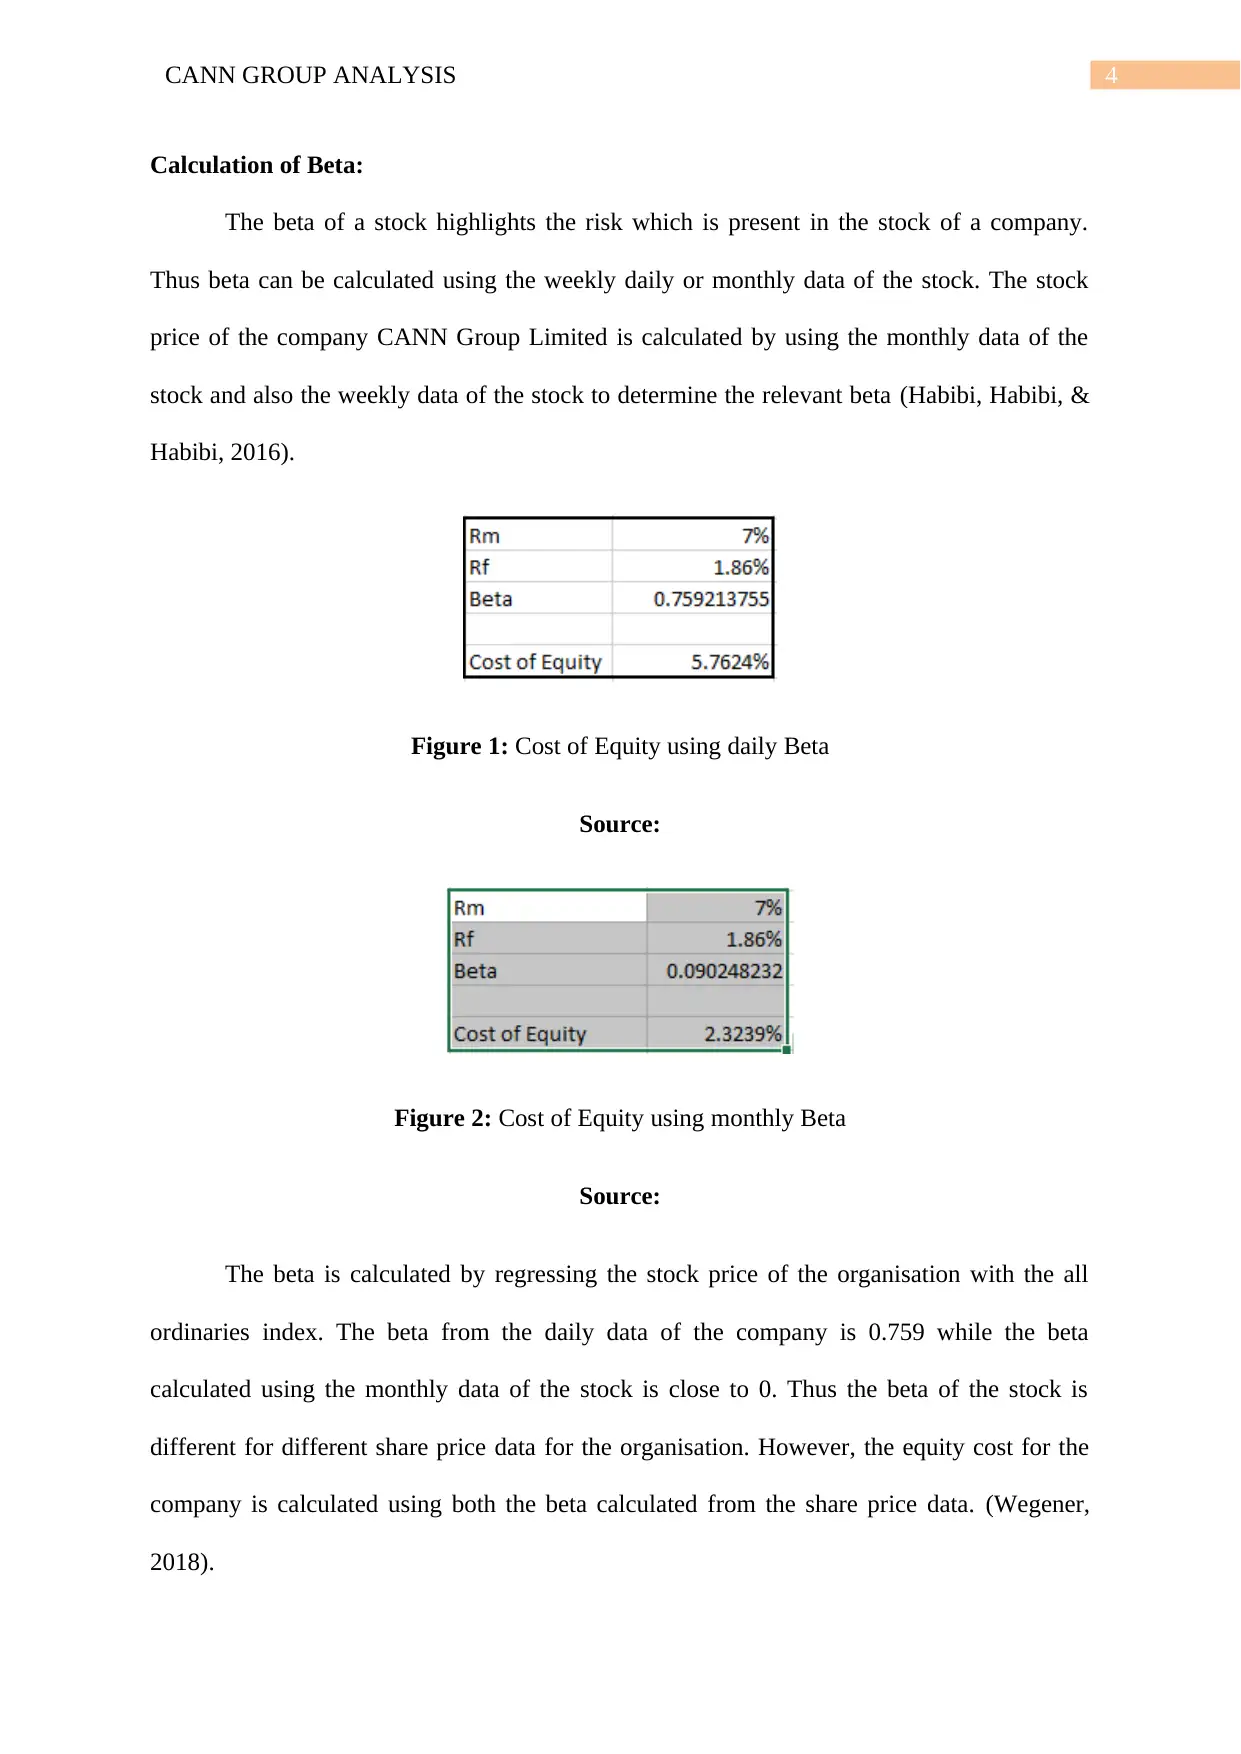
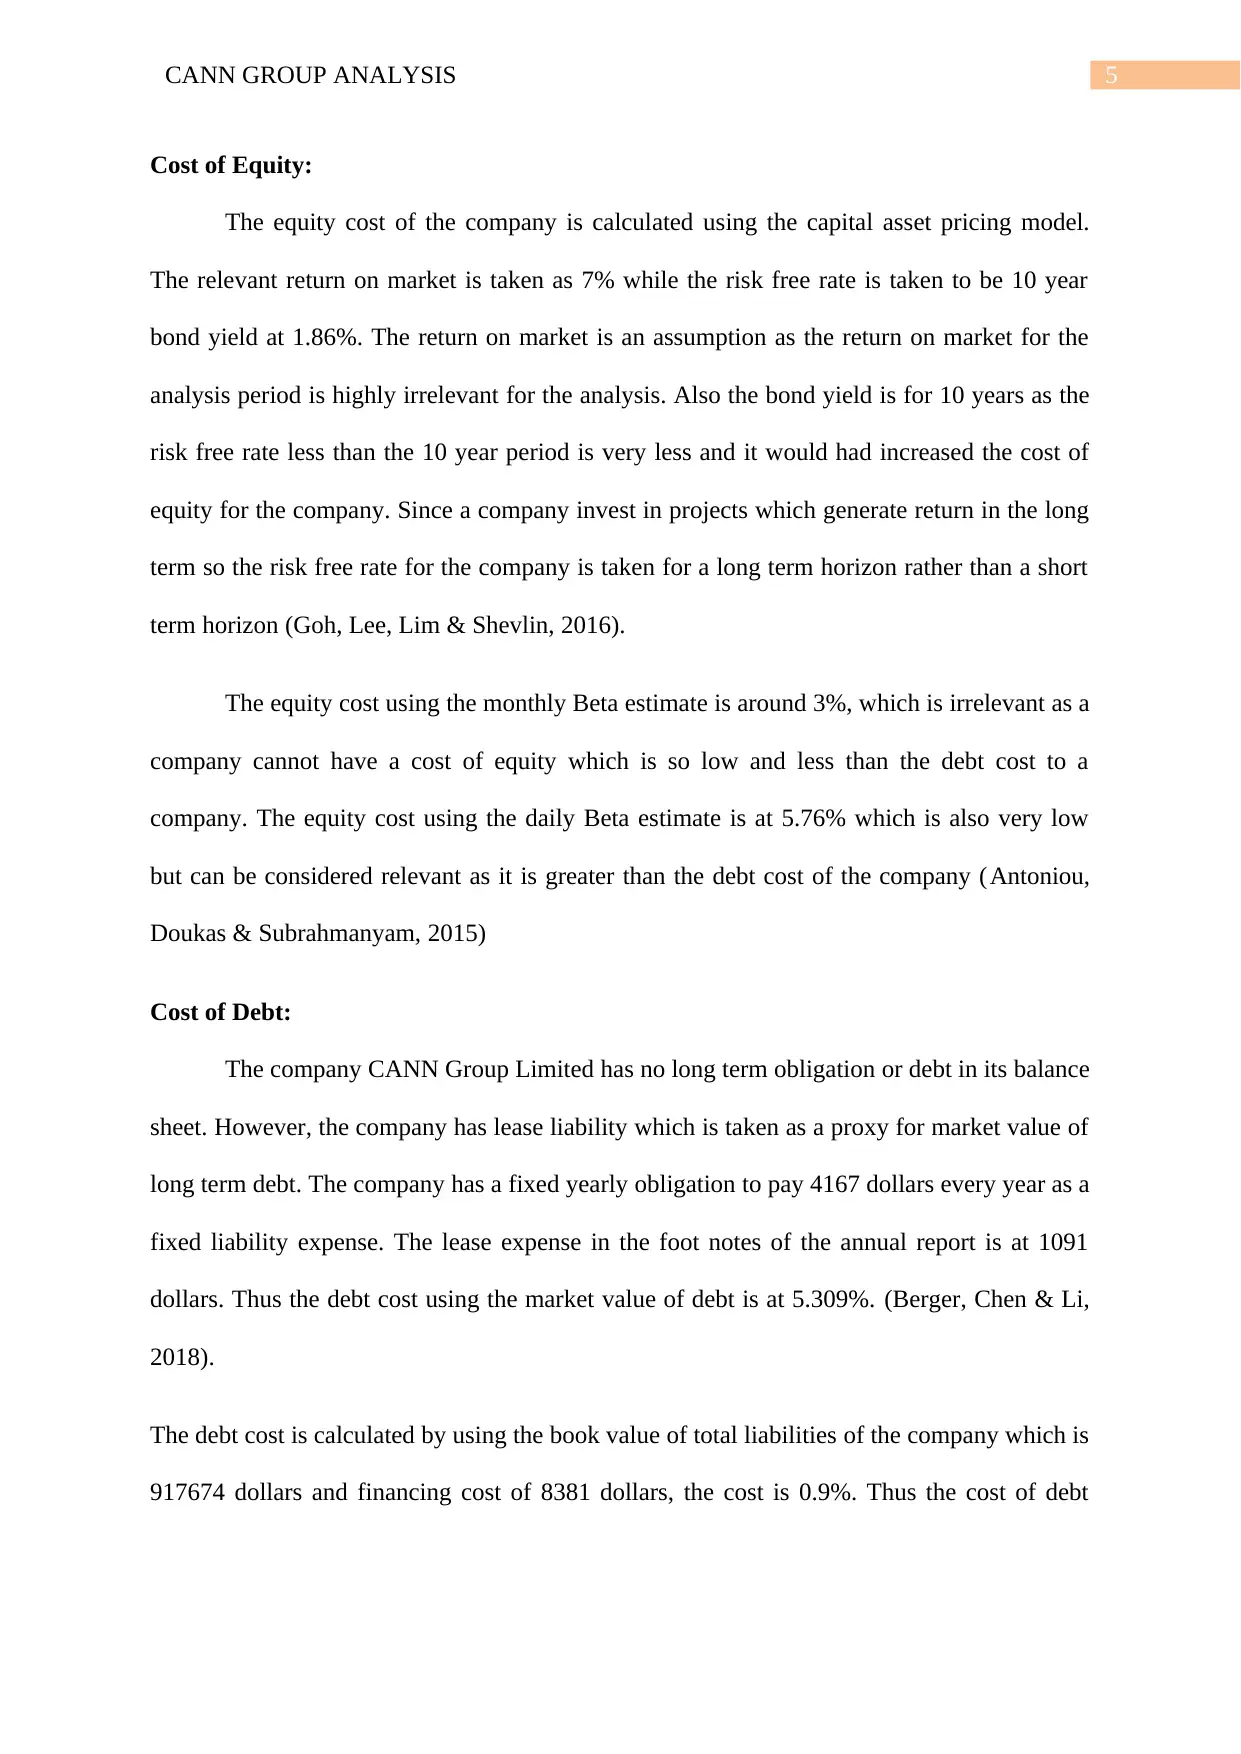
Calculation of Beta:
The beta of a stock highlights the risk which is present in the stock of a company.
Thus beta can be calculated using the weekly daily or monthly data of the stock. The stock
price of the company CANN Group Limited is calculated by using the monthly data of the
stock and also the weekly data of the stock to determine the relevant beta (Habibi, Habibi, &
Habibi, 2016).
Figure 1: Cost of Equity using daily Beta
Source:
Figure 2: Cost of Equity using monthly Beta
Source:
The beta is calculated by regressing the stock price of the organisation with the all
ordinaries index. The beta from the daily data of the company is 0.759 while the beta
calculated using the monthly data of the stock is close to 0. Thus the beta of the stock is
different for different share price data for the organisation. However, the equity cost for the
company is calculated using both the beta calculated from the share price data. (Wegener,
2018).
5CANN GROUP ANALYSIS
Cost of Equity:
The equity cost of the company is calculated using the capital asset pricing model.
The relevant return on market is taken as 7% while the risk free rate is taken to be 10 year
bond yield at 1.86%. The return on market is an assumption as the return on market for the
analysis period is highly irrelevant for the analysis. Also the bond yield is for 10 years as the
risk free rate less than the 10 year period is very less and it would had increased the cost of
equity for the company. Since a company invest in projects which generate return in the long
term so the risk free rate for the company is taken for a long term horizon rather than a short
term horizon (Goh, Lee, Lim & Shevlin, 2016).
The equity cost using the monthly Beta estimate is around 3%, which is irrelevant as a
company cannot have a cost of equity which is so low and less than the debt cost to a
company. The equity cost using the daily Beta estimate is at 5.76% which is also very low
but can be considered relevant as it is greater than the debt cost of the company (Antoniou,
Doukas & Subrahmanyam, 2015)
Cost of Debt:
The company CANN Group Limited has no long term obligation or debt in its balance
sheet. However, the company has lease liability which is taken as a proxy for market value of
long term debt. The company has a fixed yearly obligation to pay 4167 dollars every year as a
fixed liability expense. The lease expense in the foot notes of the annual report is at 1091
dollars. Thus the debt cost using the market value of debt is at 5.309%. (Berger, Chen & Li,
2018).
The debt cost is calculated by using the book value of total liabilities of the company which is
917674 dollars and financing cost of 8381 dollars, the cost is 0.9%. Thus the cost of debt
⊘ This is a preview!⊘
Do you want full access?
Subscribe today to unlock all pages.
Trusted by 1+ million students worldwide
6CANN GROUP ANALYSIS
using the book value of the liabilities of the company is irrelevant, so the market value cost of
debt is used to calculate the cost of capital of the company (Ciftci & Darrough, 2019).
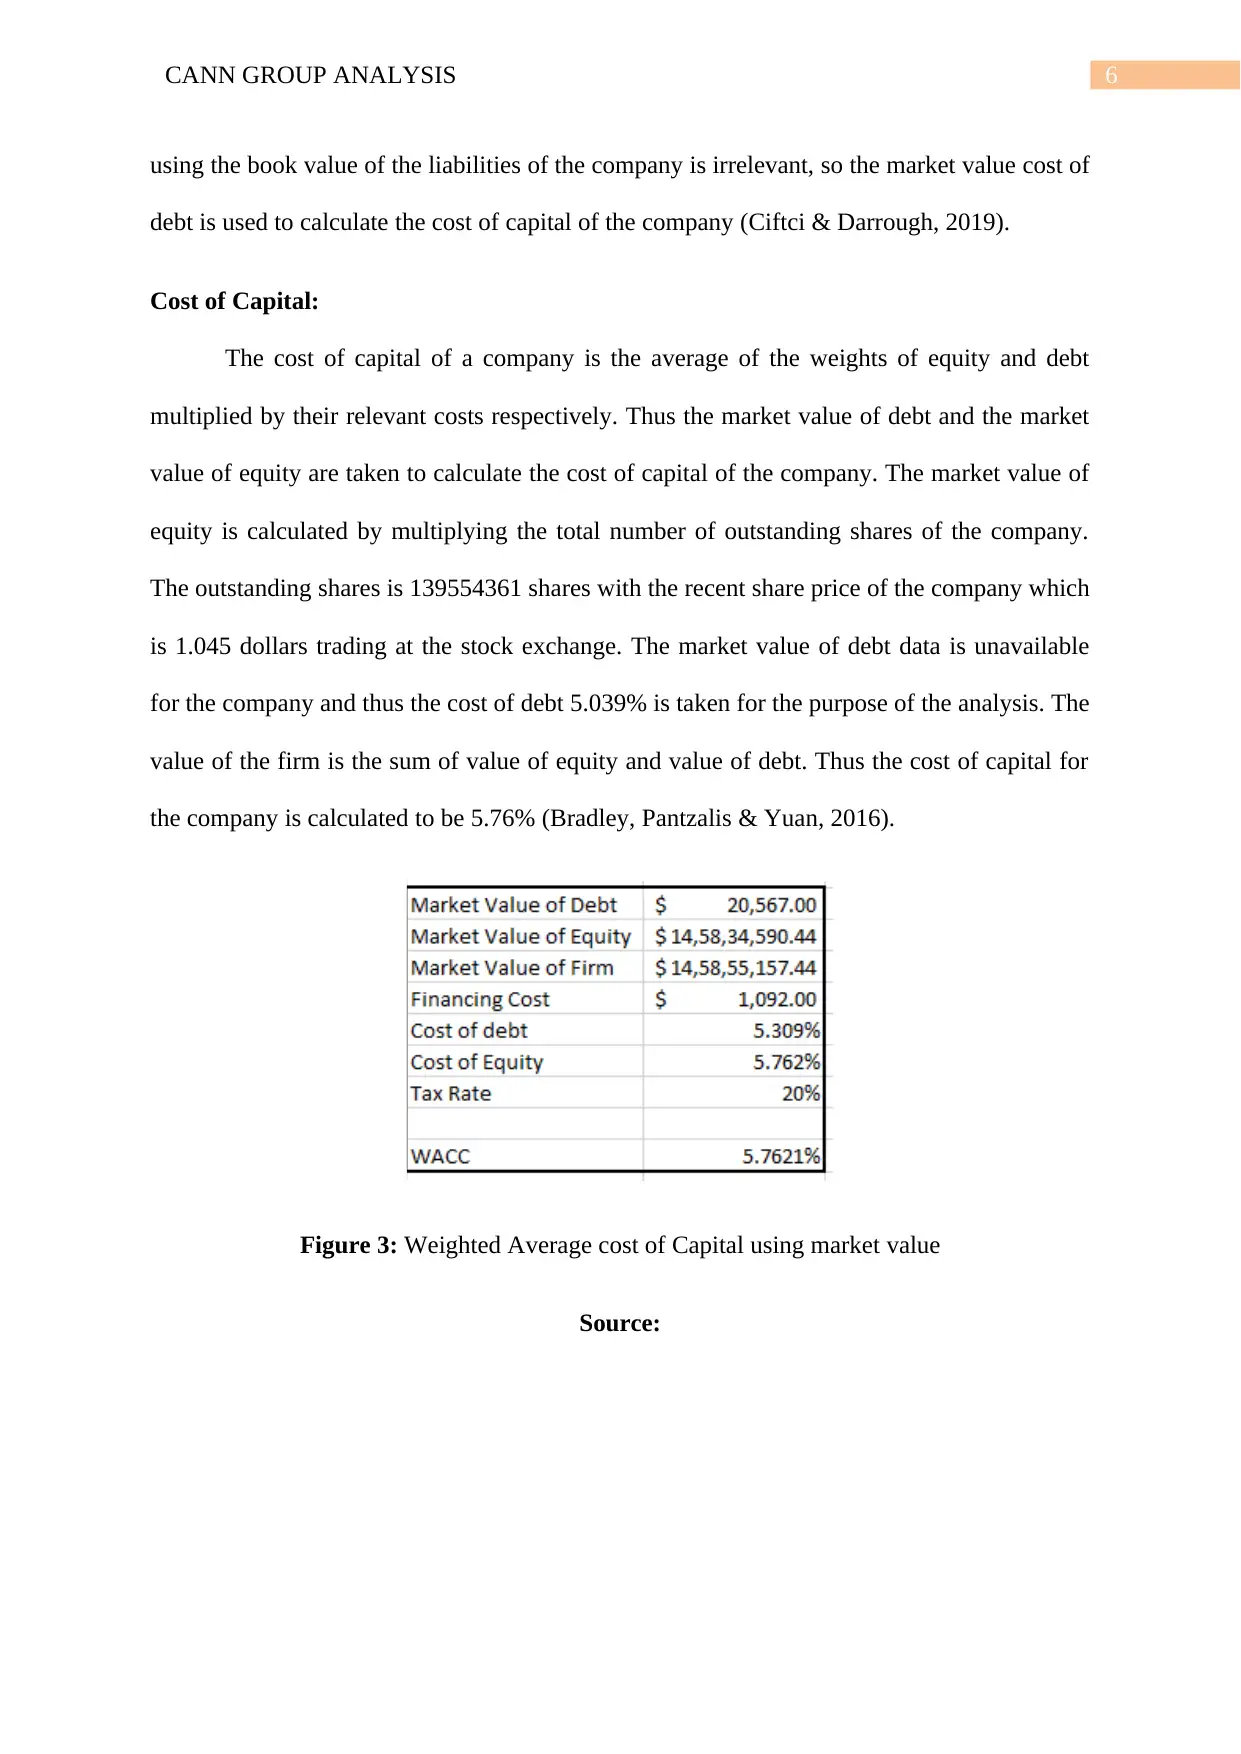
Cost of Capital:
The cost of capital of a company is the average of the weights of equity and debt
multiplied by their relevant costs respectively. Thus the market value of debt and the market
value of equity are taken to calculate the cost of capital of the company. The market value of
equity is calculated by multiplying the total number of outstanding shares of the company.
The outstanding shares is 139554361 shares with the recent share price of the company which
is 1.045 dollars trading at the stock exchange. The market value of debt data is unavailable
for the company and thus the cost of debt 5.039% is taken for the purpose of the analysis. The
value of the firm is the sum of value of equity and value of debt. Thus the cost of capital for
the company is calculated to be 5.76% (Bradley, Pantzalis & Yuan, 2016).
Figure 3: Weighted Average cost of Capital using market value
Source:
using the book value of the liabilities of the company is irrelevant, so the market value cost of
debt is used to calculate the cost of capital of the company (Ciftci & Darrough, 2019).
Cost of Capital:
The cost of capital of a company is the average of the weights of equity and debt
multiplied by their relevant costs respectively. Thus the market value of debt and the market
value of equity are taken to calculate the cost of capital of the company. The market value of
equity is calculated by multiplying the total number of outstanding shares of the company.
The outstanding shares is 139554361 shares with the recent share price of the company which
is 1.045 dollars trading at the stock exchange. The market value of debt data is unavailable
for the company and thus the cost of debt 5.039% is taken for the purpose of the analysis. The
value of the firm is the sum of value of equity and value of debt. Thus the cost of capital for
the company is calculated to be 5.76% (Bradley, Pantzalis & Yuan, 2016).
Figure 3: Weighted Average cost of Capital using market value
Source:
Paraphrase This Document
Need a fresh take? Get an instant paraphrase of this document with our AI Paraphraser
7CANN GROUP ANALYSIS
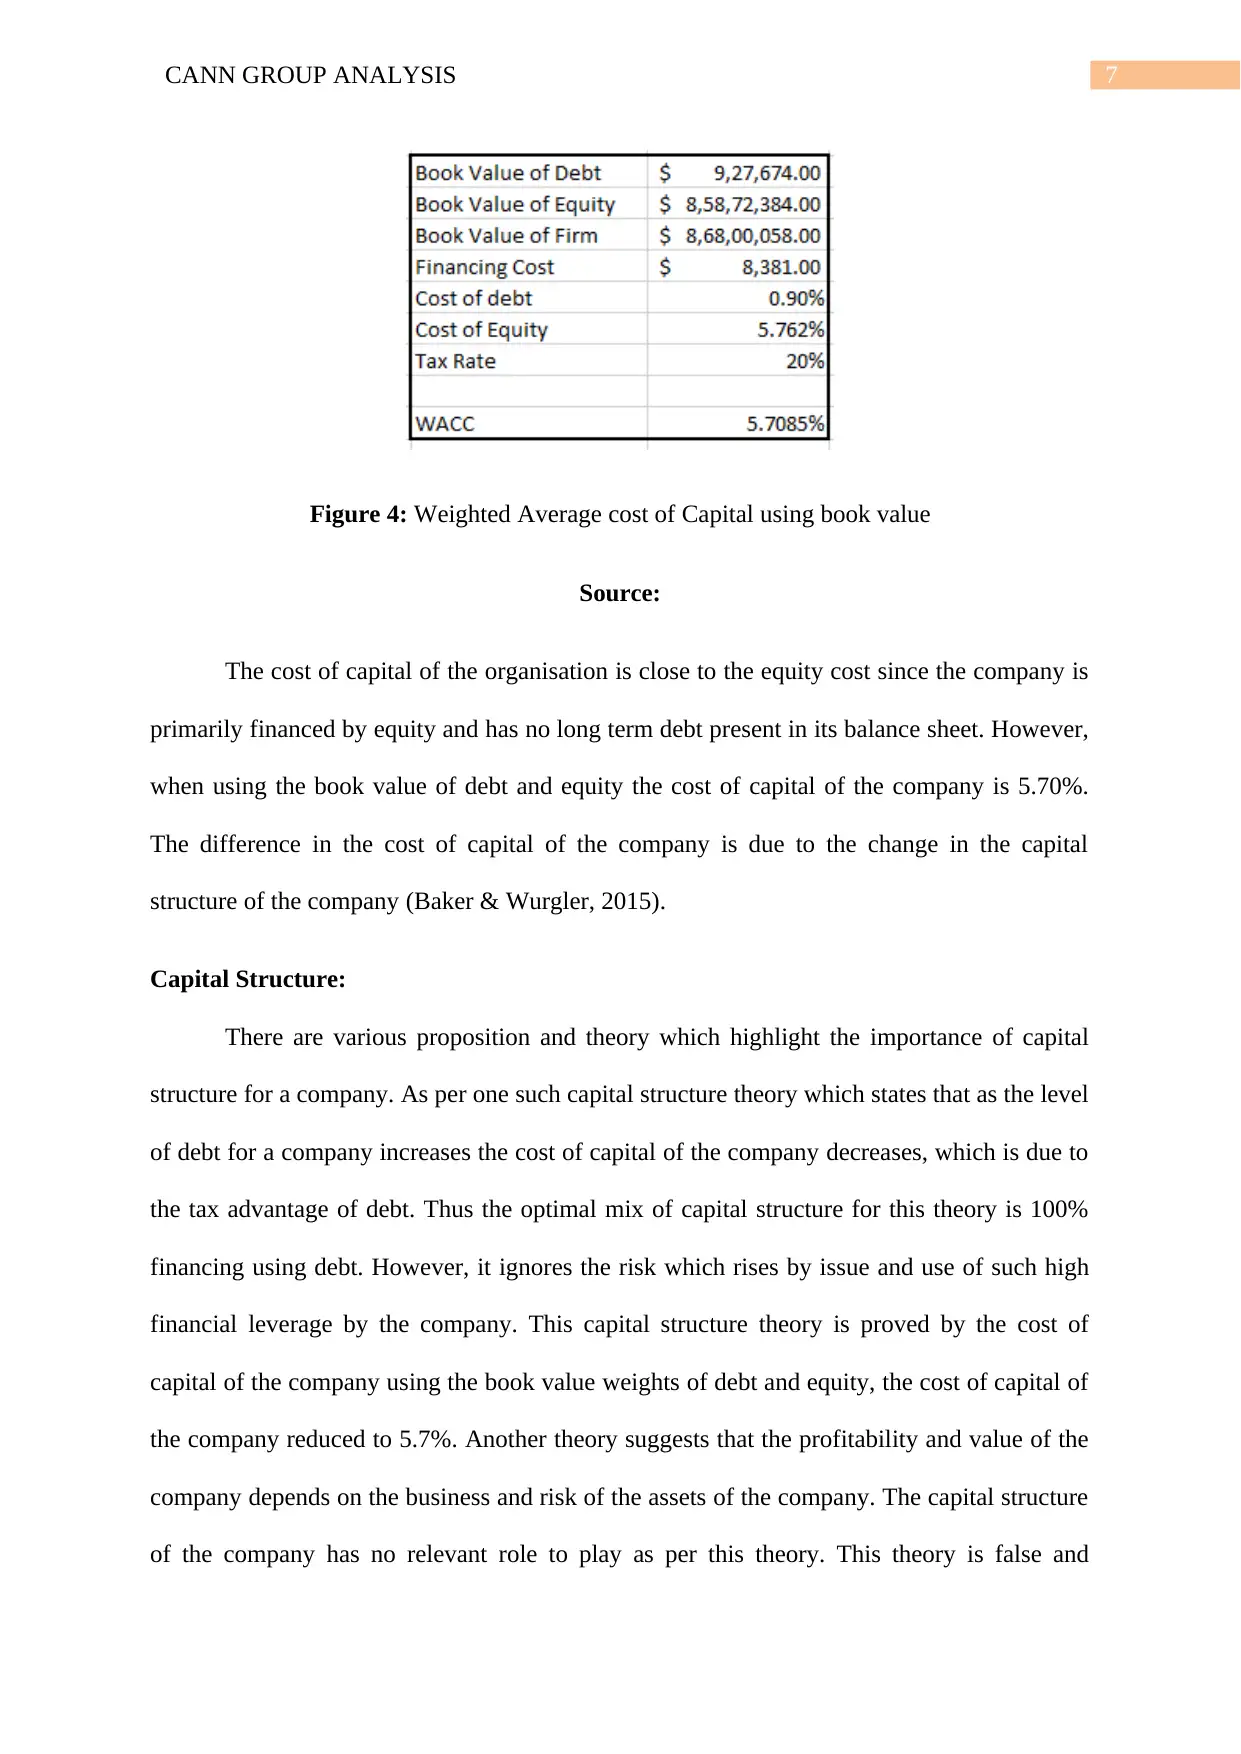
Figure 4: Weighted Average cost of Capital using book value
Source:
The cost of capital of the organisation is close to the equity cost since the company is
primarily financed by equity and has no long term debt present in its balance sheet. However,
when using the book value of debt and equity the cost of capital of the company is 5.70%.
The difference in the cost of capital of the company is due to the change in the capital
structure of the company (Baker & Wurgler, 2015).
Capital Structure:
There are various proposition and theory which highlight the importance of capital
structure for a company. As per one such capital structure theory which states that as the level
of debt for a company increases the cost of capital of the company decreases, which is due to
the tax advantage of debt. Thus the optimal mix of capital structure for this theory is 100%
financing using debt. However, it ignores the risk which rises by issue and use of such high
financial leverage by the company. This capital structure theory is proved by the cost of
capital of the company using the book value weights of debt and equity, the cost of capital of
the company reduced to 5.7%. Another theory suggests that the profitability and value of the
company depends on the business and risk of the assets of the company. The capital structure
of the company has no relevant role to play as per this theory. This theory is false and
8CANN GROUP ANALYSIS
irrelevant which is highlighted by the reduction in the cost of capital of the company by a
change in the capital structure of the company (Frank & Shen, 2016).
Thus capital structure of a company has an important role to play in the profitability
of the company. The company should maintain its capital structure at optimal level to reduce
the cost of capital of the company and to increase the value of the company.
Ratio:
Gearing ratio are ratio which highlights the level of leverage which is taken by a
company to operate its business operation. It highlights the level of risk which is prevalent on
the assets of the company as leverage acts as an amplifier of returns. It increases the positive
returns for the stakeholders of the company and also magnifies the loss for the stakeholders
of the company (Guinnane & Schneebacher, 2018).
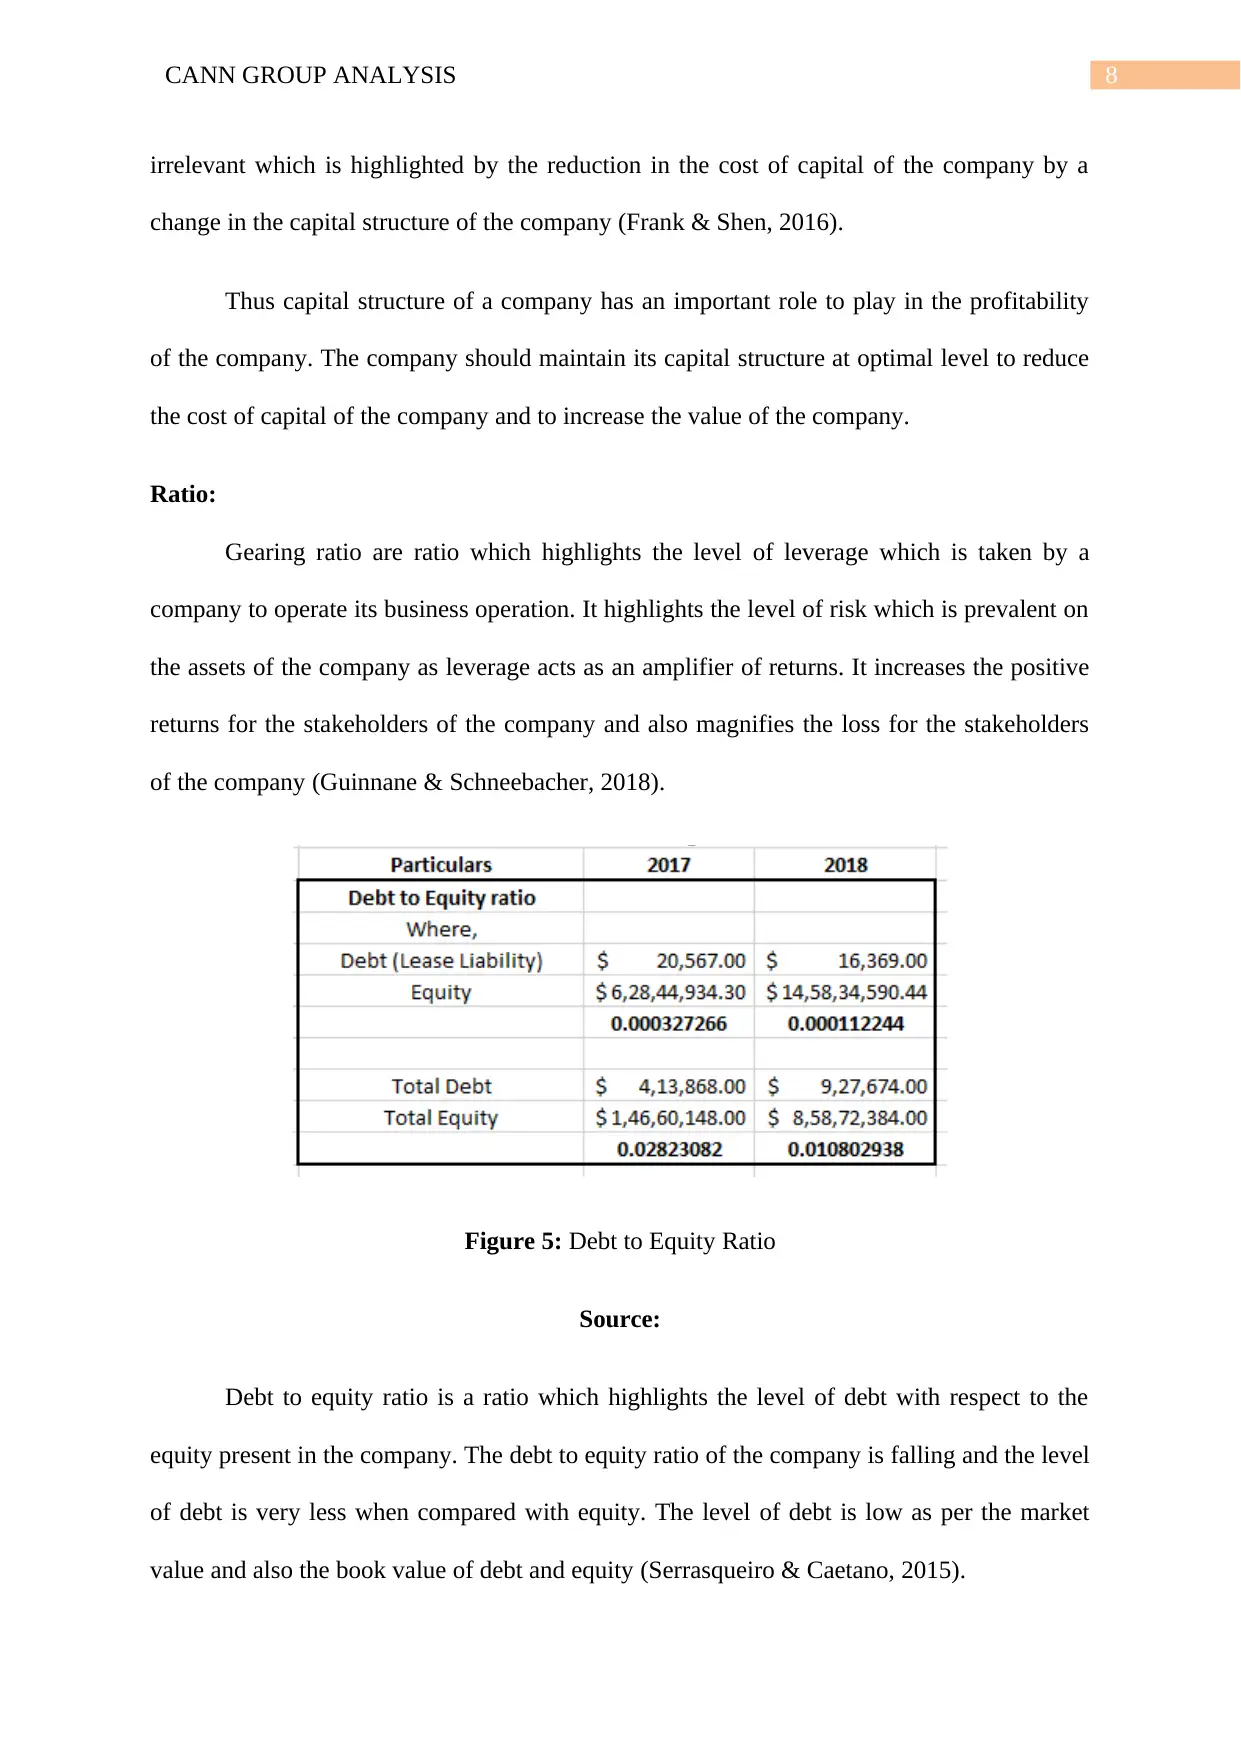
Figure 5: Debt to Equity Ratio
Source:
Debt to equity ratio is a ratio which highlights the level of debt with respect to the
equity present in the company. The debt to equity ratio of the company is falling and the level
of debt is very less when compared with equity. The level of debt is low as per the market
value and also the book value of debt and equity (Serrasqueiro & Caetano, 2015).
irrelevant which is highlighted by the reduction in the cost of capital of the company by a
change in the capital structure of the company (Frank & Shen, 2016).
Thus capital structure of a company has an important role to play in the profitability
of the company. The company should maintain its capital structure at optimal level to reduce
the cost of capital of the company and to increase the value of the company.
Ratio:
Gearing ratio are ratio which highlights the level of leverage which is taken by a
company to operate its business operation. It highlights the level of risk which is prevalent on
the assets of the company as leverage acts as an amplifier of returns. It increases the positive
returns for the stakeholders of the company and also magnifies the loss for the stakeholders
of the company (Guinnane & Schneebacher, 2018).
Figure 5: Debt to Equity Ratio
Source:
Debt to equity ratio is a ratio which highlights the level of debt with respect to the
equity present in the company. The debt to equity ratio of the company is falling and the level
of debt is very less when compared with equity. The level of debt is low as per the market
value and also the book value of debt and equity (Serrasqueiro & Caetano, 2015).
⊘ This is a preview!⊘
Do you want full access?
Subscribe today to unlock all pages.
Trusted by 1+ million students worldwide
9CANN GROUP ANALYSIS
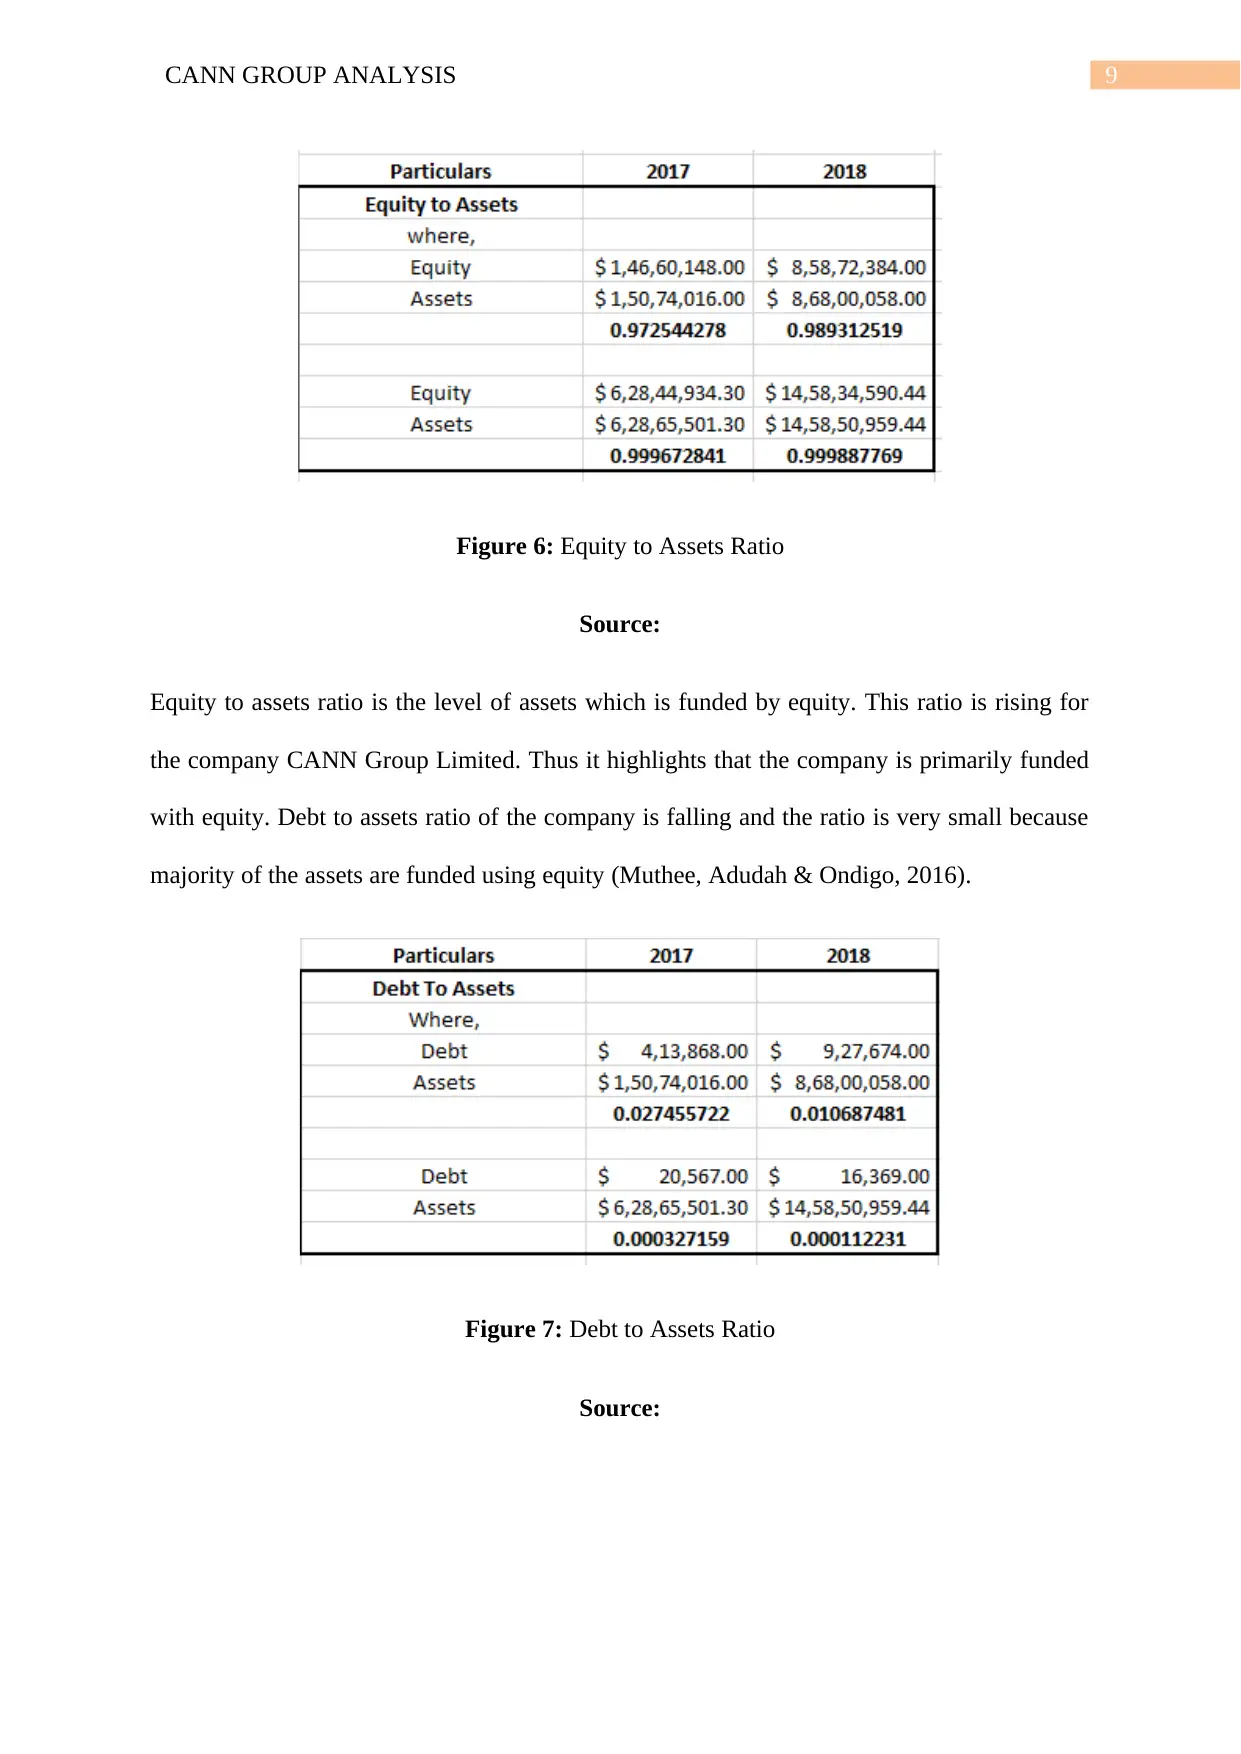
Figure 6: Equity to Assets Ratio
Source:
Equity to assets ratio is the level of assets which is funded by equity. This ratio is rising for
the company CANN Group Limited. Thus it highlights that the company is primarily funded
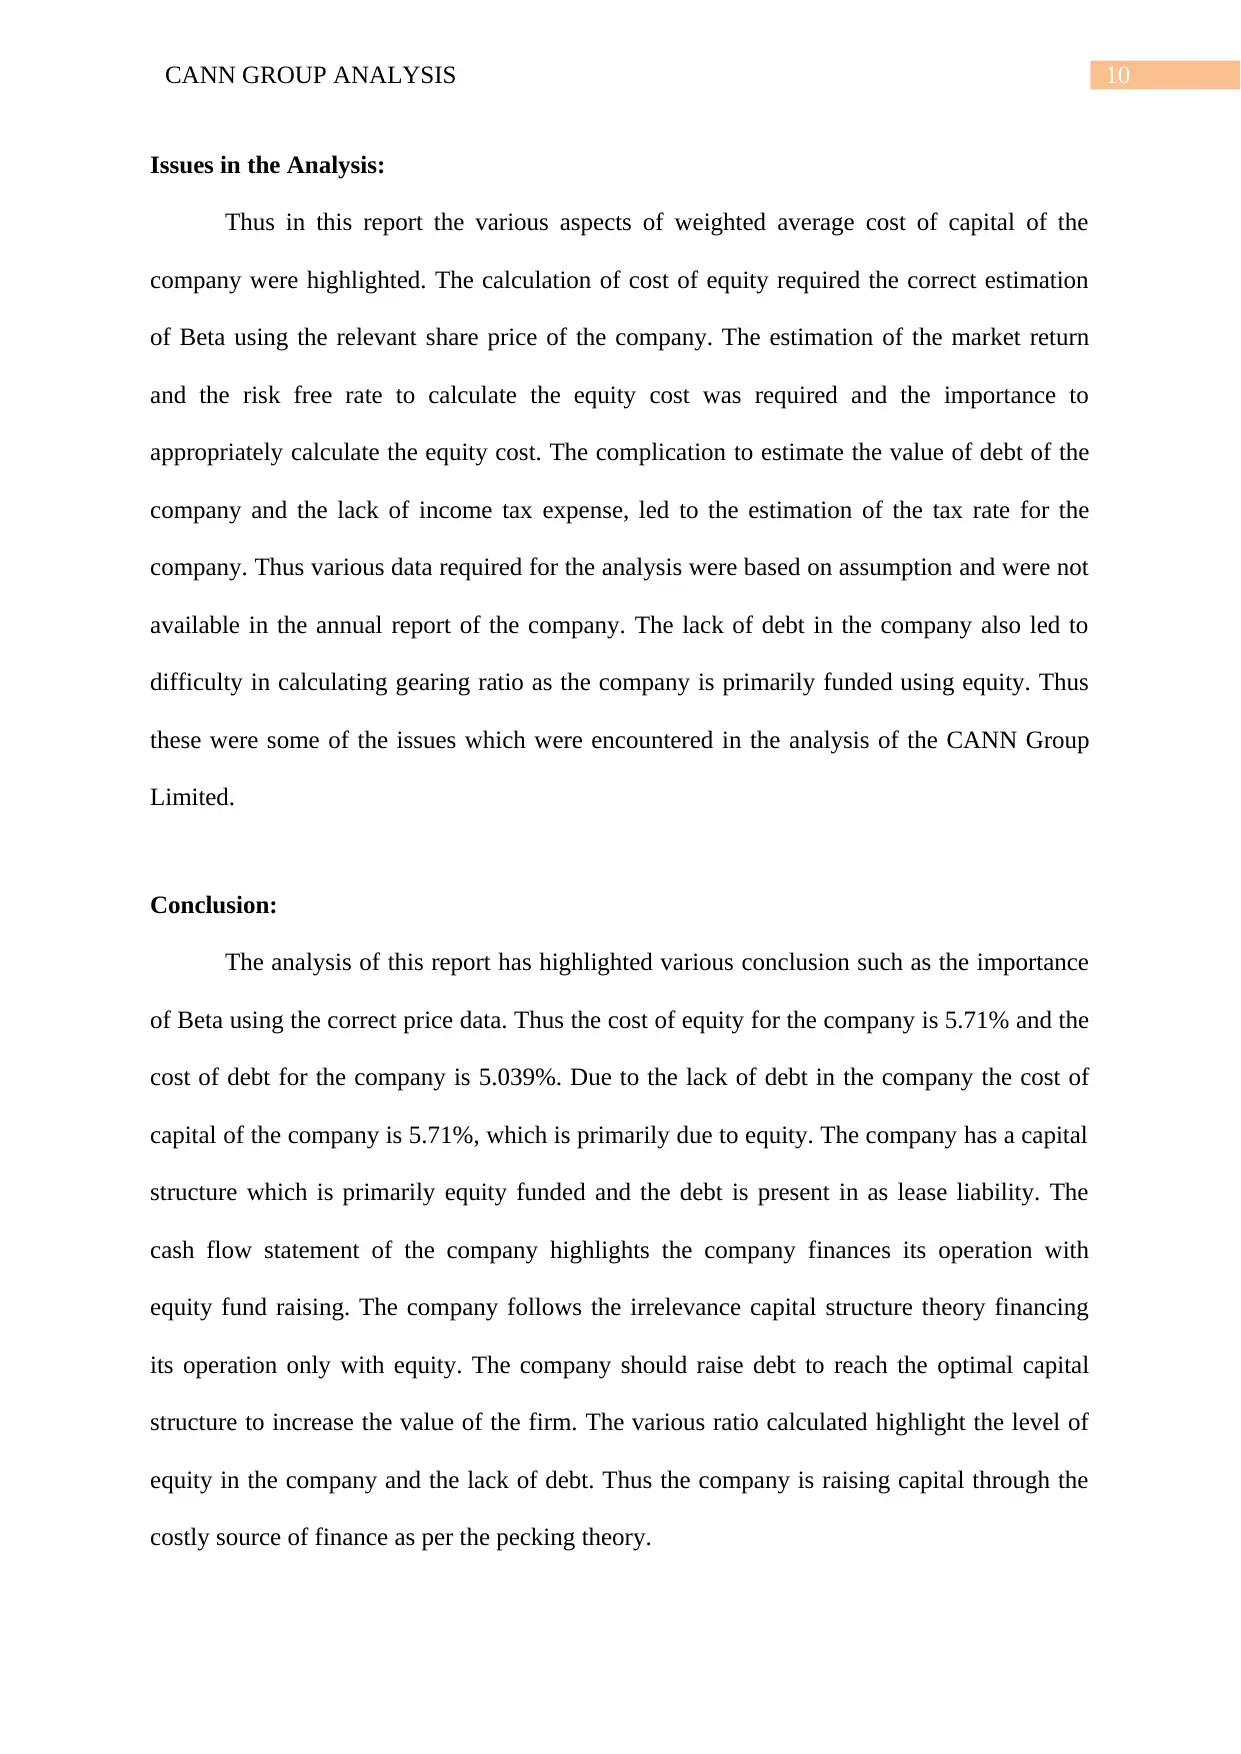
with equity. Debt to assets ratio of the company is falling and the ratio is very small because
majority of the assets are funded using equity (Muthee, Adudah & Ondigo, 2016).
Figure 7: Debt to Assets Ratio
Source:
Figure 6: Equity to Assets Ratio
Source:
Equity to assets ratio is the level of assets which is funded by equity. This ratio is rising for
the company CANN Group Limited. Thus it highlights that the company is primarily funded
with equity. Debt to assets ratio of the company is falling and the ratio is very small because
majority of the assets are funded using equity (Muthee, Adudah & Ondigo, 2016).
Figure 7: Debt to Assets Ratio
Source:
Paraphrase This Document
Need a fresh take? Get an instant paraphrase of this document with our AI Paraphraser
10CANN GROUP ANALYSIS
Issues in the Analysis:
Thus in this report the various aspects of weighted average cost of capital of the
company were highlighted. The calculation of cost of equity required the correct estimation
of Beta using the relevant share price of the company. The estimation of the market return
and the risk free rate to calculate the equity cost was required and the importance to
appropriately calculate the equity cost. The complication to estimate the value of debt of the
company and the lack of income tax expense, led to the estimation of the tax rate for the
company. Thus various data required for the analysis were based on assumption and were not
available in the annual report of the company. The lack of debt in the company also led to
difficulty in calculating gearing ratio as the company is primarily funded using equity. Thus
these were some of the issues which were encountered in the analysis of the CANN Group
Limited.
Conclusion:
The analysis of this report has highlighted various conclusion such as the importance
of Beta using the correct price data. Thus the cost of equity for the company is 5.71% and the
cost of debt for the company is 5.039%. Due to the lack of debt in the company the cost of
capital of the company is 5.71%, which is primarily due to equity. The company has a capital
structure which is primarily equity funded and the debt is present in as lease liability. The
cash flow statement of the company highlights the company finances its operation with
equity fund raising. The company follows the irrelevance capital structure theory financing
its operation only with equity. The company should raise debt to reach the optimal capital
structure to increase the value of the firm. The various ratio calculated highlight the level of
equity in the company and the lack of debt. Thus the company is raising capital through the
costly source of finance as per the pecking theory.
11CANN GROUP ANALYSIS
Thus it is concluded that the company has a all equity capital structure and its cost of
capital is equal to the equity cost. The company is foregoing the benefits of debt by raising
capital through equity.
Recommendation:
The company has an all equity capital structure, thus the value of the firm can
increase if the company issues debt to finance its operation.
The Beta of the company is close to 1 and thus the stock price of the company follows
the trend of the market and it is a less risky stock compared to other stocks.
The lack of debt highlights the ownership of the assets of the company with the equity
stakeholders of the company. Thus lack of leverage means the returns generated by
the company is for the equity stakeholders.
The company is financing its operation with the issue of shares, thus the company can
reduce the cost by issuing capital with the use of debt.
⊘ This is a preview!⊘
Do you want full access?
Subscribe today to unlock all pages.
Trusted by 1+ million students worldwide
1 out of 14
Related Documents


Your All-in-One AI-Powered Toolkit for Academic Success.
+13062052269
info@desklib.com
Available 24*7 on WhatsApp / Email
![[object Object]](/_next/static/media/star-bottom.7253800d.svg)
Unlock your academic potential
Copyright © 2020–2026 A2Z Services. All Rights Reserved. Developed and managed by ZUCOL.