CANN Group Limited: Capital Structure, WACC, and Gearing Analysis
VerifiedAdded on 2022/10/04
|14
|2948
|28
Report
AI Summary
This report provides a detailed financial analysis of CANN Group Limited's capital structure. It examines the company's weighted average cost of capital (WACC), calculated using both market and book values, and assesses its gearing ratios, including debt-to-equity, loss before interest tax to interest, equity to assets, and debt to asset ratios. The analysis utilizes data from the company's annual reports and considers relevant financial theories, such as the Modigliani-Miller model and the pecking order theory, to evaluate the impact of the capital structure on the firm's value and financing decisions. The report concludes with recommendations regarding the company's capital structure strategy, highlighting its reliance on equity financing and its implications for cost of capital and financial leverage.
Running head: CAPITAL STRUCTURE ANALYSIS
Capital Structure Analysis
Name of the Student:
Name of the University:
Author Note:
Capital Structure Analysis
Name of the Student:
Name of the University:
Author Note:
Paraphrase This Document
Need a fresh take? Get an instant paraphrase of this document with our AI Paraphraser
1CAPITAL STRUCTURE ANALYSIS
Executive Summary:
The following report consists the examination of the capital distribution of a company CANN
Group Limited. Also the weighted average cost of capital of the company is determined by
the Beta estimate calculated from the share price. The shareholder’s equity and bondholder’s
debt level of the company is analysed from the financial report of the company which is used
in the calculation of the weighted average cost of capital of the company. The capital
structure of the company is analysed with different theory of capital structure. The gearing
ratio of the company are calculated using the book value and the accounting value of
bondholder’s debt and shareholder’s equity. The gearing ratio are compared over the two year
analysis period to analyse the leverage used by the company. A relevant conclusion and
recommendation of the analysis is provided at the end of the report.
2CAPITAL STRUCTURE ANALYSIS
Table of Contents
Introduction:...............................................................................................................................3
Discussion:.................................................................................................................................3
Assumption in the Analysis:..................................................................................................3
Weighted Average Cost of Capital using Market Value:.......................................................4
Weighted Average Cost of Capital using Book Value:.........................................................5
Gearing Ratio for the company:.............................................................................................6
Debt to Equity Ratio:.........................................................................................................6
Loss before Interest Tax to interest ratio:..........................................................................7
Equity to Assets ratio:........................................................................................................8
Debt to Asset Ratio:...........................................................................................................9
Capital Structure Theory:.......................................................................................................9
Conclusion:..............................................................................................................................10
Recommendation:....................................................................................................................11
References:...............................................................................................................................12
⊘ This is a preview!⊘
Do you want full access?
Subscribe today to unlock all pages.
Trusted by 1+ million students worldwide
3CAPITAL STRUCTURE ANALYSIS
Introduction:
A company generates returns to meet its expense which are operational or
administrative, to provide the share of returns to the debt providers and equity shareholders.
Thus a company before accumulating surplus cash needs to provide the necessary share of
return to the capital providers to the company. Thus the weighted average cost of capital of a
company is an important threshold level and can be considered as the base return which the
company has to earn from its operation of business. The following report is an analysis of the
structure of capital and weighted average cost of capital of CANN Group Limited. The
company got listed in the Australian stock exchange on 5th may 2017. Thus the data available
from that period till the present date is used to perform the requisite analysis of the company.
Along with the structure of capital in the company the gearing ratio of the company are
calculated and provided in the following report (investors.canngrouplimited.com 2019).
Discussion:
Assumption in the Analysis:
The following assumption were used for the analysis of the capital structure,
calculation of weighted average cost of capital and gearing ratio of the company,
The data required for the analysis of the CANN Group Limited was collected from the
Annual Report of the company for the year 2018.
The market return to calculate the cost of equity is taken at 6.1% as the average
market return taken as the average of the All ordinaries index generated a return of
0.12% which would have rendered the cost of equity negative.
The risk free rate in Australia is taken as 1.86%, this is the Common wealth
government bond yield for 10 years.
Paraphrase This Document
Need a fresh take? Get an instant paraphrase of this document with our AI Paraphraser
4CAPITAL STRUCTURE ANALYSIS
The Beta is calculated by regressing the Stock return taken as the dependent variable
with the index return which is taken as the independent variable. Thus to check the
accuracy of the regression the slope function provided in excel is used to check the
beta estimate calculated from the regression.
The gearing ratio is calculated using the values provided in the statement of financials
of the company.
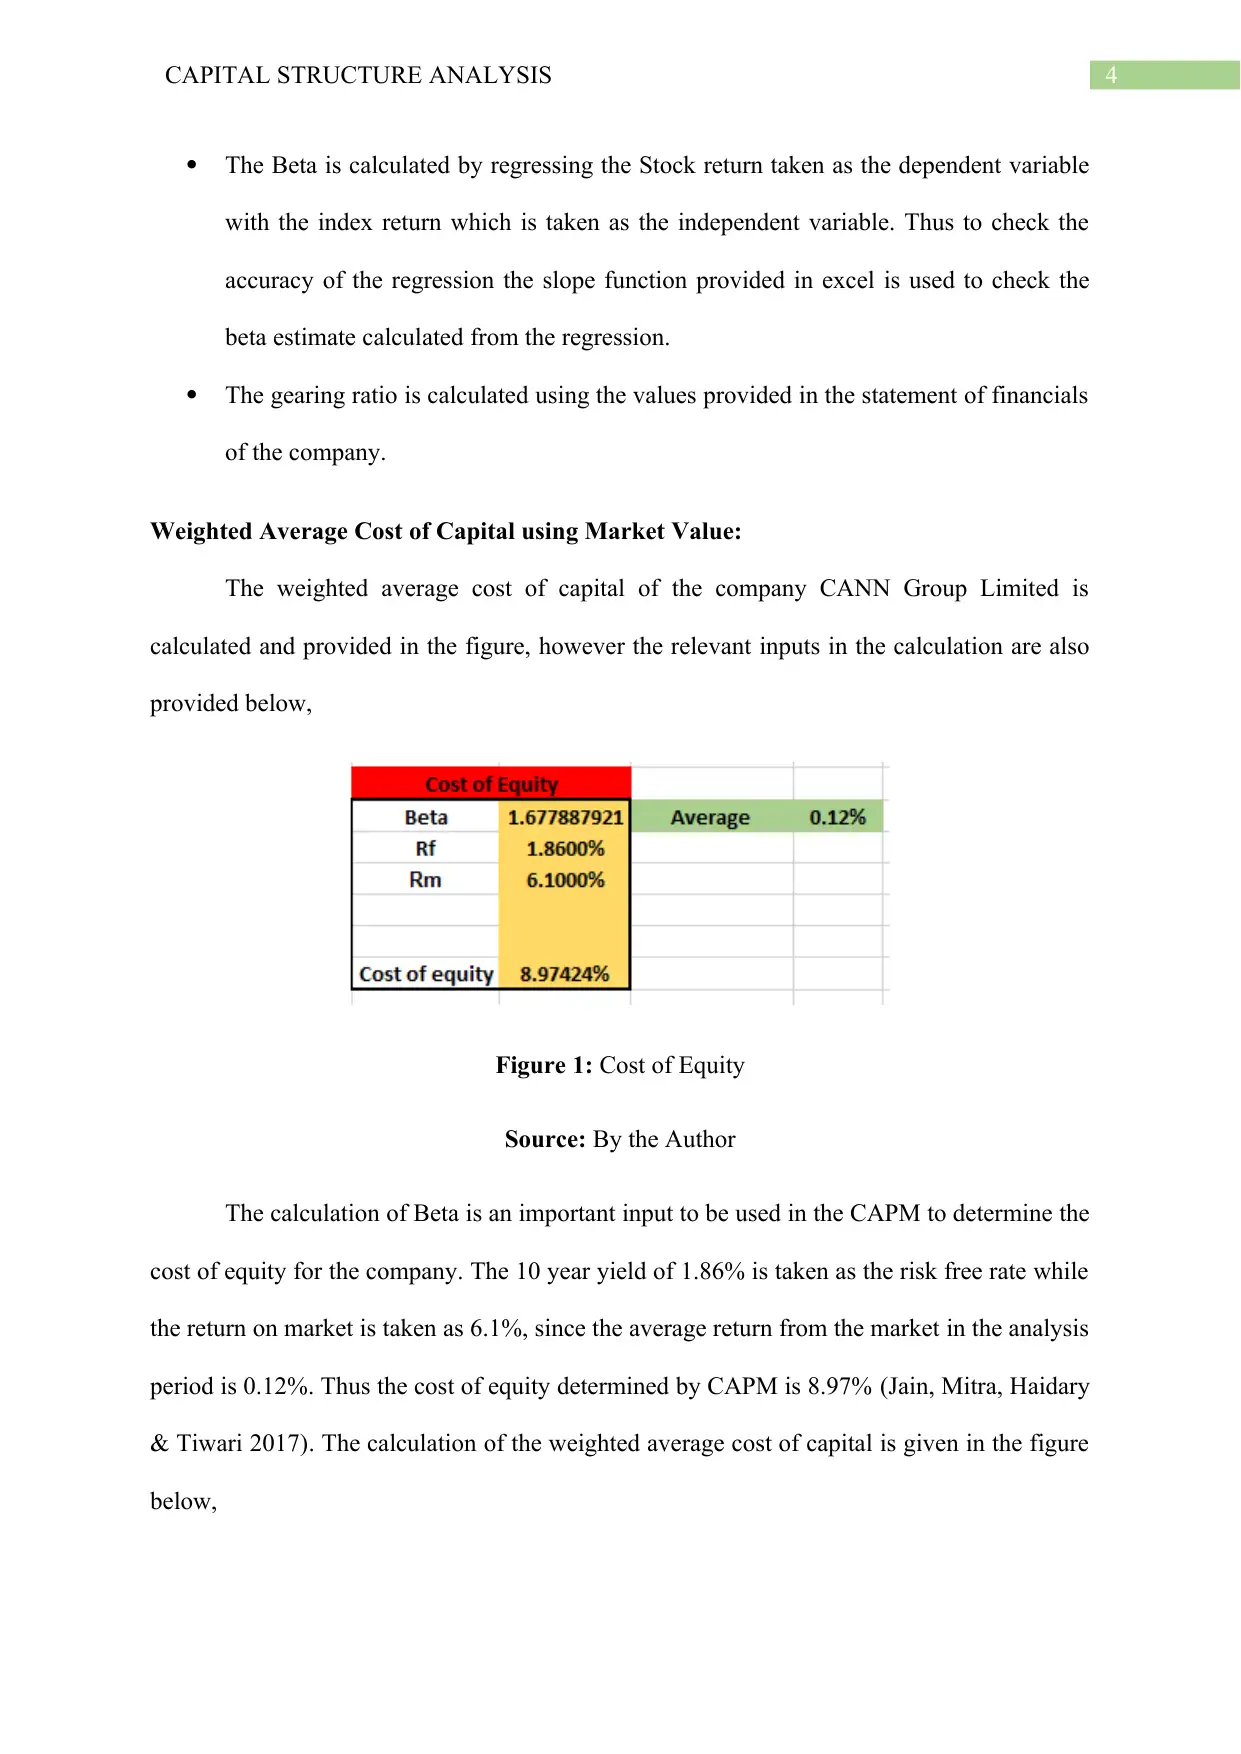
Weighted Average Cost of Capital using Market Value:
The weighted average cost of capital of the company CANN Group Limited is
calculated and provided in the figure, however the relevant inputs in the calculation are also
provided below,
Figure 1: Cost of Equity
Source: By the Author
The calculation of Beta is an important input to be used in the CAPM to determine the
cost of equity for the company. The 10 year yield of 1.86% is taken as the risk free rate while
the return on market is taken as 6.1%, since the average return from the market in the analysis
period is 0.12%. Thus the cost of equity determined by CAPM is 8.97% (Jain, Mitra, Haidary
& Tiwari 2017). The calculation of the weighted average cost of capital is given in the figure
below,
The Beta is calculated by regressing the Stock return taken as the dependent variable
with the index return which is taken as the independent variable. Thus to check the
accuracy of the regression the slope function provided in excel is used to check the
beta estimate calculated from the regression.
The gearing ratio is calculated using the values provided in the statement of financials
of the company.
Weighted Average Cost of Capital using Market Value:
The weighted average cost of capital of the company CANN Group Limited is
calculated and provided in the figure, however the relevant inputs in the calculation are also
provided below,
Figure 1: Cost of Equity
Source: By the Author
The calculation of Beta is an important input to be used in the CAPM to determine the
cost of equity for the company. The 10 year yield of 1.86% is taken as the risk free rate while
the return on market is taken as 6.1%, since the average return from the market in the analysis
period is 0.12%. Thus the cost of equity determined by CAPM is 8.97% (Jain, Mitra, Haidary
& Tiwari 2017). The calculation of the weighted average cost of capital is given in the figure
below,
5CAPITAL STRUCTURE ANALYSIS
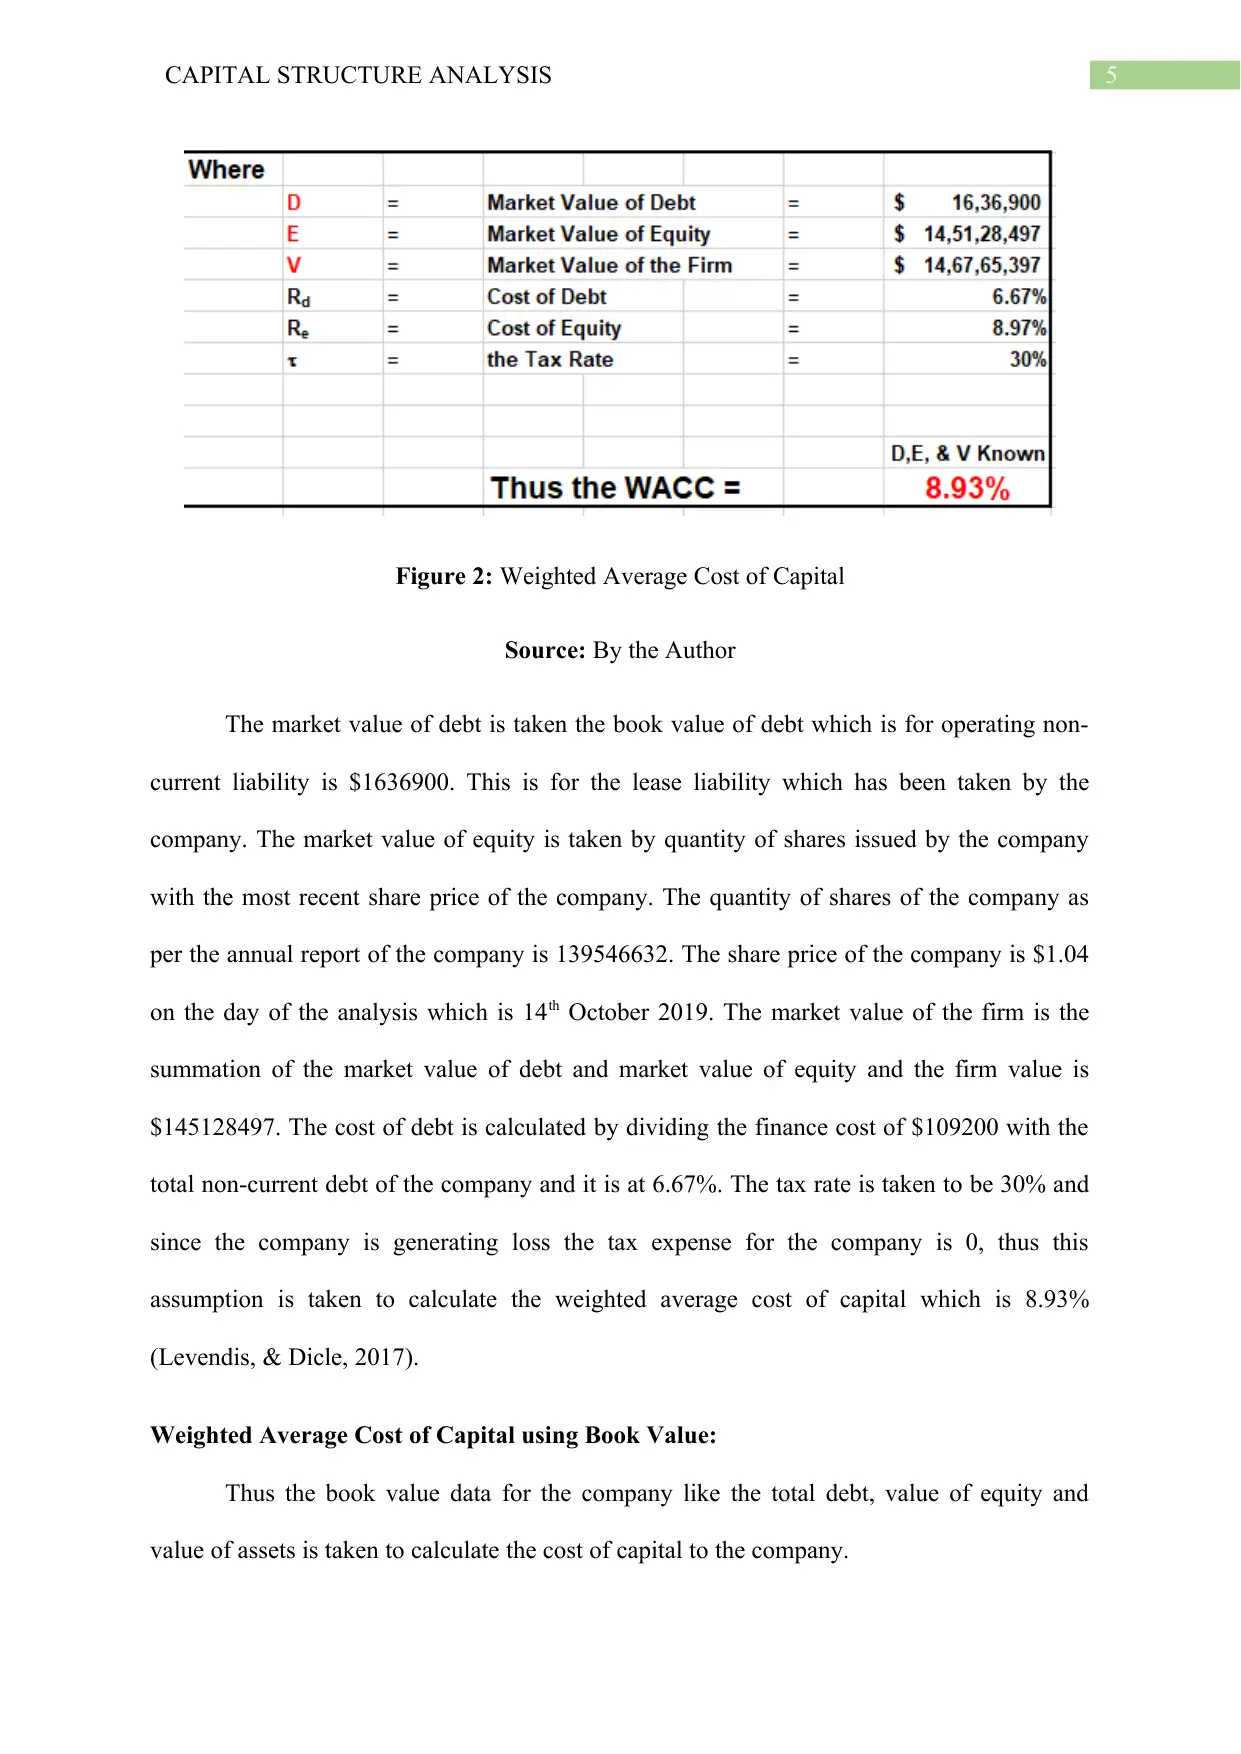
Figure 2: Weighted Average Cost of Capital
Source: By the Author
The market value of debt is taken the book value of debt which is for operating non-
current liability is $1636900. This is for the lease liability which has been taken by the
company. The market value of equity is taken by quantity of shares issued by the company
with the most recent share price of the company. The quantity of shares of the company as
per the annual report of the company is 139546632. The share price of the company is $1.04
on the day of the analysis which is 14th October 2019. The market value of the firm is the
summation of the market value of debt and market value of equity and the firm value is
$145128497. The cost of debt is calculated by dividing the finance cost of $109200 with the
total non-current debt of the company and it is at 6.67%. The tax rate is taken to be 30% and
since the company is generating loss the tax expense for the company is 0, thus this
assumption is taken to calculate the weighted average cost of capital which is 8.93%
(Levendis, & Dicle, 2017).
Weighted Average Cost of Capital using Book Value:
Thus the book value data for the company like the total debt, value of equity and
value of assets is taken to calculate the cost of capital to the company.
⊘ This is a preview!⊘
Do you want full access?
Subscribe today to unlock all pages.
Trusted by 1+ million students worldwide
6CAPITAL STRUCTURE ANALYSIS
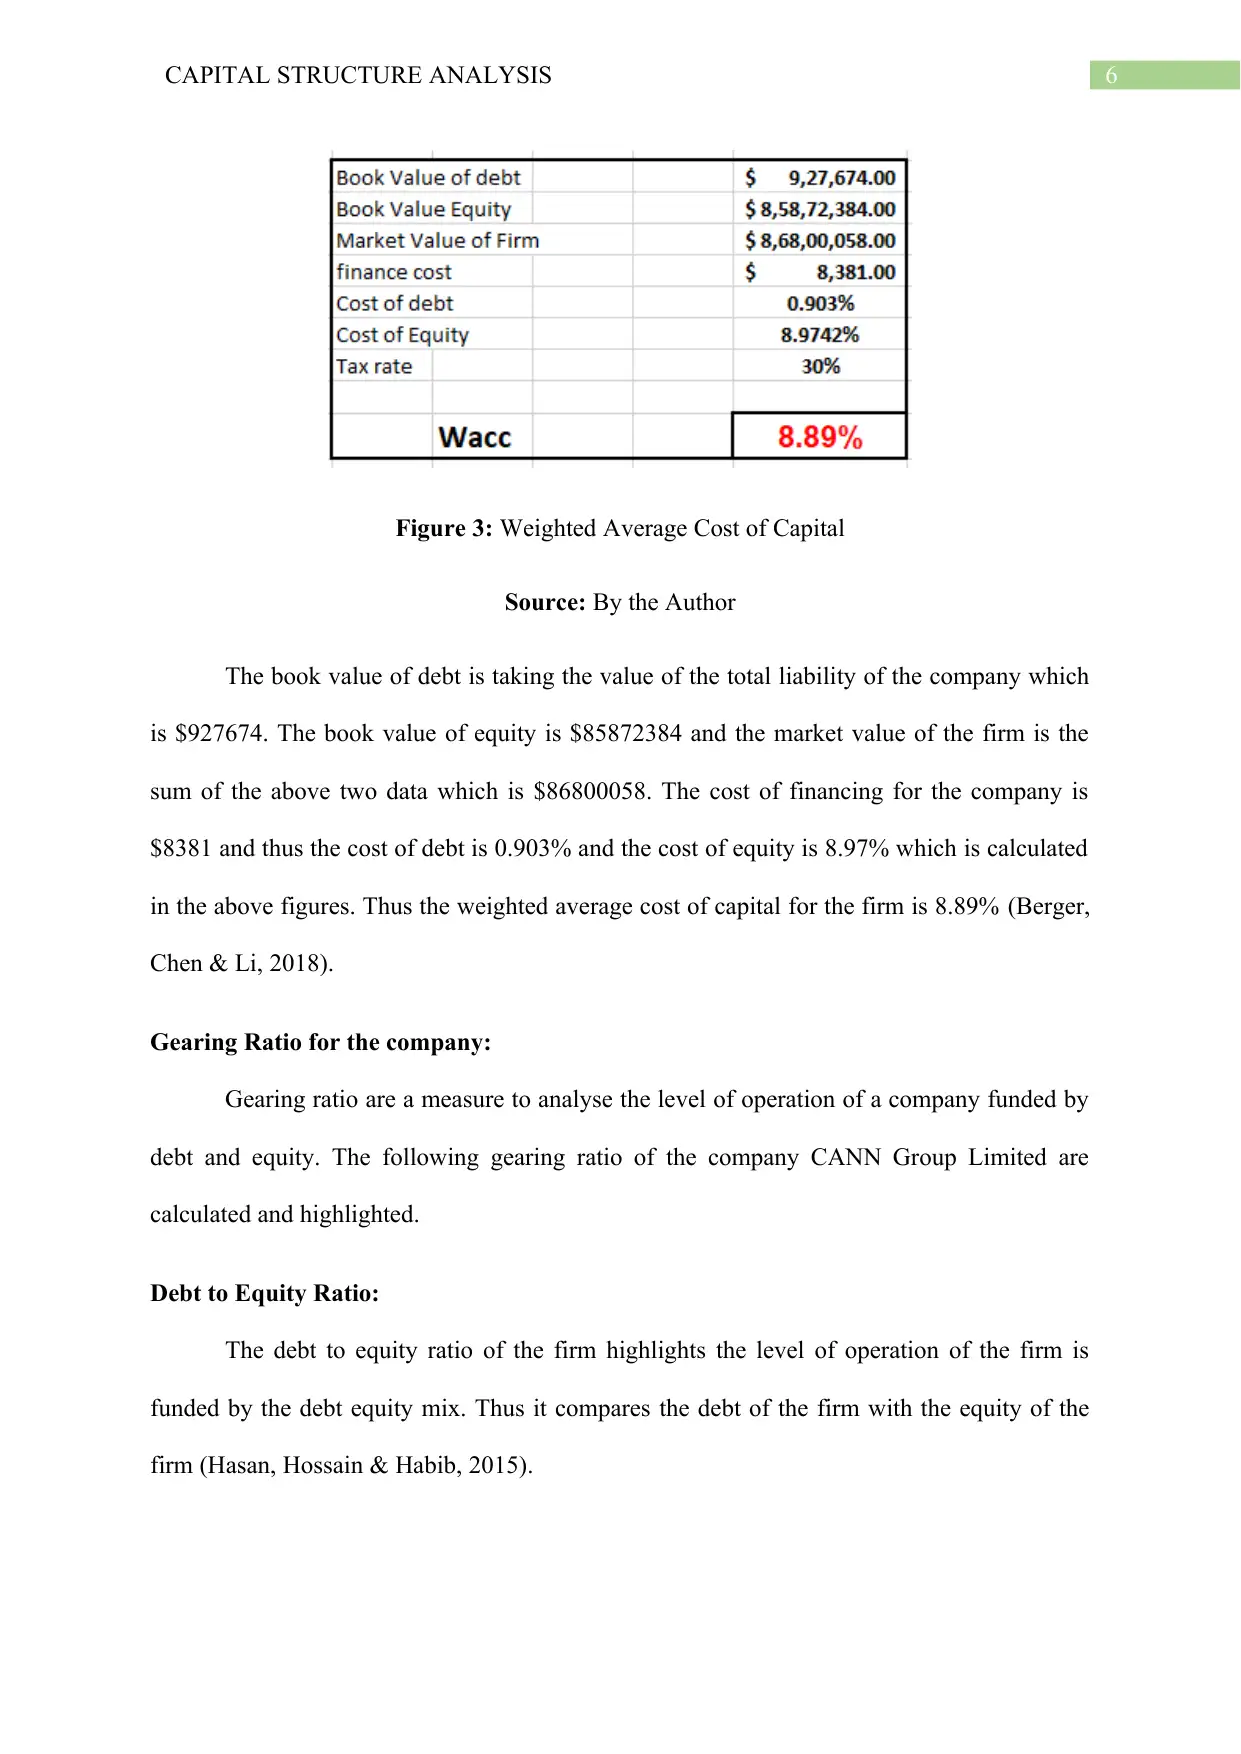
Figure 3: Weighted Average Cost of Capital
Source: By the Author
The book value of debt is taking the value of the total liability of the company which
is $927674. The book value of equity is $85872384 and the market value of the firm is the
sum of the above two data which is $86800058. The cost of financing for the company is
$8381 and thus the cost of debt is 0.903% and the cost of equity is 8.97% which is calculated
in the above figures. Thus the weighted average cost of capital for the firm is 8.89% (Berger,
Chen & Li, 2018).
Gearing Ratio for the company:
Gearing ratio are a measure to analyse the level of operation of a company funded by
debt and equity. The following gearing ratio of the company CANN Group Limited are
calculated and highlighted.
Debt to Equity Ratio:
The debt to equity ratio of the firm highlights the level of operation of the firm is
funded by the debt equity mix. Thus it compares the debt of the firm with the equity of the
firm (Hasan, Hossain & Habib, 2015).
Paraphrase This Document
Need a fresh take? Get an instant paraphrase of this document with our AI Paraphraser
7CAPITAL STRUCTURE ANALYSIS
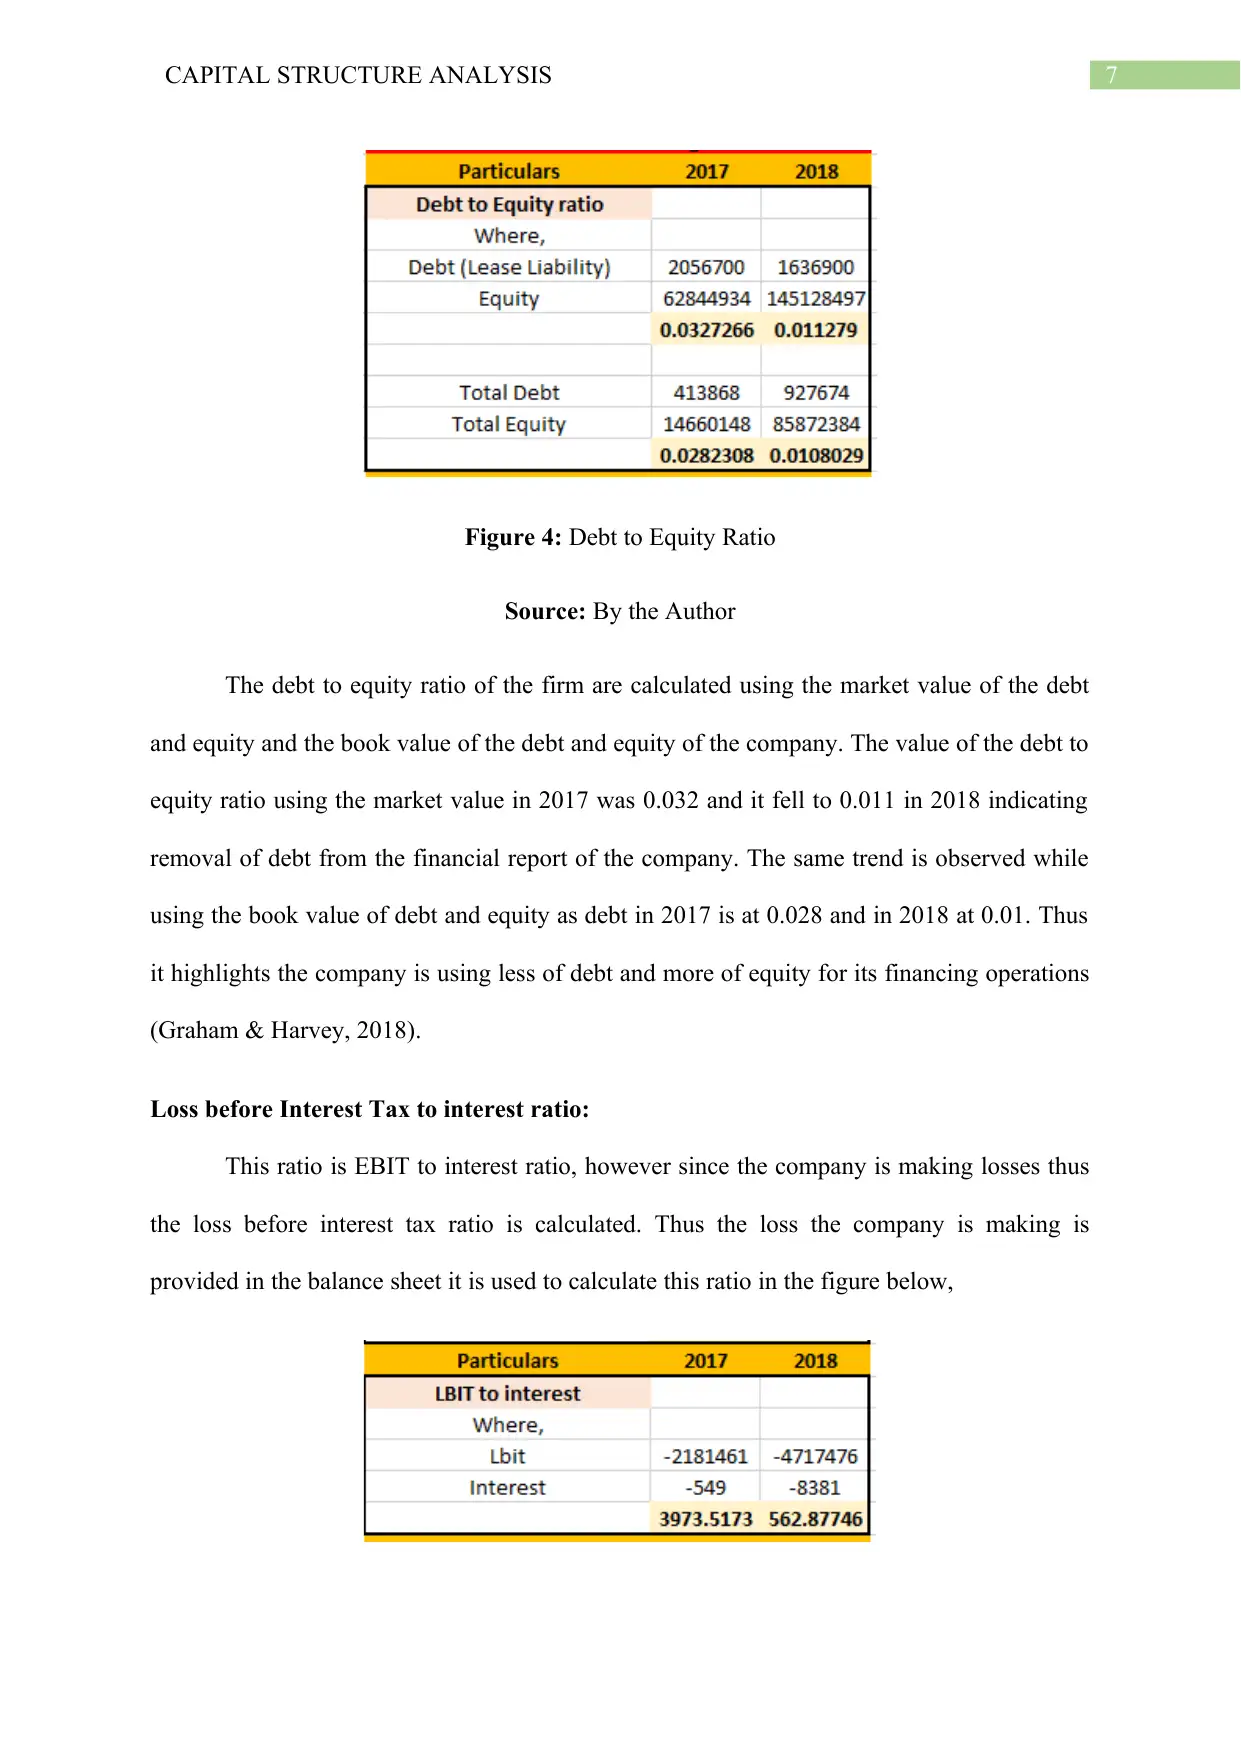
Figure 4: Debt to Equity Ratio
Source: By the Author
The debt to equity ratio of the firm are calculated using the market value of the debt
and equity and the book value of the debt and equity of the company. The value of the debt to
equity ratio using the market value in 2017 was 0.032 and it fell to 0.011 in 2018 indicating
removal of debt from the financial report of the company. The same trend is observed while
using the book value of debt and equity as debt in 2017 is at 0.028 and in 2018 at 0.01. Thus
it highlights the company is using less of debt and more of equity for its financing operations
(Graham & Harvey, 2018).
Loss before Interest Tax to interest ratio:
This ratio is EBIT to interest ratio, however since the company is making losses thus
the loss before interest tax ratio is calculated. Thus the loss the company is making is
provided in the balance sheet it is used to calculate this ratio in the figure below,
8CAPITAL STRUCTURE ANALYSIS
Figure 5: Loss before Interest and tax to interest ratio
Source: By the Author
This ratio in the year 2017 is at 3973 times and it has fallen to 562 in 2018 which is
bad as it shows the company has increased its interest expense and also the loss of the
company has also increased. Thus the company losses are increasing along with the interest
expense of the company (Frank & Shen 2016).
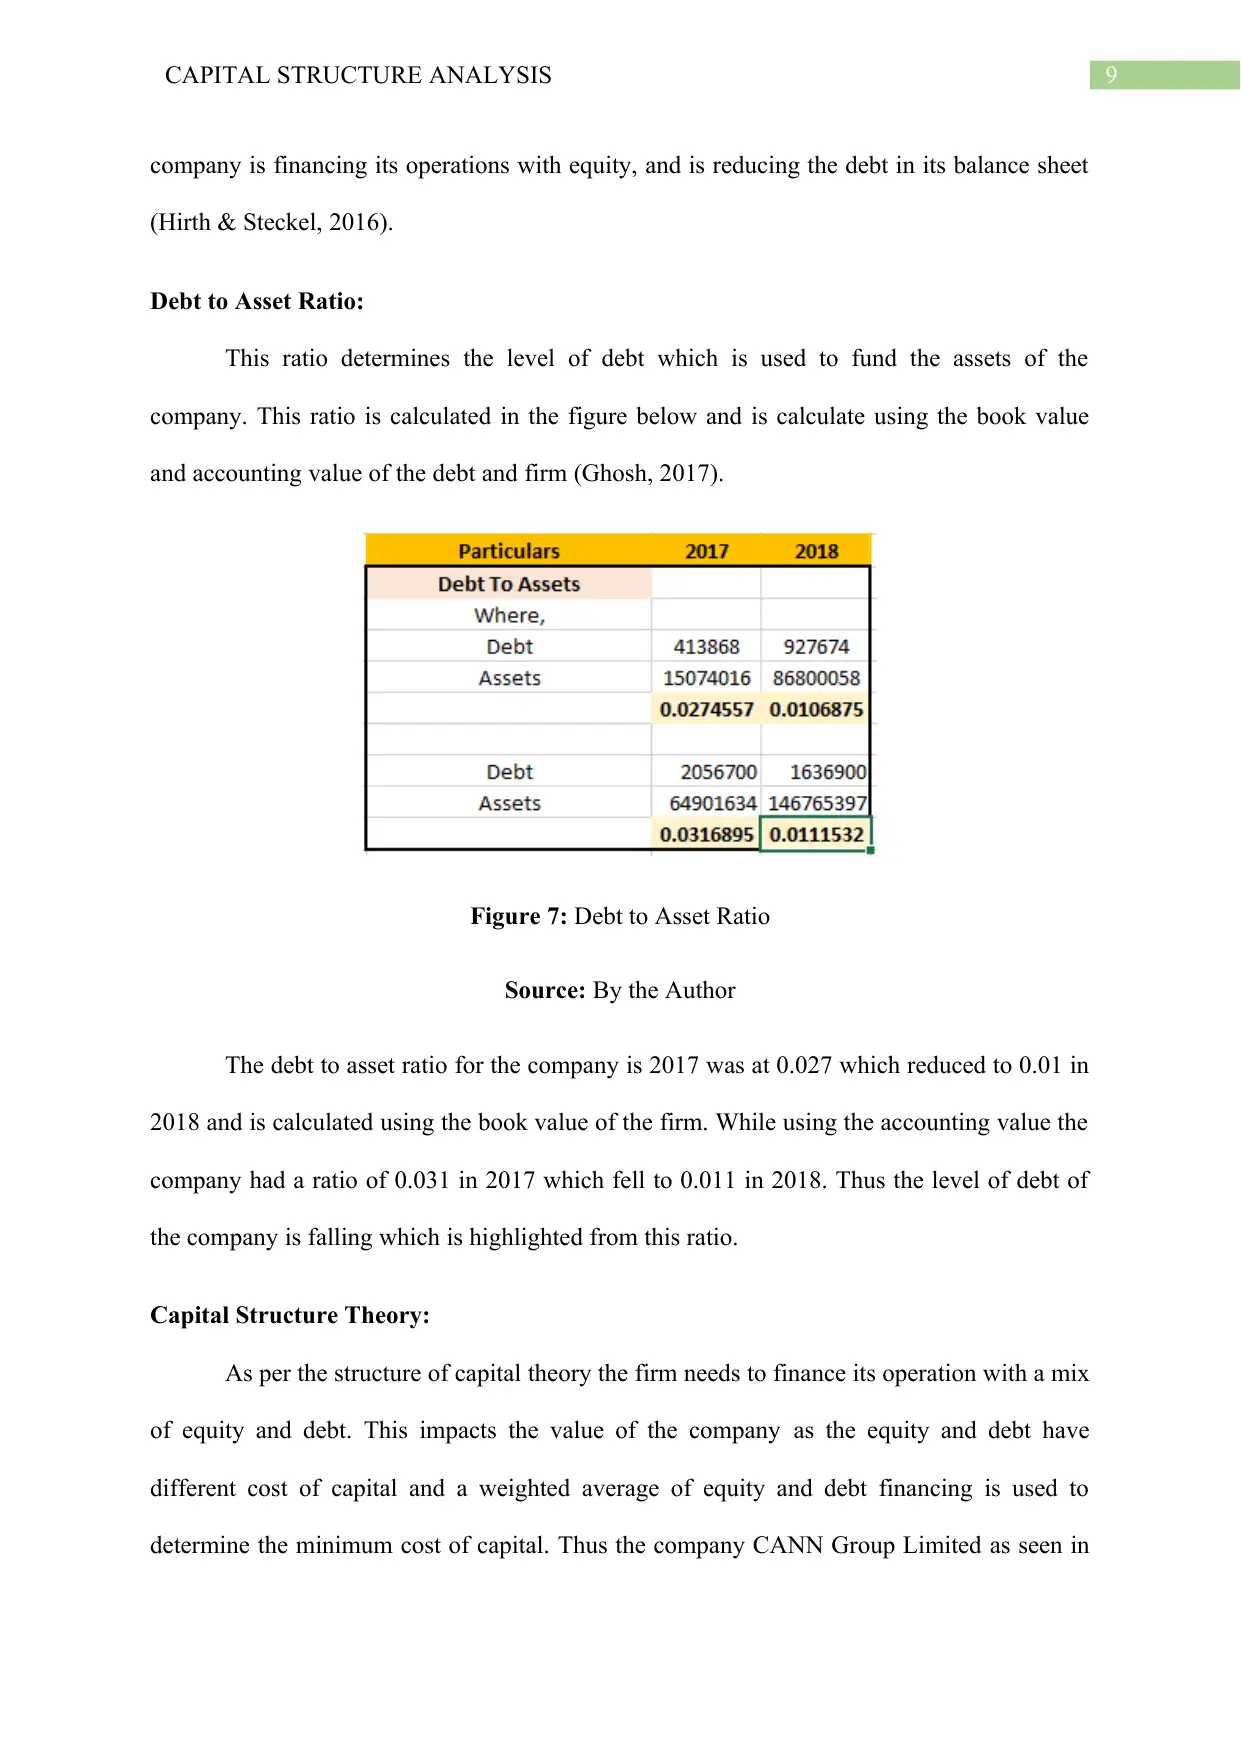
Equity to Assets ratio:
This ratio highlights the total assets which are funded by equity, thus it highlights the
ownership of the assets by the equity shareholders of the company. Thus this ratio of the
company is highlighted in the table below,
Figure 6: Equity to Assets Ratio
Source: By the Author
The company had a ratio of 0.97 in 2017 as per the book value of the company and it
has increased to 0.98 in 2018. Thus the company is primarily funded with equity and the level
of leverage in the company is miniscule which is further reduced in 2018. As per the market
value the company had a ratio of 0.96 in 2017 and it also increased to 0.98. Thus the
Figure 5: Loss before Interest and tax to interest ratio
Source: By the Author
This ratio in the year 2017 is at 3973 times and it has fallen to 562 in 2018 which is
bad as it shows the company has increased its interest expense and also the loss of the
company has also increased. Thus the company losses are increasing along with the interest
expense of the company (Frank & Shen 2016).
Equity to Assets ratio:
This ratio highlights the total assets which are funded by equity, thus it highlights the
ownership of the assets by the equity shareholders of the company. Thus this ratio of the
company is highlighted in the table below,
Figure 6: Equity to Assets Ratio
Source: By the Author
The company had a ratio of 0.97 in 2017 as per the book value of the company and it
has increased to 0.98 in 2018. Thus the company is primarily funded with equity and the level
of leverage in the company is miniscule which is further reduced in 2018. As per the market
value the company had a ratio of 0.96 in 2017 and it also increased to 0.98. Thus the
⊘ This is a preview!⊘
Do you want full access?
Subscribe today to unlock all pages.
Trusted by 1+ million students worldwide
9CAPITAL STRUCTURE ANALYSIS
company is financing its operations with equity, and is reducing the debt in its balance sheet
(Hirth & Steckel, 2016).
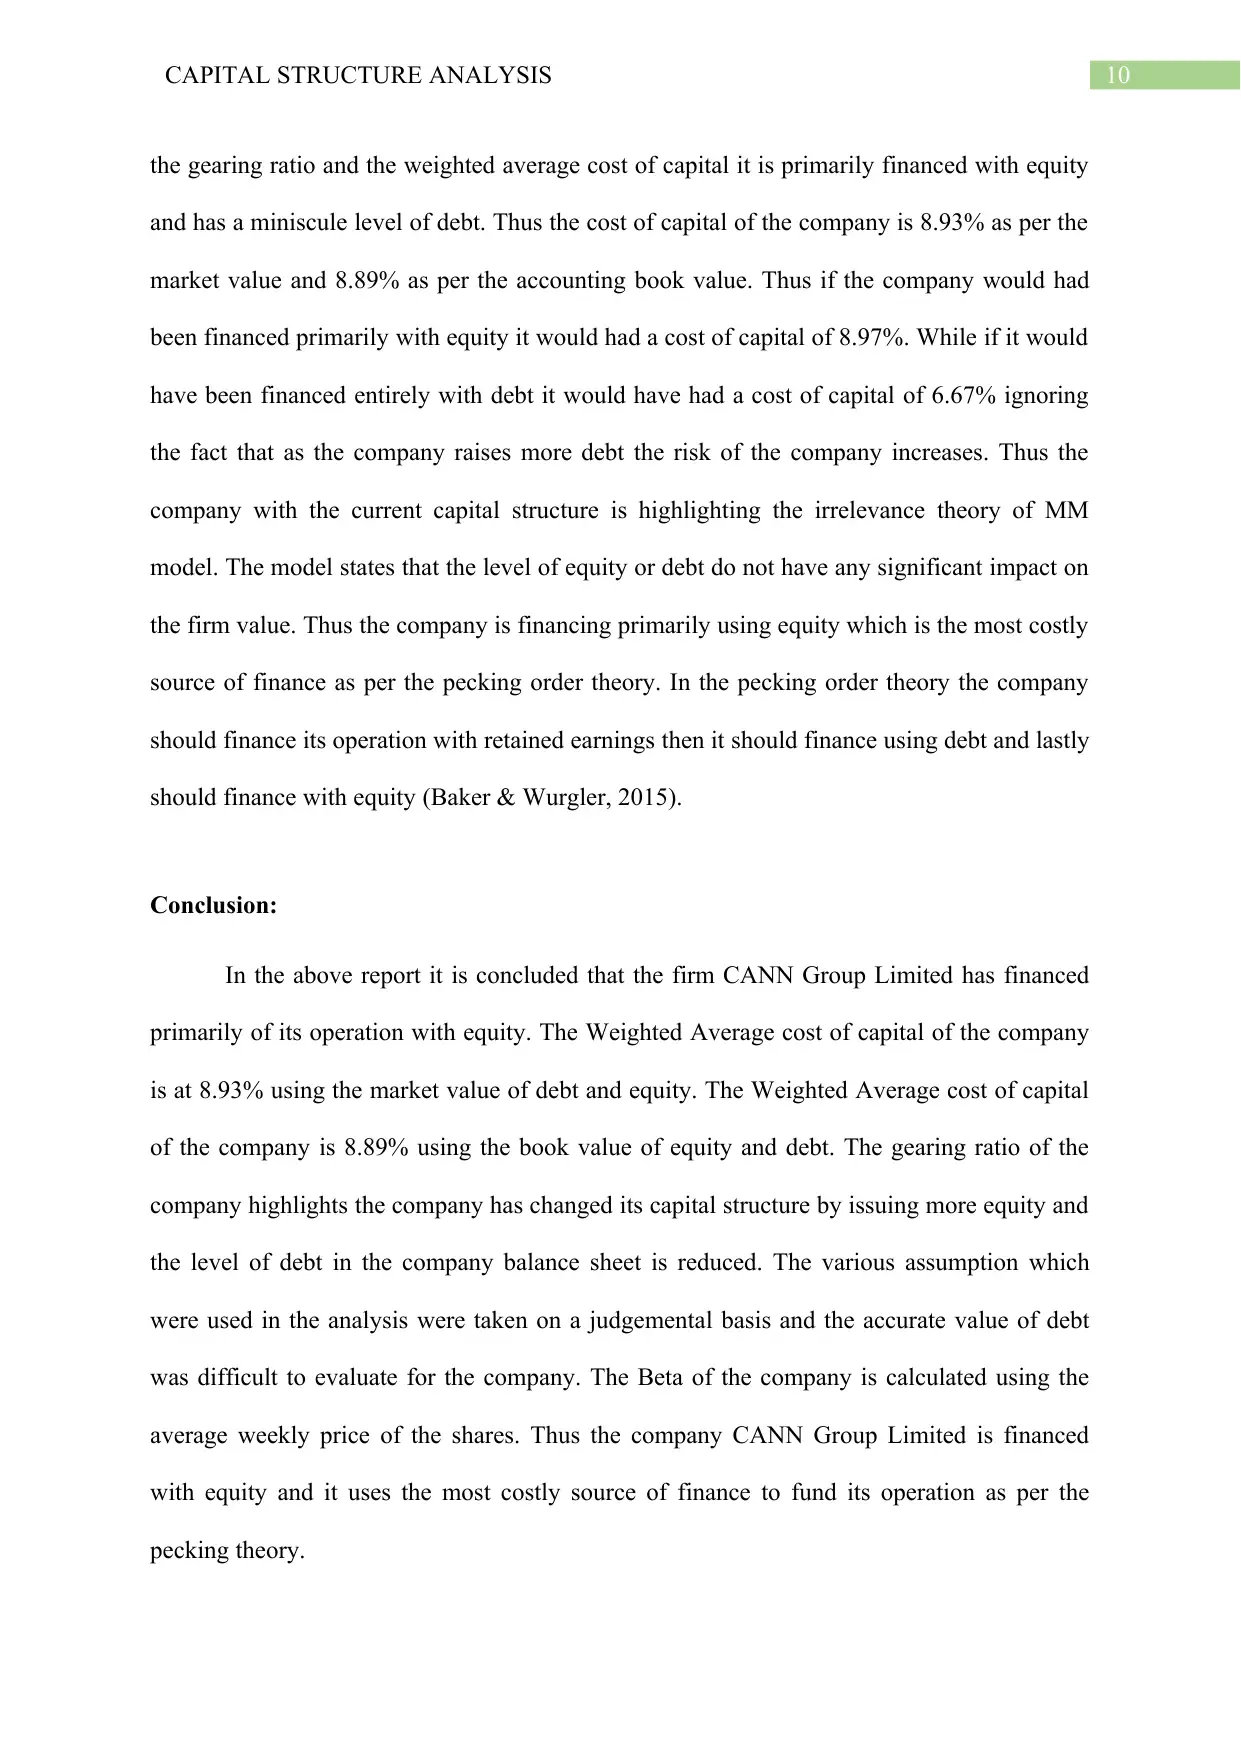
Debt to Asset Ratio:
This ratio determines the level of debt which is used to fund the assets of the
company. This ratio is calculated in the figure below and is calculate using the book value
and accounting value of the debt and firm (Ghosh, 2017).
Figure 7: Debt to Asset Ratio
Source: By the Author
The debt to asset ratio for the company is 2017 was at 0.027 which reduced to 0.01 in
2018 and is calculated using the book value of the firm. While using the accounting value the
company had a ratio of 0.031 in 2017 which fell to 0.011 in 2018. Thus the level of debt of
the company is falling which is highlighted from this ratio.
Capital Structure Theory:
As per the structure of capital theory the firm needs to finance its operation with a mix
of equity and debt. This impacts the value of the company as the equity and debt have
different cost of capital and a weighted average of equity and debt financing is used to
determine the minimum cost of capital. Thus the company CANN Group Limited as seen in
company is financing its operations with equity, and is reducing the debt in its balance sheet
(Hirth & Steckel, 2016).
Debt to Asset Ratio:
This ratio determines the level of debt which is used to fund the assets of the
company. This ratio is calculated in the figure below and is calculate using the book value
and accounting value of the debt and firm (Ghosh, 2017).
Figure 7: Debt to Asset Ratio
Source: By the Author
The debt to asset ratio for the company is 2017 was at 0.027 which reduced to 0.01 in
2018 and is calculated using the book value of the firm. While using the accounting value the
company had a ratio of 0.031 in 2017 which fell to 0.011 in 2018. Thus the level of debt of
the company is falling which is highlighted from this ratio.
Capital Structure Theory:
As per the structure of capital theory the firm needs to finance its operation with a mix
of equity and debt. This impacts the value of the company as the equity and debt have
different cost of capital and a weighted average of equity and debt financing is used to
determine the minimum cost of capital. Thus the company CANN Group Limited as seen in
Paraphrase This Document
Need a fresh take? Get an instant paraphrase of this document with our AI Paraphraser
10CAPITAL STRUCTURE ANALYSIS
the gearing ratio and the weighted average cost of capital it is primarily financed with equity
and has a miniscule level of debt. Thus the cost of capital of the company is 8.93% as per the
market value and 8.89% as per the accounting book value. Thus if the company would had
been financed primarily with equity it would had a cost of capital of 8.97%. While if it would
have been financed entirely with debt it would have had a cost of capital of 6.67% ignoring
the fact that as the company raises more debt the risk of the company increases. Thus the
company with the current capital structure is highlighting the irrelevance theory of MM
model. The model states that the level of equity or debt do not have any significant impact on
the firm value. Thus the company is financing primarily using equity which is the most costly
source of finance as per the pecking order theory. In the pecking order theory the company
should finance its operation with retained earnings then it should finance using debt and lastly
should finance with equity (Baker & Wurgler, 2015).
Conclusion:
In the above report it is concluded that the firm CANN Group Limited has financed
primarily of its operation with equity. The Weighted Average cost of capital of the company
is at 8.93% using the market value of debt and equity. The Weighted Average cost of capital
of the company is 8.89% using the book value of equity and debt. The gearing ratio of the
company highlights the company has changed its capital structure by issuing more equity and
the level of debt in the company balance sheet is reduced. The various assumption which
were used in the analysis were taken on a judgemental basis and the accurate value of debt
was difficult to evaluate for the company. The Beta of the company is calculated using the
average weekly price of the shares. Thus the company CANN Group Limited is financed
with equity and it uses the most costly source of finance to fund its operation as per the
pecking theory.
11CAPITAL STRUCTURE ANALYSIS
Recommendation:
The following recommendation are provided to the board which will highlight the
capital structure of the company.
The company has a capital structure which primarily consist of equity, which is the
costliest source of finance.
The debt of the company is very miniscule and the company can reduce its cost of
capital by incorporating more debt.
The current capital structure of the company is not the optimal capital structure and
the company should enhance debt to reach the optimal capital structure.
⊘ This is a preview!⊘
Do you want full access?
Subscribe today to unlock all pages.
Trusted by 1+ million students worldwide
1 out of 14
Related Documents


Your All-in-One AI-Powered Toolkit for Academic Success.
+13062052269
info@desklib.com
Available 24*7 on WhatsApp / Email
![[object Object]](/_next/static/media/star-bottom.7253800d.svg)
Unlock your academic potential
Copyright © 2020–2026 A2Z Services. All Rights Reserved. Developed and managed by ZUCOL.