Analysis of Cannondale Bicycle Design and Production Processes
VerifiedAdded on 2020/03/16
|37
|7213
|73
Report
AI Summary
This report provides a detailed analysis of the design and production of Cannondale bicycles, focusing on a battery-operated model. It begins with an executive summary and table of contents, followed by an introduction to the bicycle's evolution and the company's background. The report then explores customer satisfaction through stakeholder analysis, capturing customer needs using the Kano model, and various data collection methods. Design requirements are discussed, including converting customer needs into design specifications and design risk analysis. The report further covers supplier selection, component identification, and the development of selection criteria. Statistical process control (SPC) is analyzed, including process identification, monitoring, and chart construction. Finally, problem-solving techniques are presented, covering shortcomings, brainstorming, and the use of why-why diagrams and check sheets. The report concludes with a reference list.

Design and Production of Personnel and Burden Carrier
Name of the student
Student Roll No:
Name of the University
Author Note
Name of the student
Student Roll No:
Name of the University
Author Note
Paraphrase This Document
Need a fresh take? Get an instant paraphrase of this document with our AI Paraphraser

1
Executive Summary:
The study aims to revolve around Cannondale cycle which battery powered and available in
the market to the general users. The main aspect of the study has been able to suggest on the
different types of the ways the product can be manufactured and sold to the respective
consumers.
Executive Summary:
The study aims to revolve around Cannondale cycle which battery powered and available in
the market to the general users. The main aspect of the study has been able to suggest on the
different types of the ways the product can be manufactured and sold to the respective
consumers.
2
Table of Contents
1.0 Introduction:.........................................................................................................................4
2.0 Customer Satisfaction:.........................................................................................................6
2.1. Stakeholders Analysis:....................................................................................................6
2.2. Capturing the Customer:.................................................................................................8
2.3 Customer Needs Analysis through Kano Model:...........................................................11
3.0 Requirement of Design:.....................................................................................................17
3.1. Convert Customer Needs into Design needs.................................................................17
3.2. Design Risk Analysis:...................................................................................................20
4.0 Supplier choice and Evaluation:.........................................................................................23
4.1. Identifying the Components, Elements and Parts:........................................................23
4.2. Developing the Criteria for Supplier Selection;............................................................24
4.3. Usage and Construction of Supplier Selection System:................................................24
4.4. End Outcome of Supplier Selection Process:................................................................26
5.0: Statistical Process Control................................................................................................27
5.1 Process for Identification...............................................................................................27
5.2 Monitor Processing and SPC Charts..............................................................................28
5.3 SPC Chart Construction.................................................................................................31
6.0. Problem Solving:...............................................................................................................33
6.1. Recognizing the Shortcomings and Solving Tools:......................................................33
Structure and Relevance of shortcomings for the Remedies...............................................34
⊘ This is a preview!⊘
Do you want full access?
Subscribe today to unlock all pages.
Trusted by 1+ million students worldwide

3
Analyzing by experts (Brainstorming).................................................................................34
Answering why! (Why-Why diagram)................................................................................35
Preparing a Check-Sheet......................................................................................................35
Reference List..........................................................................................................................37
Paraphrase This Document
Need a fresh take? Get an instant paraphrase of this document with our AI Paraphraser
4
1.0 Introduction:
The different types of the context of the report have been able to focus on the
operations of Cannondale Bicycle based in Australia. A bicycle mechanism mainly involves
human powered pedal, single track vehicle. With time the bicycle has seen to undergo several
adaptation and improvement with the initiation of the machine. The various types of the
innovations has been further seen to led to the use of modern materials and the designs which
are seen to be aided by computers. This has been further seen to allow for the proliferation of
specialized bicycle which has depicted several types of the features along with improved
design and comfort in riding. “Cannondale Bicycle Corporation”, is discerned as an
“American division of Canadian conglomerate”. The company has been seen to be
headquartered at Wilton, Connecticut along with the several types of the manufacturing
assembly in China and Taichung, Taiwan (Dobrzykowski et al. 2014).
Dandy horse or Draisienne or Laufmaschine is known as the first human being to
invent the use of two wheels along with Baron Karl von Drais. Drais is responsible to
introduce first public bicycle in public in 1818. The types of the categorization of the bicycle
have been further seen to be based on the use of the gearing system and propulsion. Some of
the common types of the bicycle have been further seen to be based on the hybrid bicycles,
utility bicycles, racing bicycles and touring bicycles. The main discussion of the study will be
able to ensure both mechanical and biological terms. Bicycle designed will be most efficient
in terms of the transportation with energy and expectation to travel the distance. The
mechanical viewpoint has been further seen to save 99% of the energy delivered (Zhao
2014).
The study will focus on the operation of a newly designed battery operated bicycle.
This has been identified as the cordless version of Cannondale which has been seen to be
5
made from hard plastic. The main designs of such an engine will device 20V lithium ion
battery. This will allow a speed of 82 MPH, with max air speed. This has been further
identified to provide 146 CFM of the total air volume. Cannondale will be able to offer dual
speed air flow control to regulate the total amount of the pressure needed for working. The
soft grip of the bicycle will be able to provide the users with a comfortable riding experience
(Phan and Chambers 2013).
It has been further seen that the 2A battery will be able to be recharged for providing
power to the engine. The various types of the accessories of the bicycle engine has been seen
to be composed of a nozzle attachment kit. The battery will be taking a total time of 75
minutes for recharging. The over product has been identified to be small and user friendly.
The small kids of even 12-13 years will be also suitable to use the cycle. The motor attached
has been identified as best on class which will be able to provide optimum efficiency. The
20V powered drive engine has been identified as best in class among the cycle
manufacturers. The air flow adjustments will be also able to offer the best service to the
company. The different types of the reviews have been able to obtain the different types of
the functionality and the reliability of the bicycles. The selected company has been further
identified as the reviewing sites which will be able to provide the appropriate functionality
and reliability of the product designed. The company has been itself able to earn a reputable
position for the different types of the research and the designing of the various types the
designs of new line of product has put lots of research and investment. The features of the
product have been further identified to be the best in class and reliable motor. Also the
overall cycle has been designed to be light weighted and easy for use (Katsikopoulos and
Gigerenzer 2013).
⊘ This is a preview!⊘
Do you want full access?
Subscribe today to unlock all pages.
Trusted by 1+ million students worldwide
6
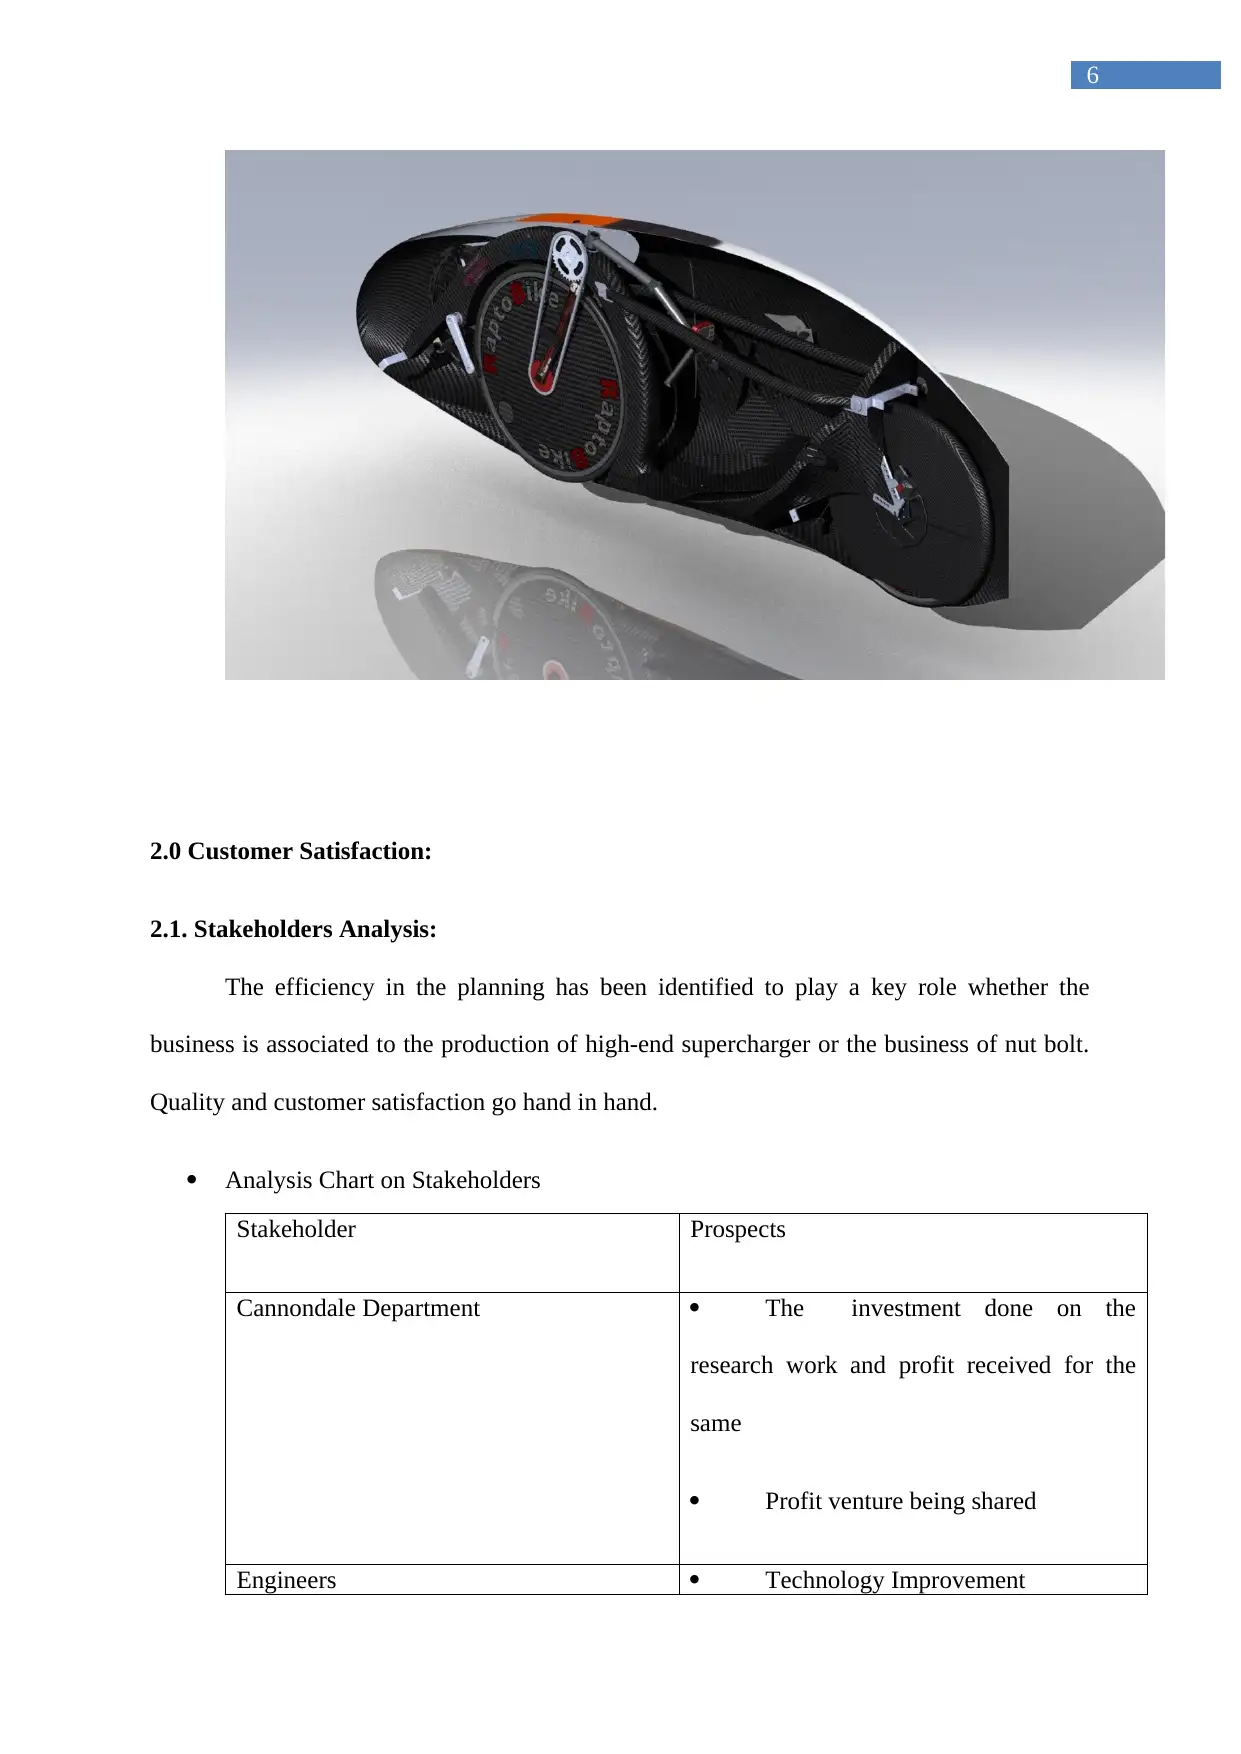
2.0 Customer Satisfaction:
2.1. Stakeholders Analysis:
The efficiency in the planning has been identified to play a key role whether the
business is associated to the production of high-end supercharger or the business of nut bolt.
Quality and customer satisfaction go hand in hand.
Analysis Chart on Stakeholders
Stakeholder Prospects
Cannondale Department The investment done on the
research work and profit received for the
same
Profit venture being shared
Engineers Technology Improvement
Paraphrase This Document
Need a fresh take? Get an instant paraphrase of this document with our AI Paraphraser
7
Enhancement along with the high
investment
Shareholders Investment and Profit
New innovation in technology
Employees Safety aspect in the working
environment
Employment status achieved
through increased demand
End User Toughness and reliability in the
product
Increased value for money
Suppliers Improved demand for promotion of
the business needs
Key providers of business and profit
Retailer Consistent and dependable products
Timely product deliverance
Competitors Value of the competitors product
reduced
Old technology to lower the
8
preference
Concern Groups (World care,
Environment, Human)
Enhancement of tech group for
sustainability
Usage of eco-friendly goods
Government Supervisors Compliance to minimum service
contract periods of the product.
Adherence to current end user
principles
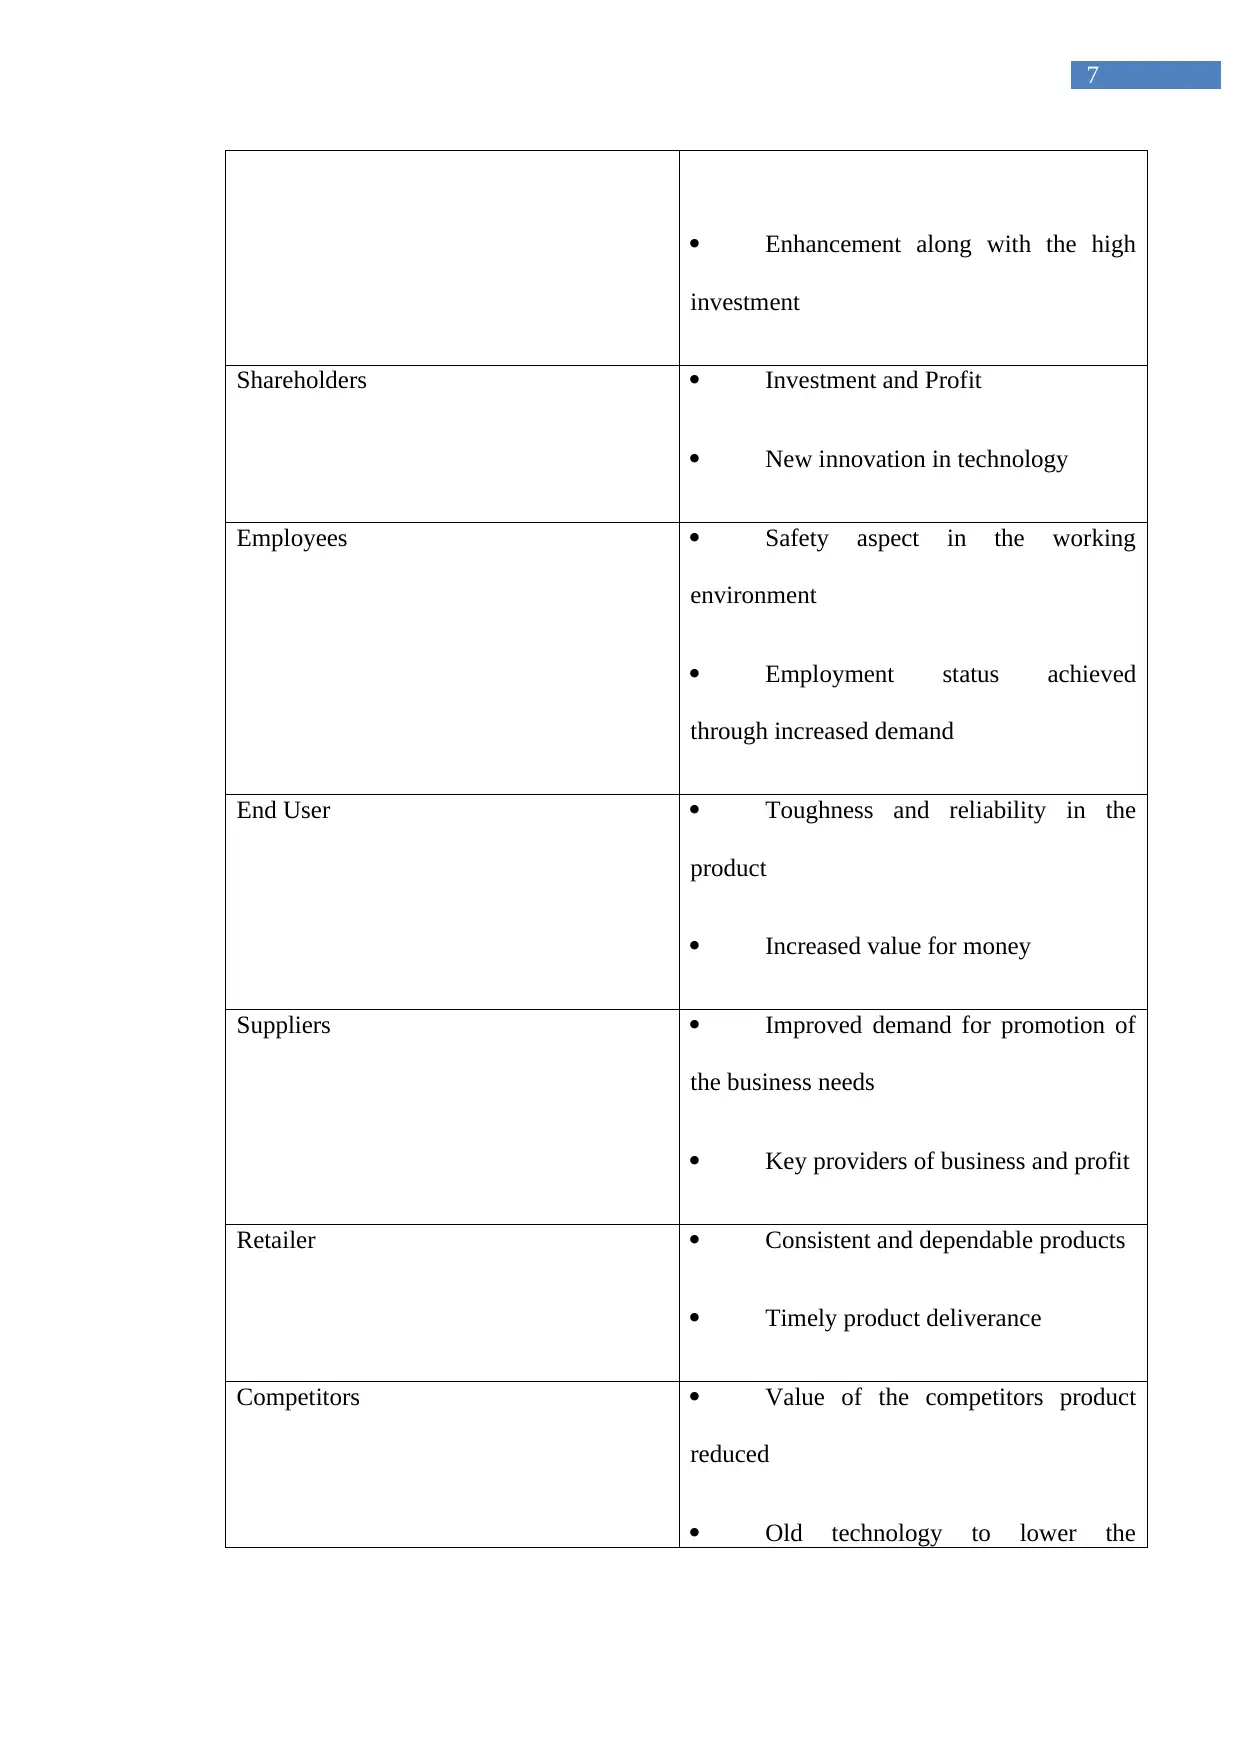
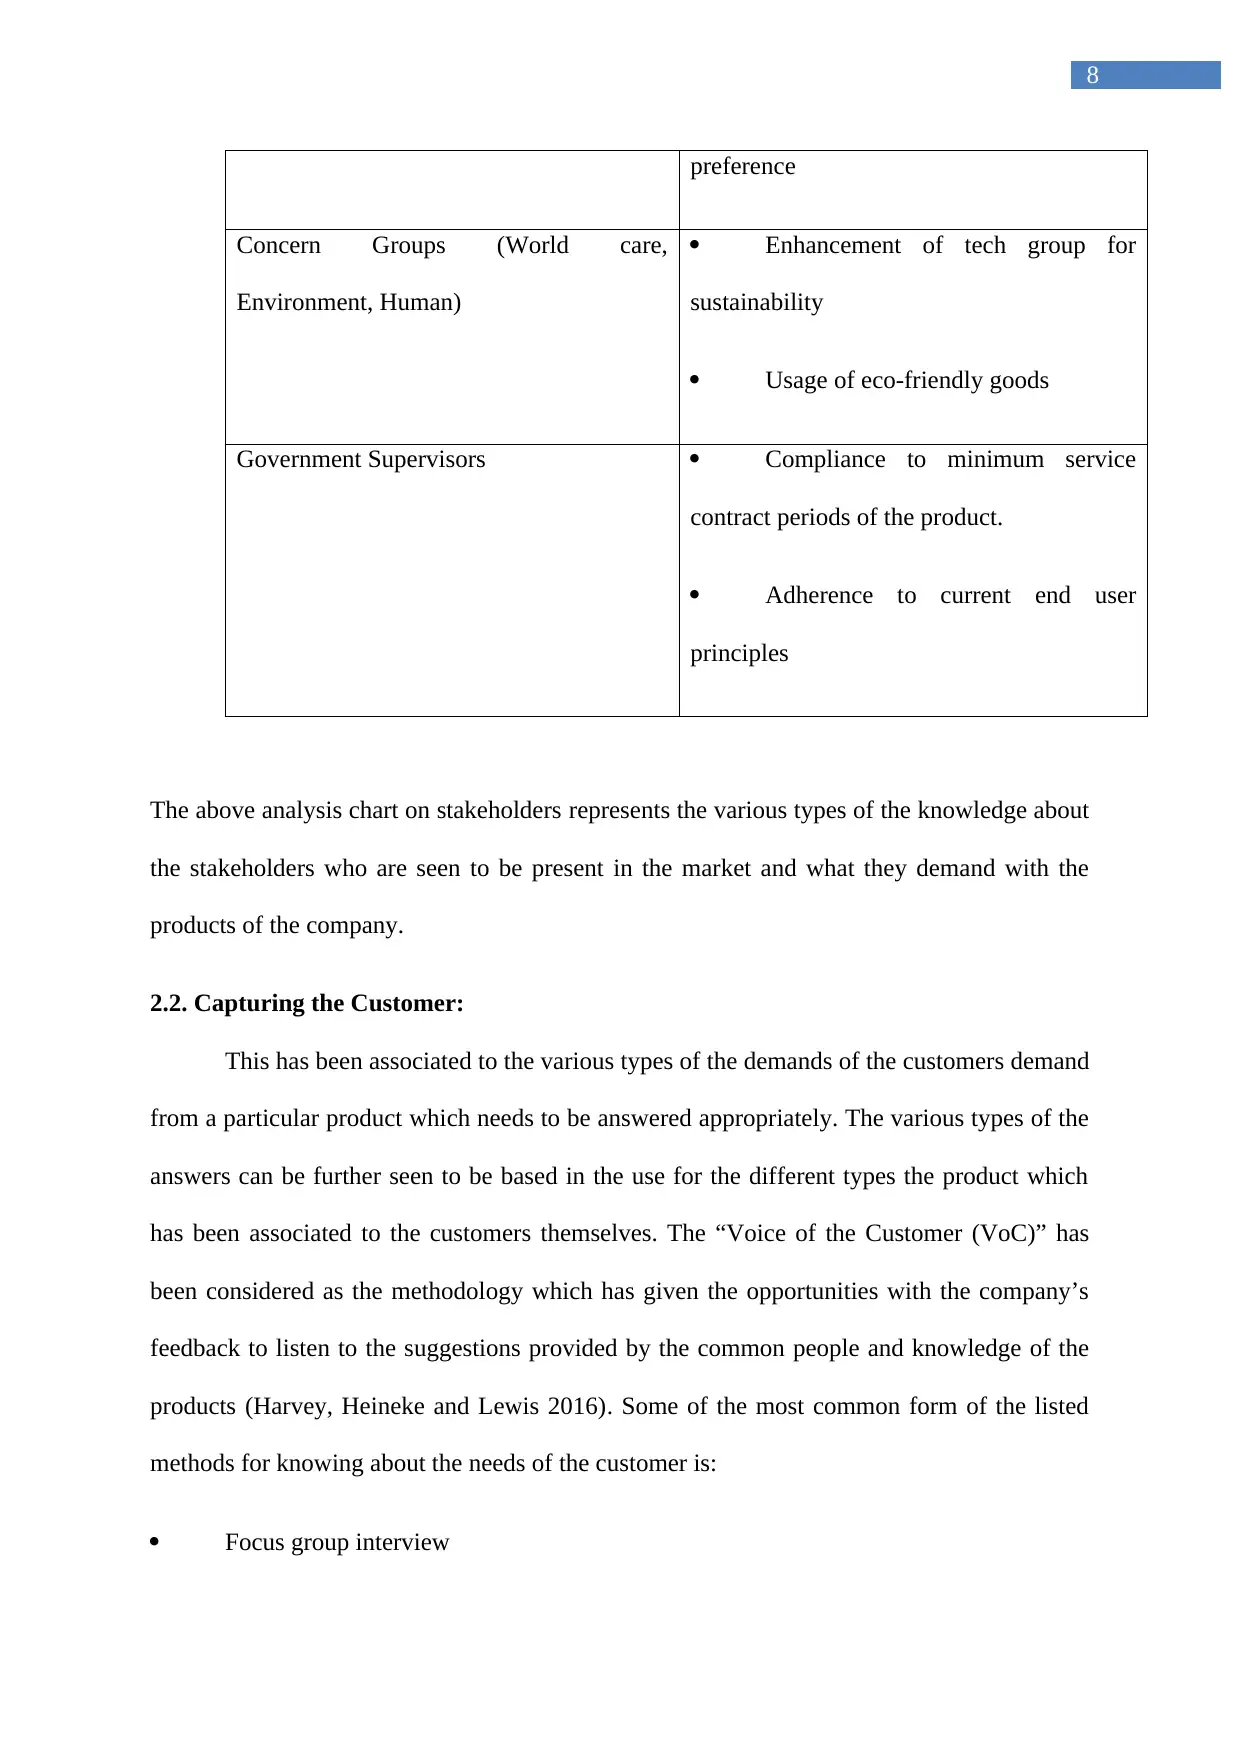
The above analysis chart on stakeholders represents the various types of the knowledge about
the stakeholders who are seen to be present in the market and what they demand with the
products of the company.
2.2. Capturing the Customer:
This has been associated to the various types of the demands of the customers demand
from a particular product which needs to be answered appropriately. The various types of the
answers can be further seen to be based in the use for the different types the product which
has been associated to the customers themselves. The “Voice of the Customer (VoC)” has
been considered as the methodology which has given the opportunities with the company’s
feedback to listen to the suggestions provided by the common people and knowledge of the
products (Harvey, Heineke and Lewis 2016). Some of the most common form of the listed
methods for knowing about the needs of the customer is:
Focus group interview
preference
Concern Groups (World care,
Environment, Human)
Enhancement of tech group for
sustainability
Usage of eco-friendly goods
Government Supervisors Compliance to minimum service
contract periods of the product.
Adherence to current end user
principles
The above analysis chart on stakeholders represents the various types of the knowledge about
the stakeholders who are seen to be present in the market and what they demand with the
products of the company.
2.2. Capturing the Customer:
This has been associated to the various types of the demands of the customers demand
from a particular product which needs to be answered appropriately. The various types of the
answers can be further seen to be based in the use for the different types the product which
has been associated to the customers themselves. The “Voice of the Customer (VoC)” has
been considered as the methodology which has given the opportunities with the company’s
feedback to listen to the suggestions provided by the common people and knowledge of the
products (Harvey, Heineke and Lewis 2016). Some of the most common form of the listed
methods for knowing about the needs of the customer is:
Focus group interview
⊘ This is a preview!⊘
Do you want full access?
Subscribe today to unlock all pages.
Trusted by 1+ million students worldwide
9
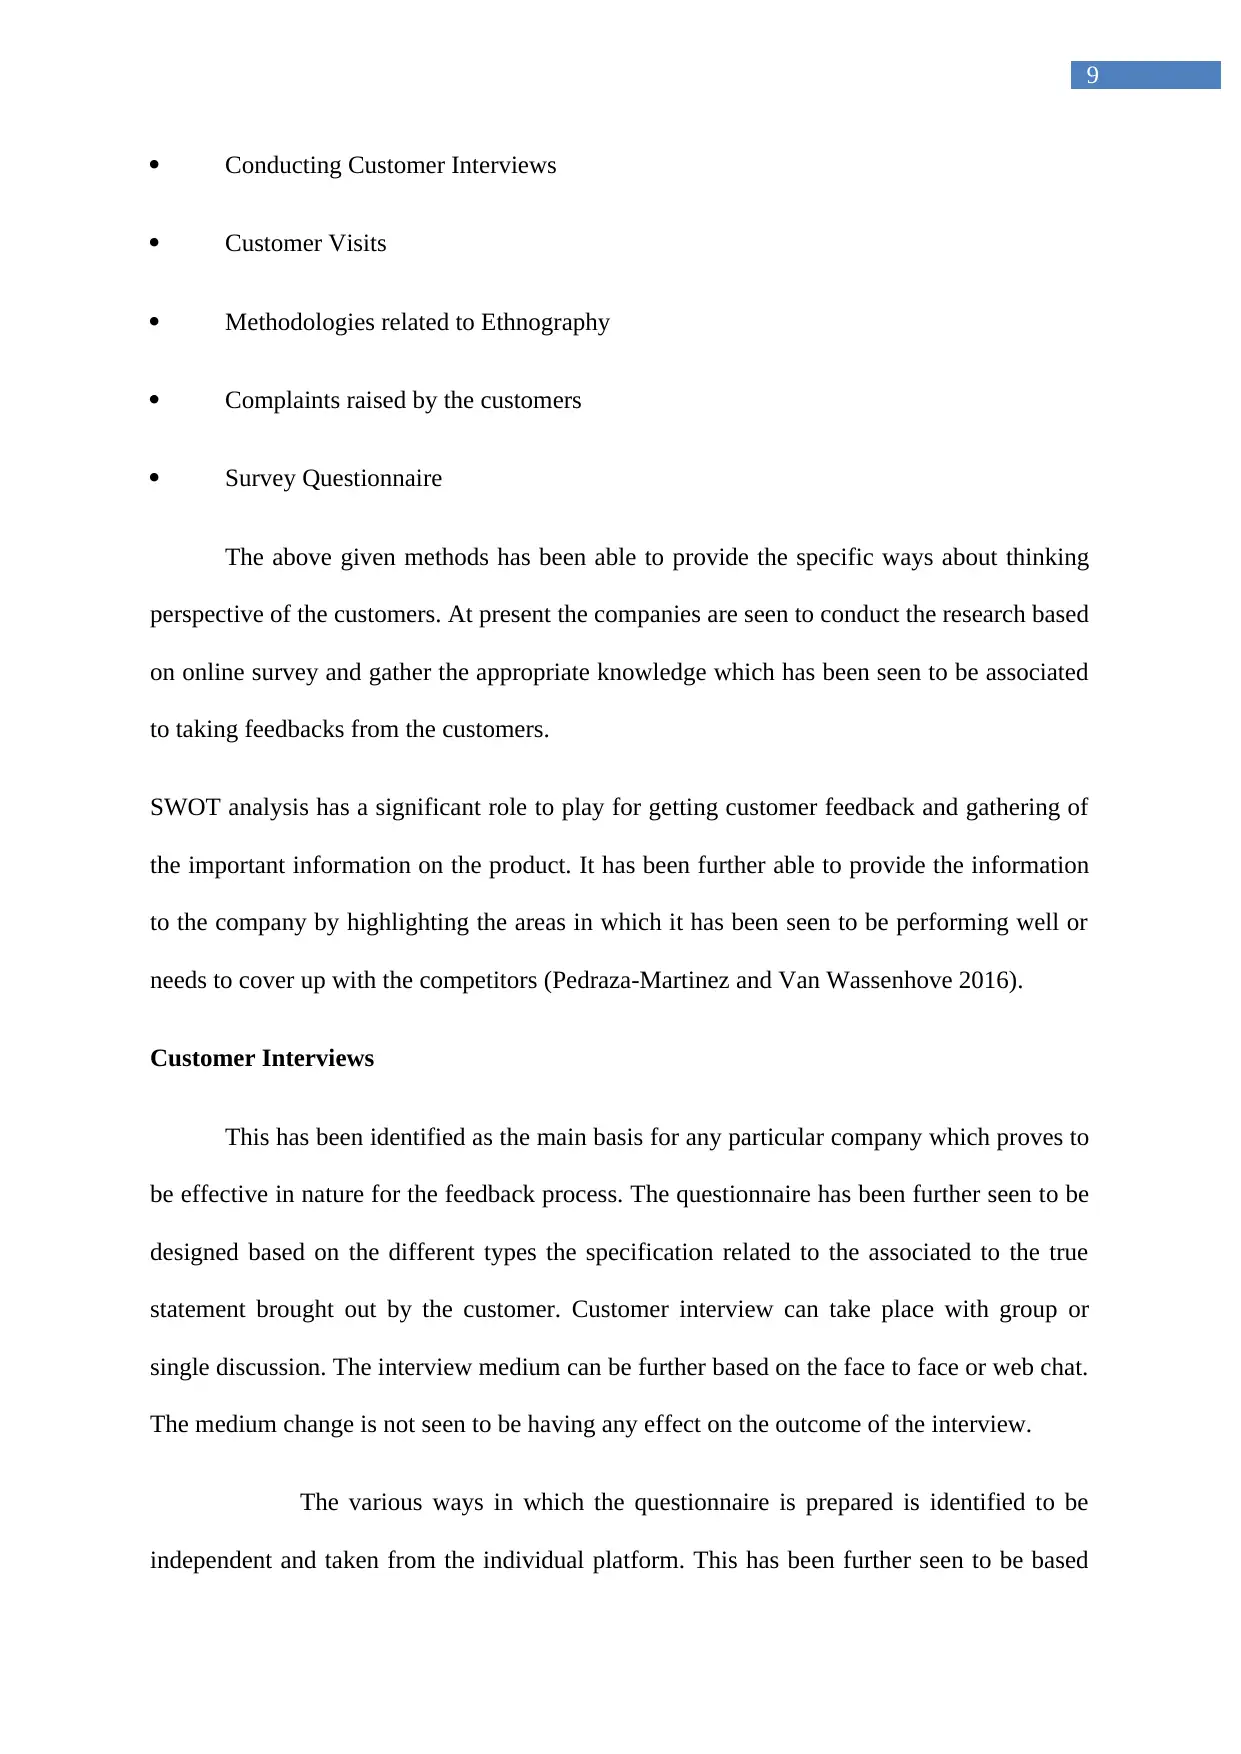
Conducting Customer Interviews
Customer Visits
Methodologies related to Ethnography
Complaints raised by the customers
Survey Questionnaire
The above given methods has been able to provide the specific ways about thinking
perspective of the customers. At present the companies are seen to conduct the research based
on online survey and gather the appropriate knowledge which has been seen to be associated
to taking feedbacks from the customers.
SWOT analysis has a significant role to play for getting customer feedback and gathering of
the important information on the product. It has been further able to provide the information
to the company by highlighting the areas in which it has been seen to be performing well or
needs to cover up with the competitors (Pedraza-Martinez and Van Wassenhove 2016).
Customer Interviews
This has been identified as the main basis for any particular company which proves to
be effective in nature for the feedback process. The questionnaire has been further seen to be
designed based on the different types the specification related to the associated to the true
statement brought out by the customer. Customer interview can take place with group or
single discussion. The interview medium can be further based on the face to face or web chat.
The medium change is not seen to be having any effect on the outcome of the interview.
The various ways in which the questionnaire is prepared is identified to be
independent and taken from the individual platform. This has been further seen to be based
Paraphrase This Document
Need a fresh take? Get an instant paraphrase of this document with our AI Paraphraser
10
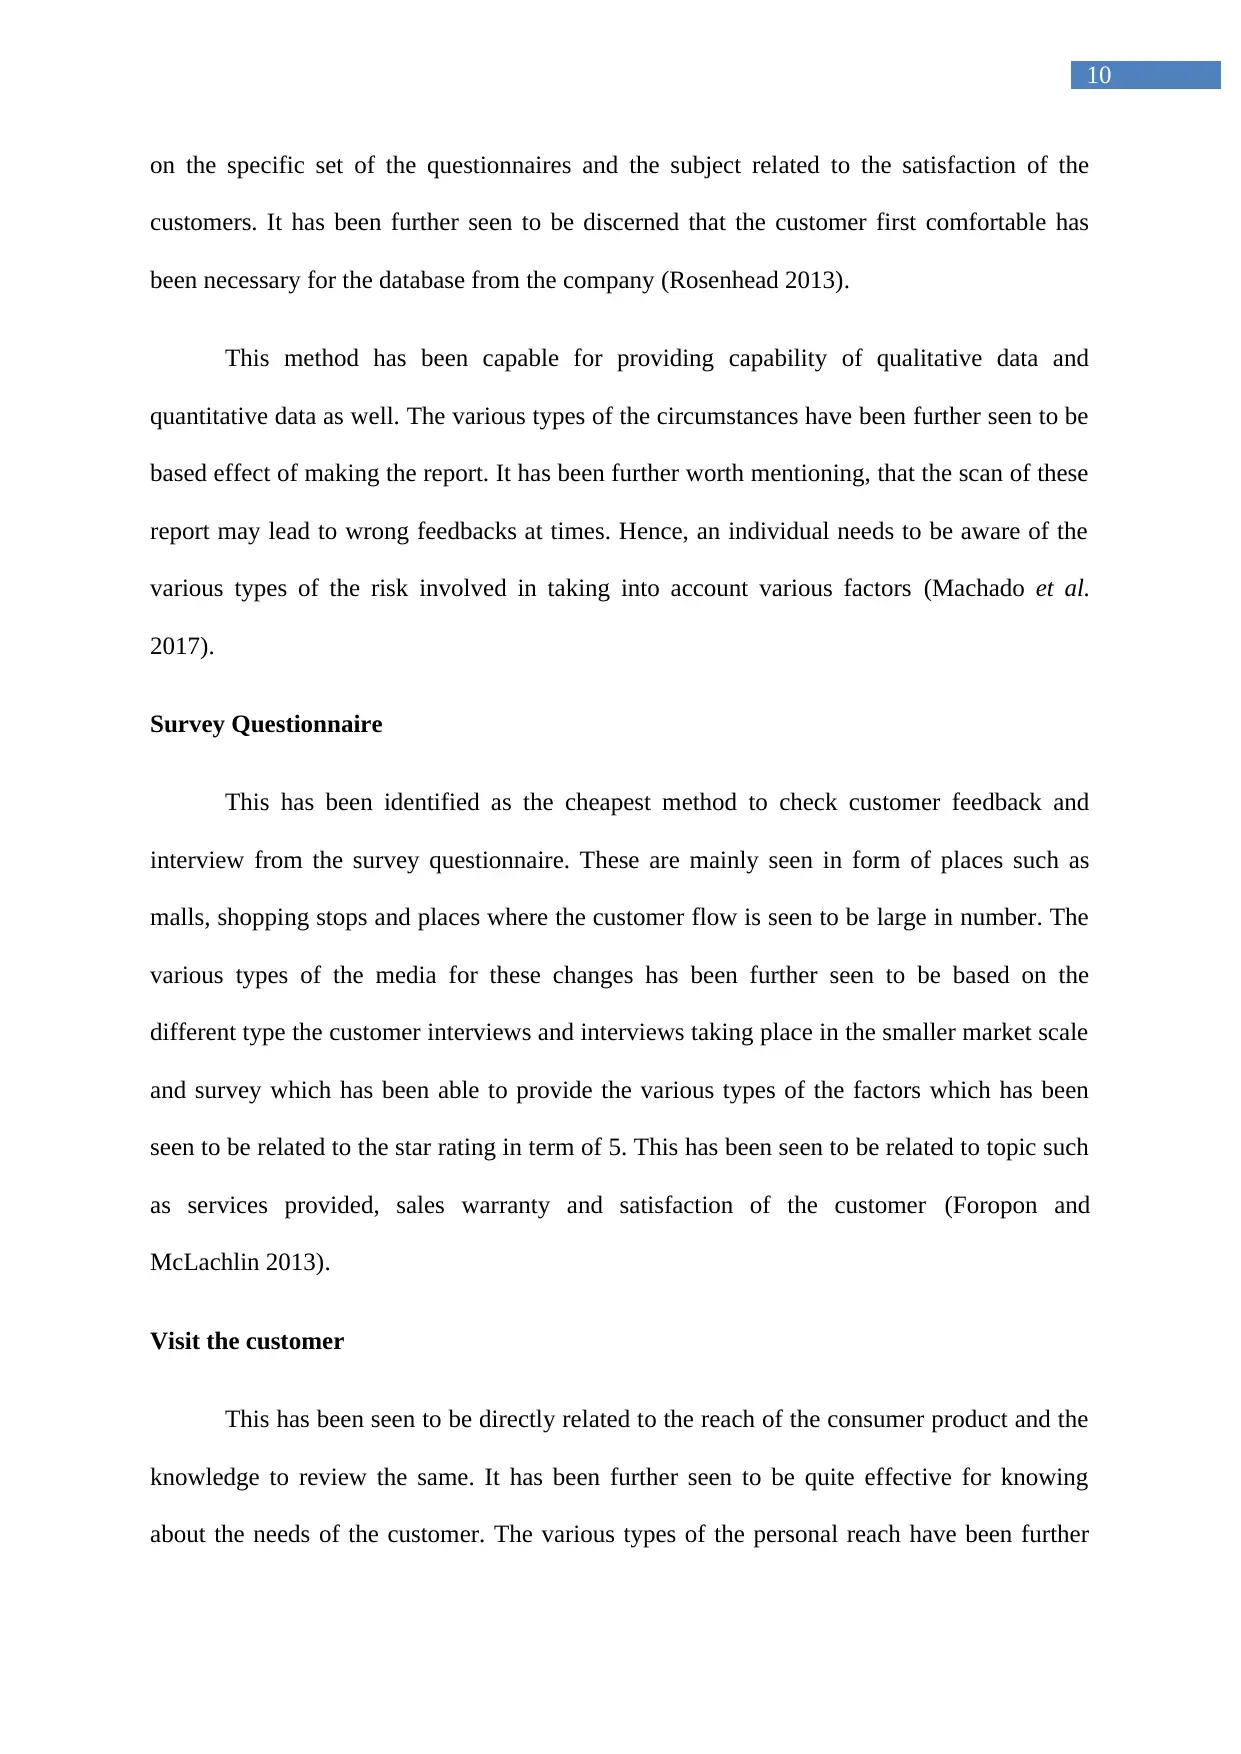
on the specific set of the questionnaires and the subject related to the satisfaction of the
customers. It has been further seen to be discerned that the customer first comfortable has
been necessary for the database from the company (Rosenhead 2013).
This method has been capable for providing capability of qualitative data and
quantitative data as well. The various types of the circumstances have been further seen to be
based effect of making the report. It has been further worth mentioning, that the scan of these
report may lead to wrong feedbacks at times. Hence, an individual needs to be aware of the
various types of the risk involved in taking into account various factors (Machado et al.
2017).
Survey Questionnaire
This has been identified as the cheapest method to check customer feedback and
interview from the survey questionnaire. These are mainly seen in form of places such as
malls, shopping stops and places where the customer flow is seen to be large in number. The
various types of the media for these changes has been further seen to be based on the
different type the customer interviews and interviews taking place in the smaller market scale
and survey which has been able to provide the various types of the factors which has been
seen to be related to the star rating in term of 5. This has been seen to be related to topic such
as services provided, sales warranty and satisfaction of the customer (Foropon and
McLachlin 2013).
Visit the customer
This has been seen to be directly related to the reach of the consumer product and the
knowledge to review the same. It has been further seen to be quite effective for knowing
about the needs of the customer. The various types of the personal reach have been further
11
seen to be based on the different types of the evaluation which has been seen to be based on
customer assurance of the reliability and trust. This practice has been discerned to be time
consuming in nature. It has been further discerned to be subjective and wrong at times (Guide
and Ketokivi 2015).
Focus Groups
This is seen to be based majorly on the survey results of the interview. The focus
group has seen with 5-8 members so that they will be able to assist on the opinion of the
product or services. The individuals are further seen to procure the various types of the
reports from the participant and the qualitative data of the organization. The various
participants involve the survey to discuss on the views on the products. The “Open minded
questions” are useful to get rid of all burden. This has been seen to be different from the
formal report and the interviews which can provide honest review from the customers
(Shepherd and Patzelt 2013).
Ethnographic Methods
The various types of the Ethnographic methods is seen to be effective to capture the
requirements from the customers view. These interviewing methods have been able to
contrast with the interviews and the recording of the activities to interpret the body language
and understand it in a better way. The context with this has been seen with the various types
of the unfamiliar aspects to the customers and this won’t be able to act artificially and in an
honest manner (Bromiley and Rau 2016).
2.3 Customer Needs Analysis through Kano Model:
This can be captured based on the conduction of survey questionnaire. This particular
aspect has been further identified with a 5-step process illustrated below as follows:
⊘ This is a preview!⊘
Do you want full access?
Subscribe today to unlock all pages.
Trusted by 1+ million students worldwide
1 out of 37
Related Documents


Your All-in-One AI-Powered Toolkit for Academic Success.
+13062052269
info@desklib.com
Available 24*7 on WhatsApp / Email
![[object Object]](/_next/static/media/star-bottom.7253800d.svg)
Unlock your academic potential
Copyright © 2020–2026 A2Z Services. All Rights Reserved. Developed and managed by ZUCOL.