CapCo Financial Analysis: Part I and II Homework Assignment Solution
VerifiedAdded on 2019/09/16
|6
|1489
|298
Homework Assignment
AI Summary
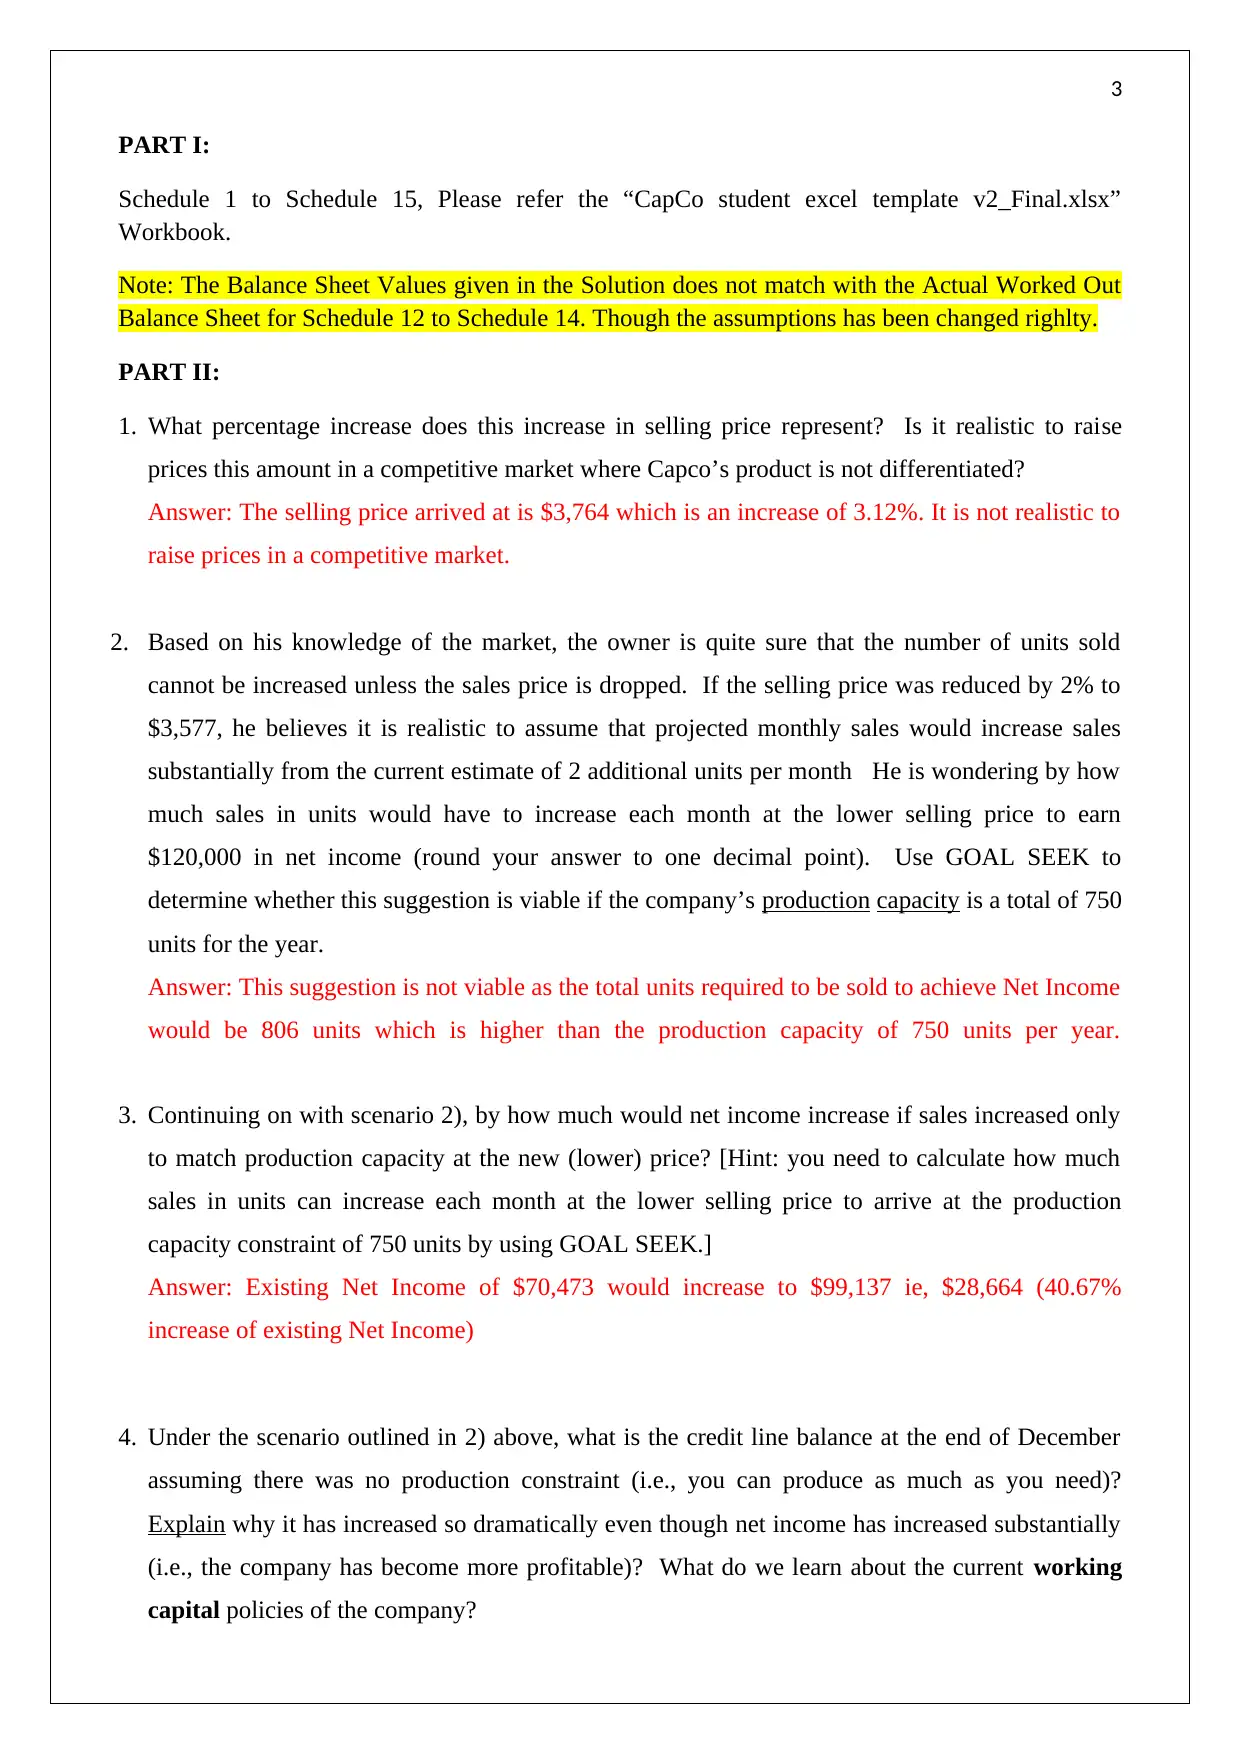
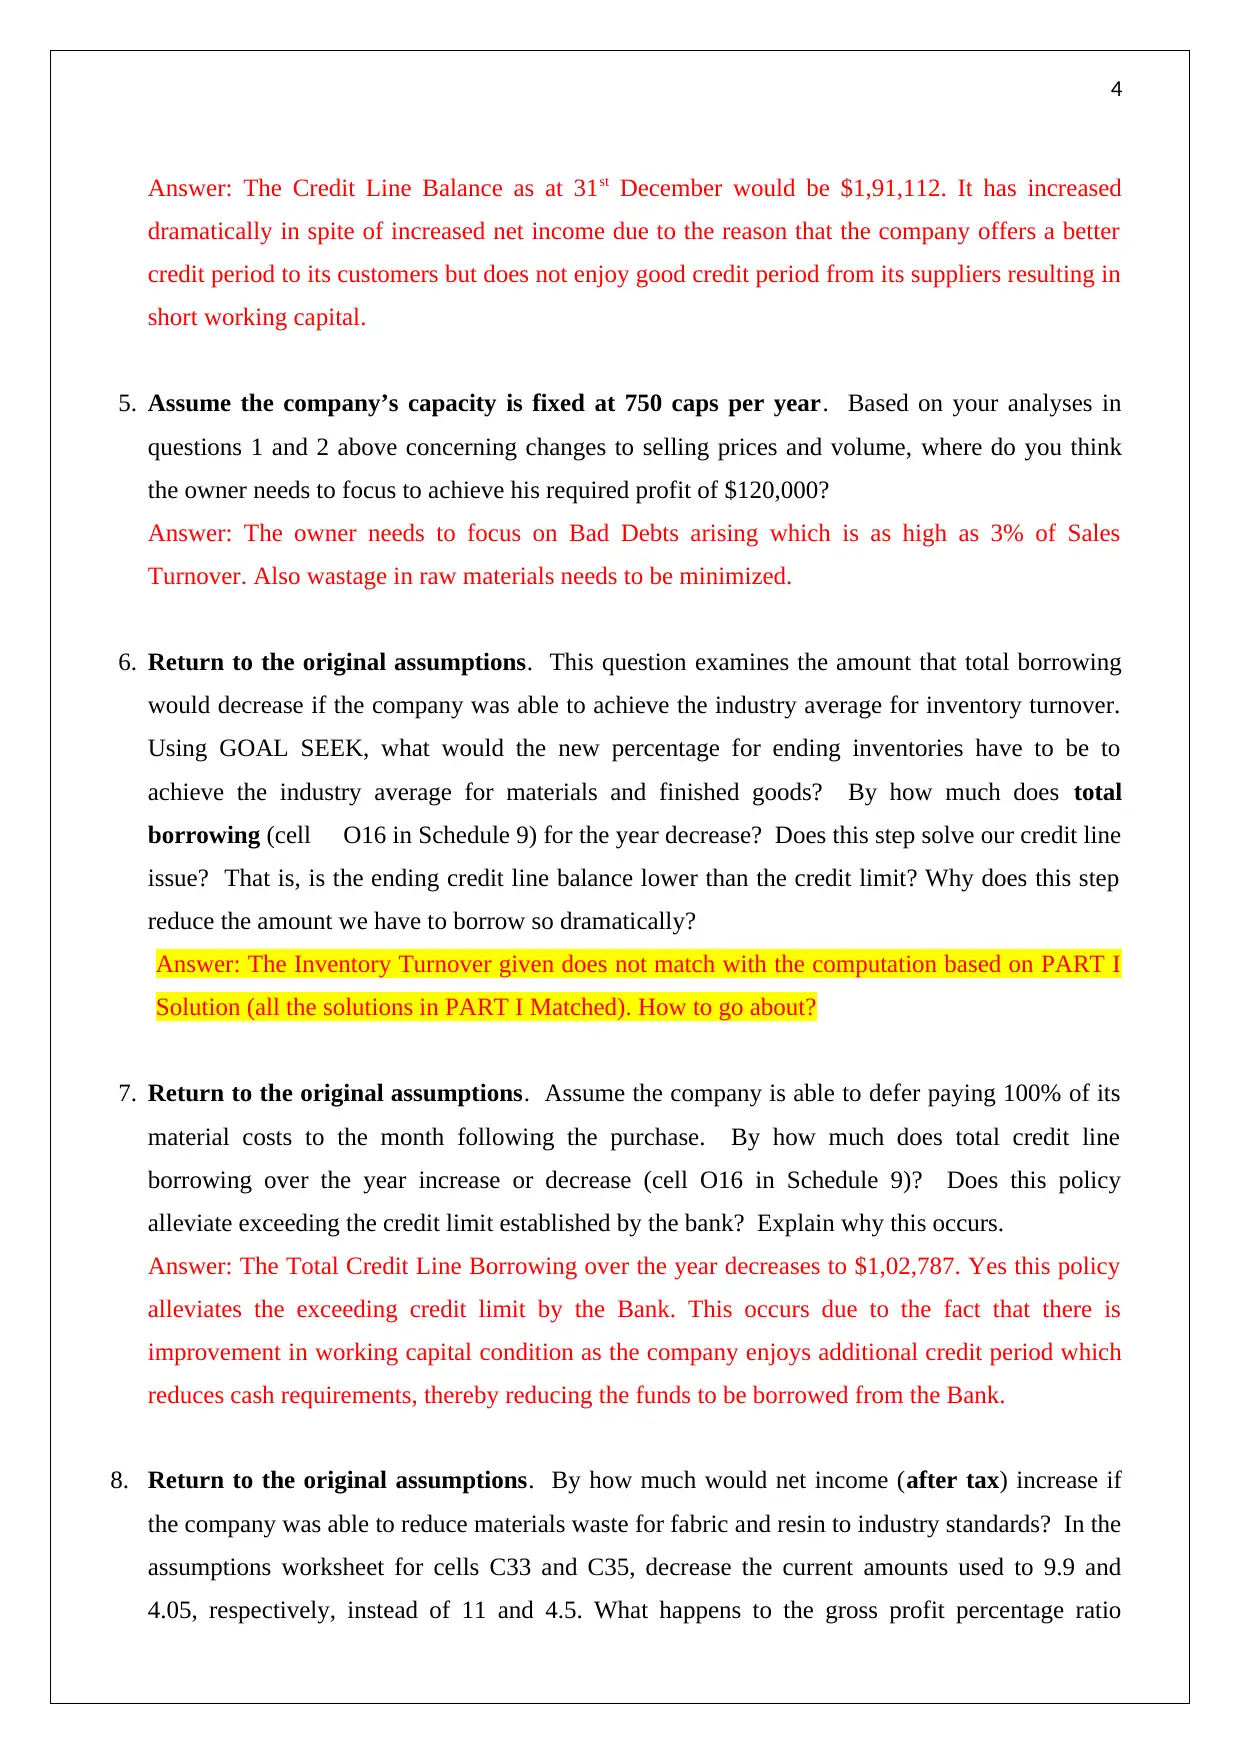
This document presents a detailed solution to a CapCo financial analysis assignment, covering both Part I and Part II. Part I refers to an Excel workbook with financial schedules. Part II analyzes the impact of price increases, production capacity, and material waste on profitability. It explores scenarios using Goal Seek to determine optimal sales levels and assess the implications for net income, credit lines, and working capital. The solution also examines the effect of reducing material waste and introducing a new product on after-tax profits, with detailed calculations provided. The assignment assesses financial concepts like inventory turnover, gross margin, and variance analysis.

1
PART I AND PART II OF THE ASSIGNMENT
Paraphrase This Document
Need a fresh take? Get an instant paraphrase of this document with our AI Paraphraser

2
Table of Contents
PART I 3
PART II 3-6
Table of Contents
PART I 3
PART II 3-6

3
PART I:
Schedule 1 to Schedule 15, Please refer the “CapCo student excel template v2_Final.xlsx”
Workbook.
Note: The Balance Sheet Values given in the Solution does not match with the Actual Worked Out
Balance Sheet for Schedule 12 to Schedule 14. Though the assumptions has been changed righlty.
PART II:
1. What percentage increase does this increase in selling price represent? Is it realistic to raise
prices this amount in a competitive market where Capco’s product is not differentiated?
Answer: The selling price arrived at is $3,764 which is an increase of 3.12%. It is not realistic to
raise prices in a competitive market.
2. Based on his knowledge of the market, the owner is quite sure that the number of units sold
cannot be increased unless the sales price is dropped. If the selling price was reduced by 2% to
$3,577, he believes it is realistic to assume that projected monthly sales would increase sales
substantially from the current estimate of 2 additional units per month He is wondering by how
much sales in units would have to increase each month at the lower selling price to earn
$120,000 in net income (round your answer to one decimal point). Use GOAL SEEK to
determine whether this suggestion is viable if the company’s production capacity is a total of 750
units for the year.
Answer: This suggestion is not viable as the total units required to be sold to achieve Net Income
would be 806 units which is higher than the production capacity of 750 units per year.
3. Continuing on with scenario 2), by how much would net income increase if sales increased only
to match production capacity at the new (lower) price? [Hint: you need to calculate how much
sales in units can increase each month at the lower selling price to arrive at the production
capacity constraint of 750 units by using GOAL SEEK.]
Answer: Existing Net Income of $70,473 would increase to $99,137 ie, $28,664 (40.67%
increase of existing Net Income)
4. Under the scenario outlined in 2) above, what is the credit line balance at the end of December
assuming there was no production constraint (i.e., you can produce as much as you need)?
Explain why it has increased so dramatically even though net income has increased substantially
(i.e., the company has become more profitable)? What do we learn about the current working
capital policies of the company?
⊘ This is a preview!⊘
Do you want full access?
Subscribe today to unlock all pages.

Trusted by 1+ million students worldwide

4
Answer: The Credit Line Balance as at 31st December would be $1,91,112. It has increased
dramatically in spite of increased net income due to the reason that the company offers a better
credit period to its customers but does not enjoy good credit period from its suppliers resulting in
short working capital.
5. Assume the company’s capacity is fixed at 750 caps per year. Based on your analyses in
questions 1 and 2 above concerning changes to selling prices and volume, where do you think
the owner needs to focus to achieve his required profit of $120,000?
Answer: The owner needs to focus on Bad Debts arising which is as high as 3% of Sales
Turnover. Also wastage in raw materials needs to be minimized.
6. Return to the original assumptions. This question examines the amount that total borrowing
would decrease if the company was able to achieve the industry average for inventory turnover.
Using GOAL SEEK, what would the new percentage for ending inventories have to be to
achieve the industry average for materials and finished goods? By how much does total
borrowing (cell O16 in Schedule 9) for the year decrease? Does this step solve our credit line
issue? That is, is the ending credit line balance lower than the credit limit? Why does this step
reduce the amount we have to borrow so dramatically?
Answer: The Inventory Turnover given does not match with the computation based on PART I
Solution (all the solutions in PART I Matched). How to go about?
7. Return to the original assumptions. Assume the company is able to defer paying 100% of its
material costs to the month following the purchase. By how much does total credit line
borrowing over the year increase or decrease (cell O16 in Schedule 9)? Does this policy
alleviate exceeding the credit limit established by the bank? Explain why this occurs.
Answer: The Total Credit Line Borrowing over the year decreases to $1,02,787. Yes this policy
alleviates the exceeding credit limit by the Bank. This occurs due to the fact that there is
improvement in working capital condition as the company enjoys additional credit period which
reduces cash requirements, thereby reducing the funds to be borrowed from the Bank.
8. Return to the original assumptions. By how much would net income (after tax) increase if
the company was able to reduce materials waste for fabric and resin to industry standards? In the
assumptions worksheet for cells C33 and C35, decrease the current amounts used to 9.9 and
4.05, respectively, instead of 11 and 4.5. What happens to the gross profit percentage ratio
Paraphrase This Document
Need a fresh take? Get an instant paraphrase of this document with our AI Paraphraser

5
relative to industry standards when we do so? What do you conclude about the importance of
quality (wastage) based on this analysis?
Answer: The Net Profit increases to $1,42,384 from $70,473. The Gross Profit Percentage
increases to 25.08% which is better than the current scenario. Importance of Wastage is that
lesser the wastage, effective would be use of the raw materials, effective usage would result into
lower purchase of raw materials thereby resulting lower payment towards materials. It shall
increase the Net Profit ultimately.
9. If the company can find a way to reduce materials wastage to industry standards (i.e., to 9.9 and
4.05 as referred to above), and assuming the company cannot decrease its material costs (you’ve
already checked), what is the likely key area that the company must focus on to attain industry
gross margin standards? Hint: consider the costs that comprise cost of goods sold along with
what we have learned in Chapter 10 on variance analysis.
Answer: The company can have a check on variances arising on account of material, labour and
overheads. It should apply the techniques on variance analysis to reduce the cost of goods sold so
as to increase Gross Profit and thereby increasing the Gross Profit Percentage.
10. It is not possible to use our financial model to calculate the change in income from introducing a
new product because performing this type of “what-if” decision was not incorporated into the
design of the financial model (i.e., we would have needed to have a two product model from the
start). However, using a “back of an envelope” calculation, by how much would after-tax
company profits increase if 100 deluxe truck caps were sold in 2016? Clearly show how you
arrived at your answer. Why do profits increase so dramatically given that the deluxe product
reflects only a modest percentage increase in sales (100/688) and its gross margin percentage for
financial accounting purposes is approximately equal to the gross margin percentage of the
regular model? [Hint: Be careful to consider only those relevant costs by applying chapter 8
theory to help you. Also, treat bad debt expense as a variable cost. Ignore any changes in
interest expense.]
Answer: After Tax Profit of the Company on selling 100 deluxe truck caps is $52,144. Though
the deluxe truck caps reflects only a modest percentage of total sales, it dramatically increase the
after profit tax for the reason that the Fixed Overheads and Fixed Costs remains constant, that is
to say it shall not be computed for calculation purpose as it has already been recovered out of the
existing sales. So whatever Contribution the additional product generates, it shall be the profit
available to the company directly.

6
Calculations has been shown in “CapCo student excel template v2_Final.xlsx” Workbook and
Sheet Name is “Part 2_Qn 10
Calculations has been shown in “CapCo student excel template v2_Final.xlsx” Workbook and
Sheet Name is “Part 2_Qn 10
⊘ This is a preview!⊘
Do you want full access?
Subscribe today to unlock all pages.

Trusted by 1+ million students worldwide
1 out of 6
Related Documents

Your All-in-One AI-Powered Toolkit for Academic Success.
+13062052269
info@desklib.com
Available 24*7 on WhatsApp / Email
Unlock your academic potential
© 2024 | Zucol Services PVT LTD | All rights reserved.