Capco Financial Analysis: Pricing, Capacity, and Profitability

Verified

Added on  2019/09/16

|5
|1575
|197
Homework Assignment
AI Summary
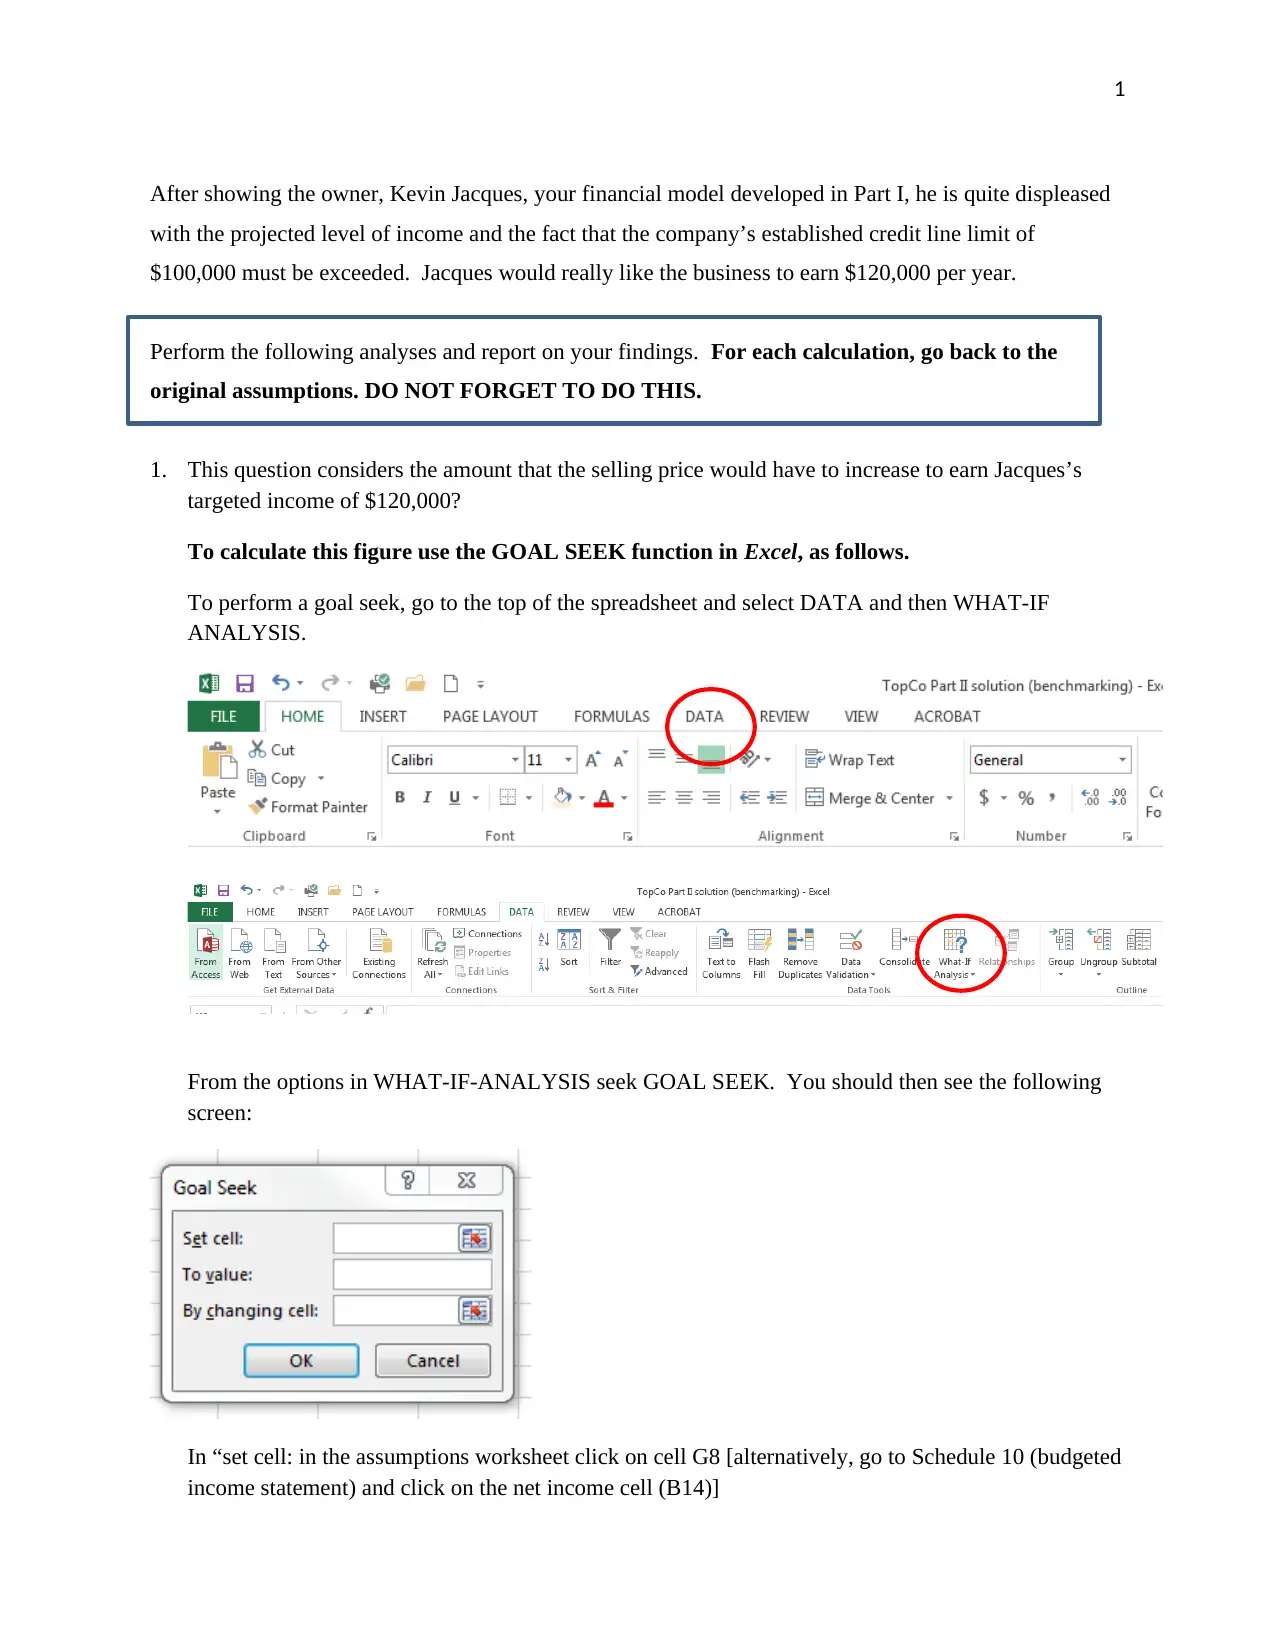
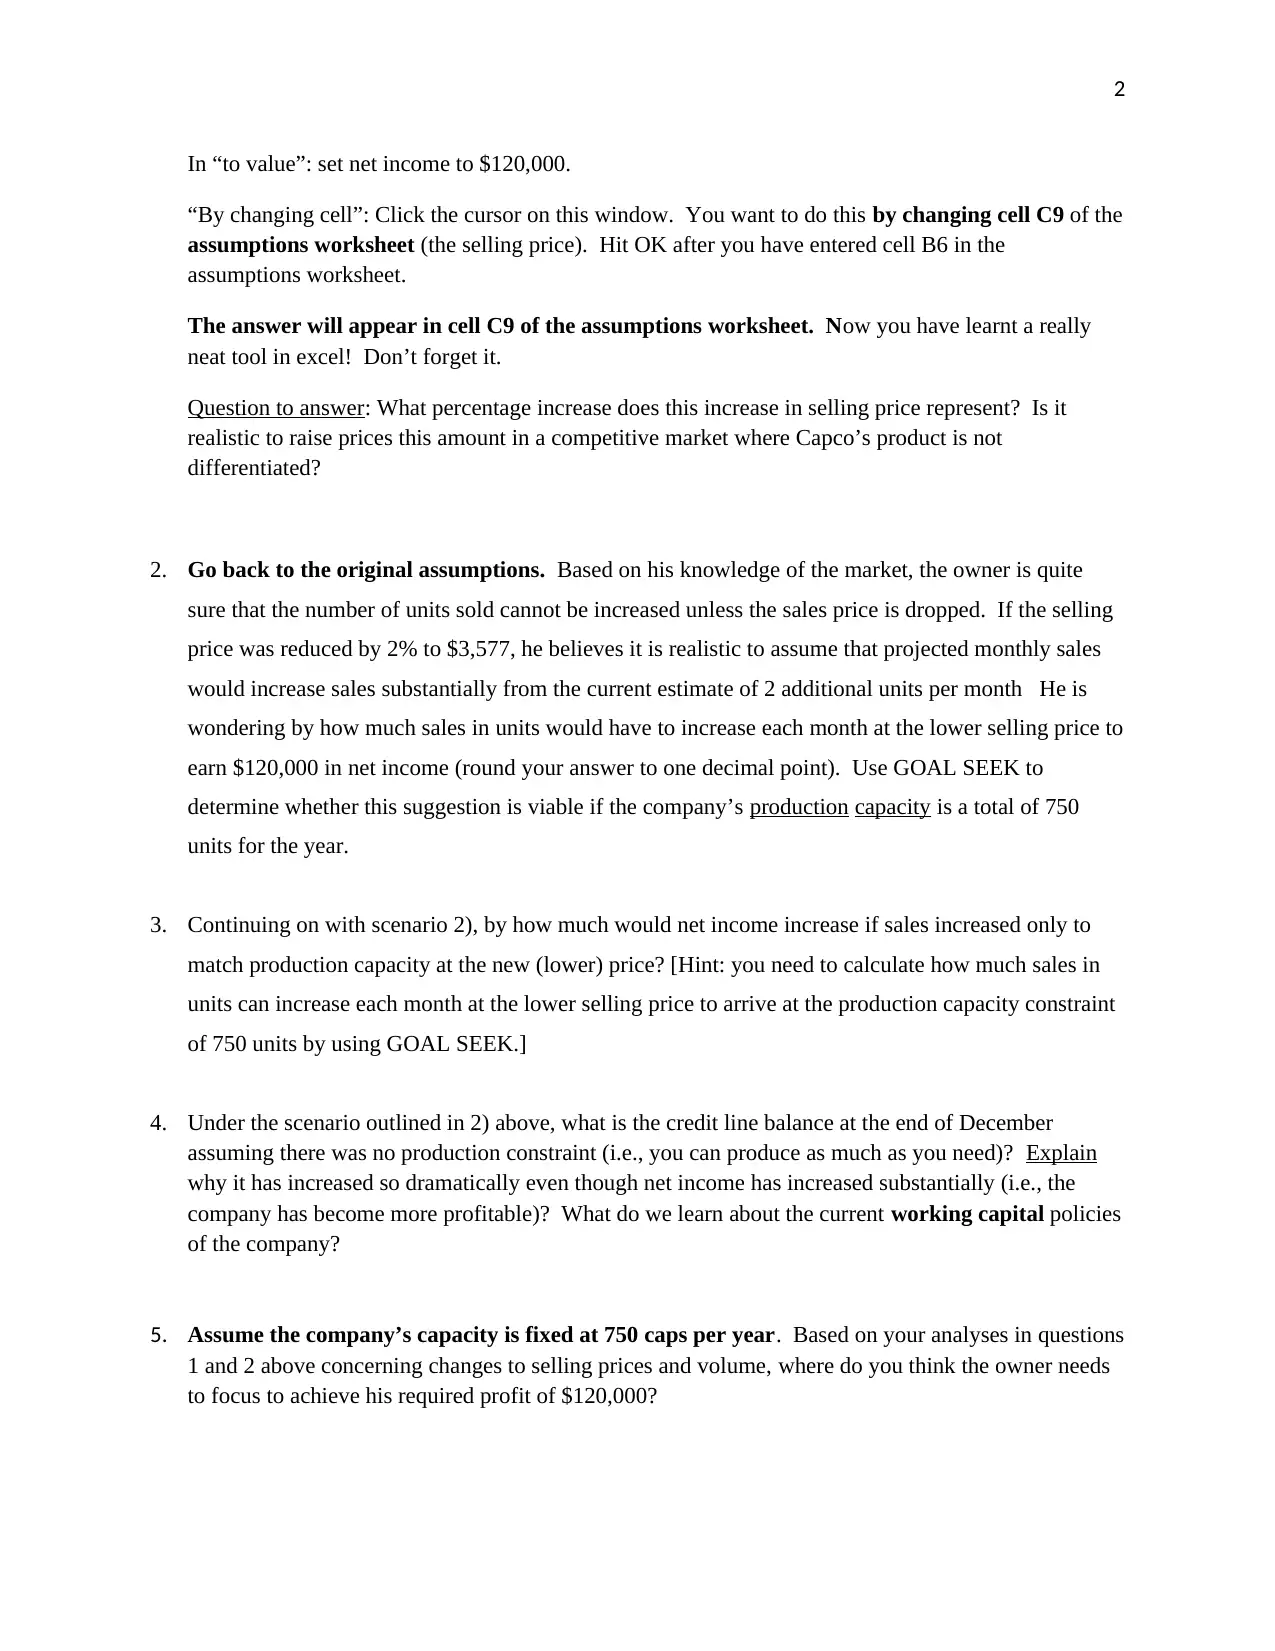
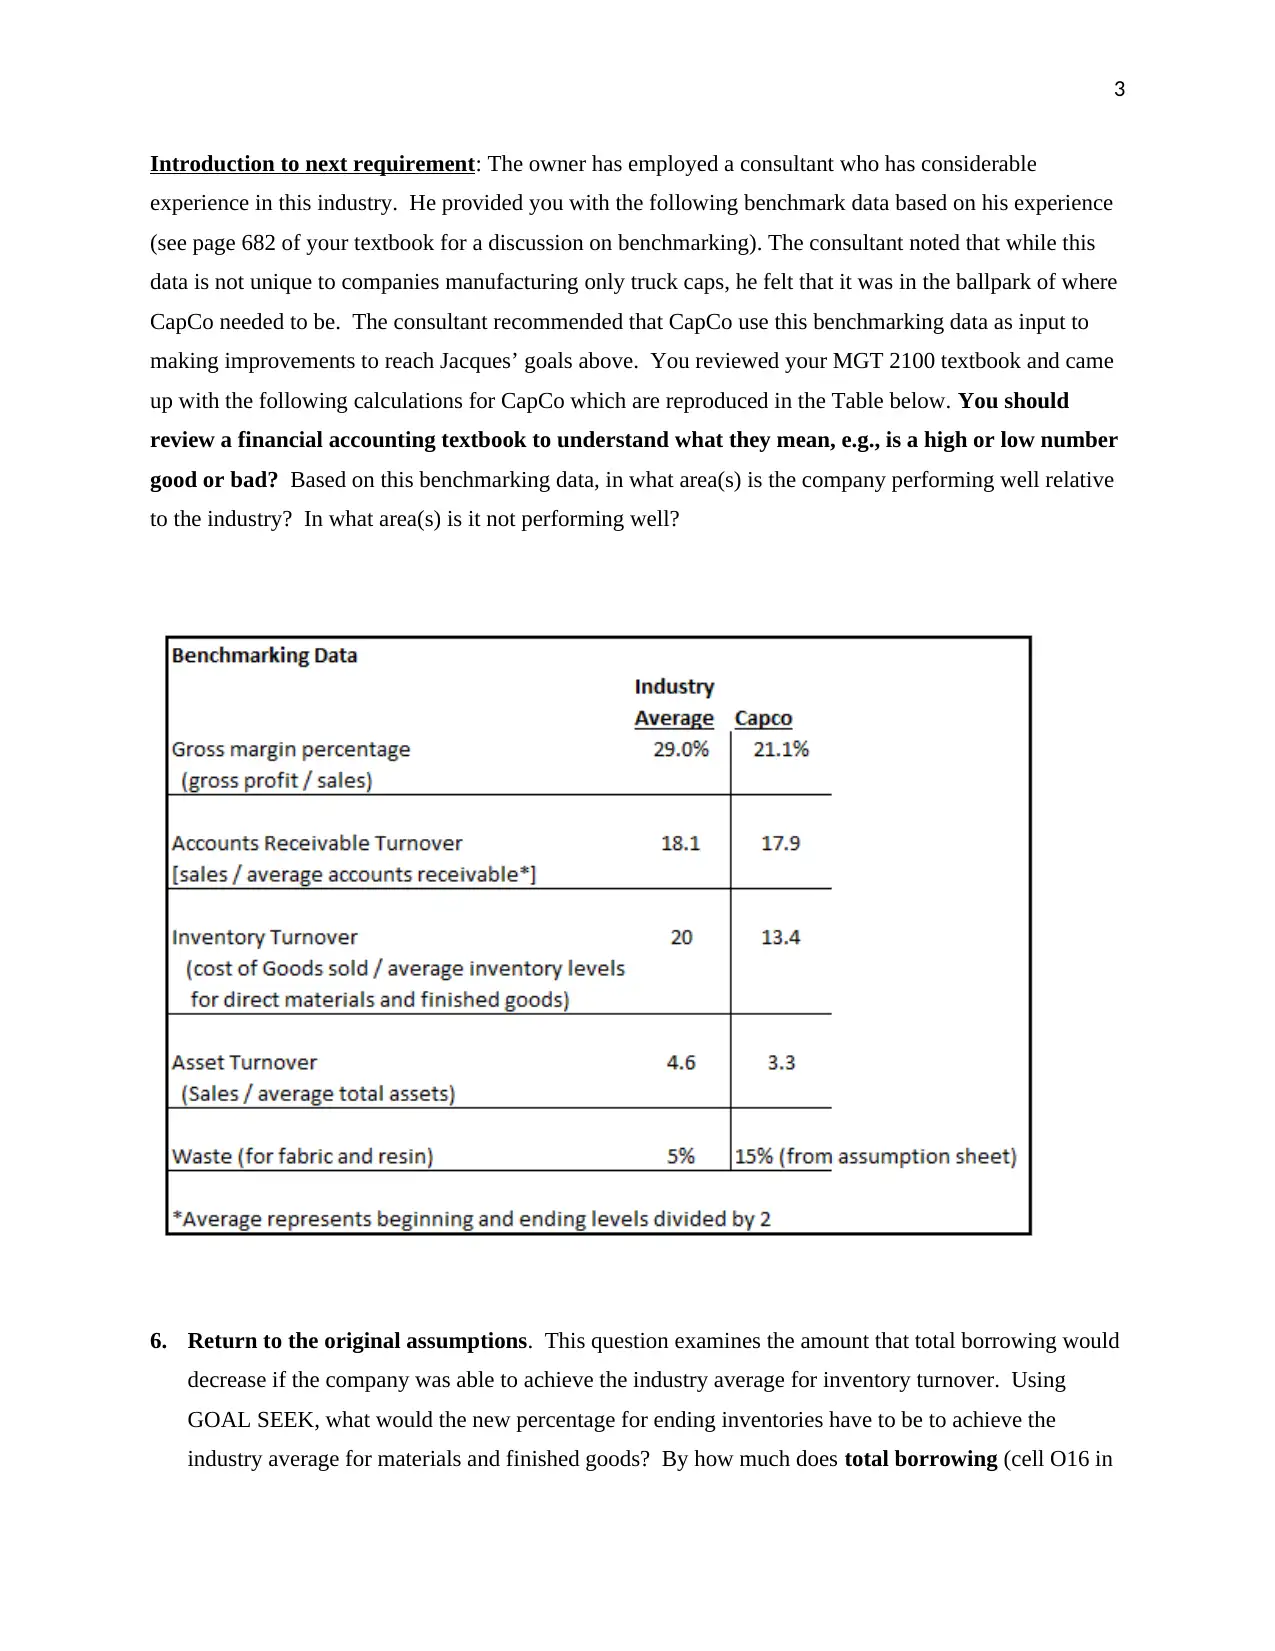
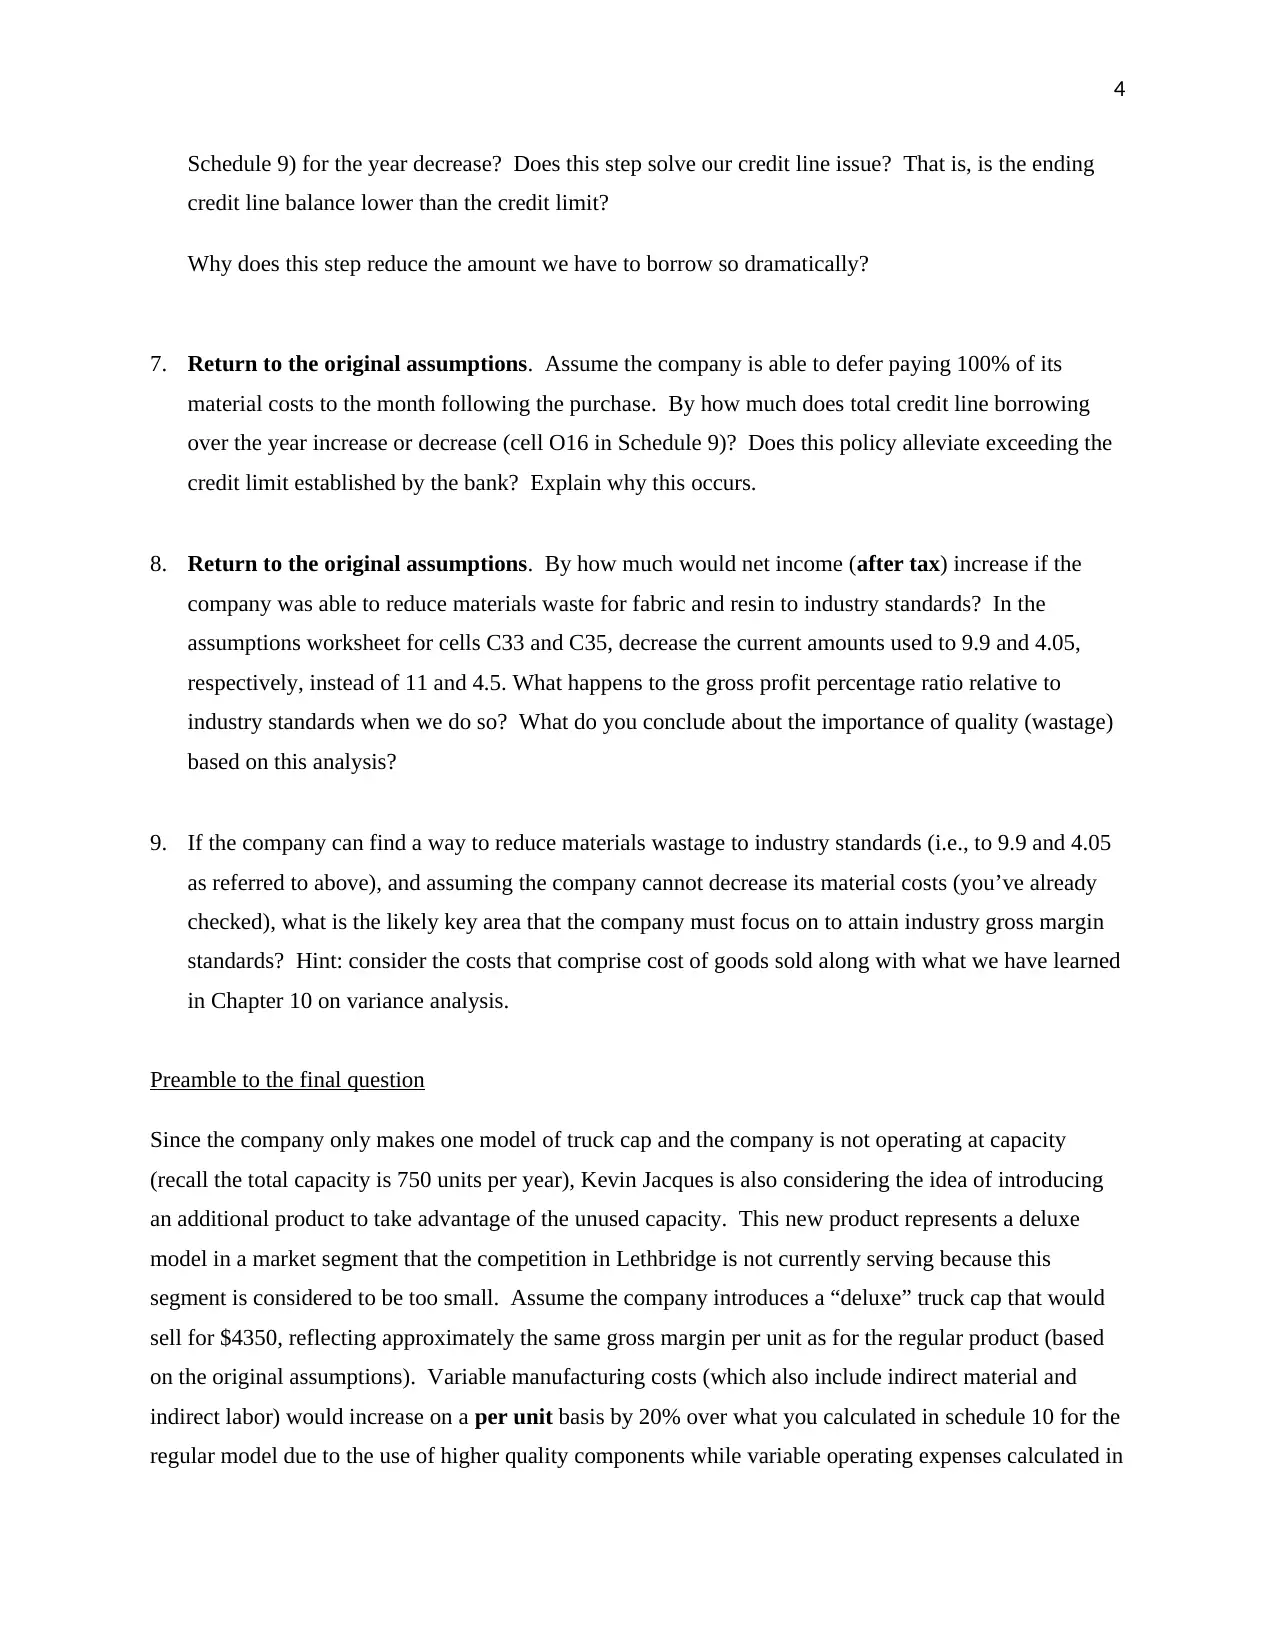
This assignment requires a comprehensive financial analysis of Capco, a truck cap manufacturing company, addressing the owner's concerns about profitability and credit line limits. The analysis involves using the GOAL SEEK function in Excel to determine the impact of pricing changes, sales volume adjustments, and cost reductions on net income. The assignment explores various scenarios, including increasing selling prices, reducing prices to increase sales, and the impact of production capacity constraints. Furthermore, it incorporates benchmarking data to assess CapCo's performance relative to industry standards, focusing on inventory turnover and materials waste. The analysis also examines the effects of deferring material costs and introducing a deluxe product line. The goal is to identify key areas for improvement to achieve the owner's profit target and address working capital issues.
Document Page
1
After showing the owner, Kevin Jacques, your financial model developed in Part I, he is quite displeased
with the projected level of income and the fact that the company’s established credit line limit of
$100,000 must be exceeded. Jacques would really like the business to earn $120,000 per year.
Perform the following analyses and report on your findings. For each calculation, go back to the
original assumptions. DO NOT FORGET TO DO THIS.
1. This question considers the amount that the selling price would have to increase to earn Jacques’s
targeted income of $120,000?
To calculate this figure use the GOAL SEEK function in Excel, as follows.
To perform a goal seek, go to the top of the spreadsheet and select DATA and then WHAT-IF
ANALYSIS.
From the options in WHAT-IF-ANALYSIS seek GOAL SEEK. You should then see the following
screen:
In “set cell: in the assumptions worksheet click on cell G8 [alternatively, go to Schedule 10 (budgeted
income statement) and click on the net income cell (B14)]
tabler-icon-diamond-filled.svg

Paraphrase This Document

Need a fresh take? Get an instant paraphrase of this document with our AI Paraphraser
Document Page
2
In “to value”: set net income to $120,000.
“By changing cell”: Click the cursor on this window. You want to do this by changing cell C9 of the
assumptions worksheet (the selling price). Hit OK after you have entered cell B6 in the
assumptions worksheet.
The answer will appear in cell C9 of the assumptions worksheet. Now you have learnt a really
neat tool in excel! Don’t forget it.
Question to answer: What percentage increase does this increase in selling price represent? Is it
realistic to raise prices this amount in a competitive market where Capco’s product is not
differentiated?
2. Go back to the original assumptions. Based on his knowledge of the market, the owner is quite
sure that the number of units sold cannot be increased unless the sales price is dropped. If the selling
price was reduced by 2% to $3,577, he believes it is realistic to assume that projected monthly sales
would increase sales substantially from the current estimate of 2 additional units per month He is
wondering by how much sales in units would have to increase each month at the lower selling price to
earn $120,000 in net income (round your answer to one decimal point). Use GOAL SEEK to
determine whether this suggestion is viable if the company’s production capacity is a total of 750
units for the year.
3. Continuing on with scenario 2), by how much would net income increase if sales increased only to
match production capacity at the new (lower) price? [Hint: you need to calculate how much sales in
units can increase each month at the lower selling price to arrive at the production capacity constraint
of 750 units by using GOAL SEEK.]
4. Under the scenario outlined in 2) above, what is the credit line balance at the end of December
assuming there was no production constraint (i.e., you can produce as much as you need)? Explain
why it has increased so dramatically even though net income has increased substantially (i.e., the
company has become more profitable)? What do we learn about the current working capital policies
of the company?
5. Assume the company’s capacity is fixed at 750 caps per year. Based on your analyses in questions
1 and 2 above concerning changes to selling prices and volume, where do you think the owner needs
to focus to achieve his required profit of $120,000?
Document Page
3
Introduction to next requirement: The owner has employed a consultant who has considerable
experience in this industry. He provided you with the following benchmark data based on his experience
(see page 682 of your textbook for a discussion on benchmarking). The consultant noted that while this
data is not unique to companies manufacturing only truck caps, he felt that it was in the ballpark of where
CapCo needed to be. The consultant recommended that CapCo use this benchmarking data as input to
making improvements to reach Jacques’ goals above. You reviewed your MGT 2100 textbook and came
up with the following calculations for CapCo which are reproduced in the Table below. You should
review a financial accounting textbook to understand what they mean, e.g., is a high or low number
good or bad? Based on this benchmarking data, in what area(s) is the company performing well relative
to the industry? In what area(s) is it not performing well?
6. Return to the original assumptions. This question examines the amount that total borrowing would
decrease if the company was able to achieve the industry average for inventory turnover. Using
GOAL SEEK, what would the new percentage for ending inventories have to be to achieve the
industry average for materials and finished goods? By how much does total borrowing (cell O16 in
Document Page
4
Schedule 9) for the year decrease? Does this step solve our credit line issue? That is, is the ending
credit line balance lower than the credit limit?
Why does this step reduce the amount we have to borrow so dramatically?
7. Return to the original assumptions. Assume the company is able to defer paying 100% of its
material costs to the month following the purchase. By how much does total credit line borrowing
over the year increase or decrease (cell O16 in Schedule 9)? Does this policy alleviate exceeding the
credit limit established by the bank? Explain why this occurs.
8. Return to the original assumptions. By how much would net income (after tax) increase if the
company was able to reduce materials waste for fabric and resin to industry standards? In the
assumptions worksheet for cells C33 and C35, decrease the current amounts used to 9.9 and 4.05,
respectively, instead of 11 and 4.5. What happens to the gross profit percentage ratio relative to
industry standards when we do so? What do you conclude about the importance of quality (wastage)
based on this analysis?
9. If the company can find a way to reduce materials wastage to industry standards (i.e., to 9.9 and 4.05
as referred to above), and assuming the company cannot decrease its material costs (you’ve already
checked), what is the likely key area that the company must focus on to attain industry gross margin
standards? Hint: consider the costs that comprise cost of goods sold along with what we have learned
in Chapter 10 on variance analysis.
Preamble to the final question
Since the company only makes one model of truck cap and the company is not operating at capacity
(recall the total capacity is 750 units per year), Kevin Jacques is also considering the idea of introducing
an additional product to take advantage of the unused capacity. This new product represents a deluxe
model in a market segment that the competition in Lethbridge is not currently serving because this
segment is considered to be too small. Assume the company introduces a “deluxe” truck cap that would
sell for $4350, reflecting approximately the same gross margin per unit as for the regular product (based
on the original assumptions). Variable manufacturing costs (which also include indirect material and
indirect labor) would increase on a per unit basis by 20% over what you calculated in schedule 10 for the
regular model due to the use of higher quality components while variable operating expenses calculated in
tabler-icon-diamond-filled.svg

Paraphrase This Document

Need a fresh take? Get an instant paraphrase of this document with our AI Paraphraser
Document Page
5
schedule 6 would remain the same on a per unit basis. Bad debt expense would remain the same as for
the regular model.
10. It is not possible to use our financial model to calculate the change in income from introducing a new
product because performing this type of “what-if” decision was not incorporated into the design of
the financial model (i.e., we would have needed to have a two product model from the start).
However, using a “back of an envelope” calculation, by how much would after-tax company profits
increase if 100 deluxe truck caps were sold in 2016? Clearly show how you arrived at your answer.
Why do profits increase so dramatically given that the deluxe product reflects only a modest
percentage increase in sales (100/688) and its gross margin percentage for financial accounting
purposes is approximately equal to the gross margin percentage of the regular model? [Hint: Be
careful to consider only those relevant costs by applying chapter 8 theory to help you. Also, treat bad
debt expense as a variable cost. Ignore any changes in interest expense.]
chevron_up_icon
1 out of 5
circle_padding
hide_on_mobile
zoom_out_icon
[object Object]