Capital Budgeting and Project Recommendation Analysis

Verified

Added on  2022/08/21

|7
|932
|9
Project
AI Summary
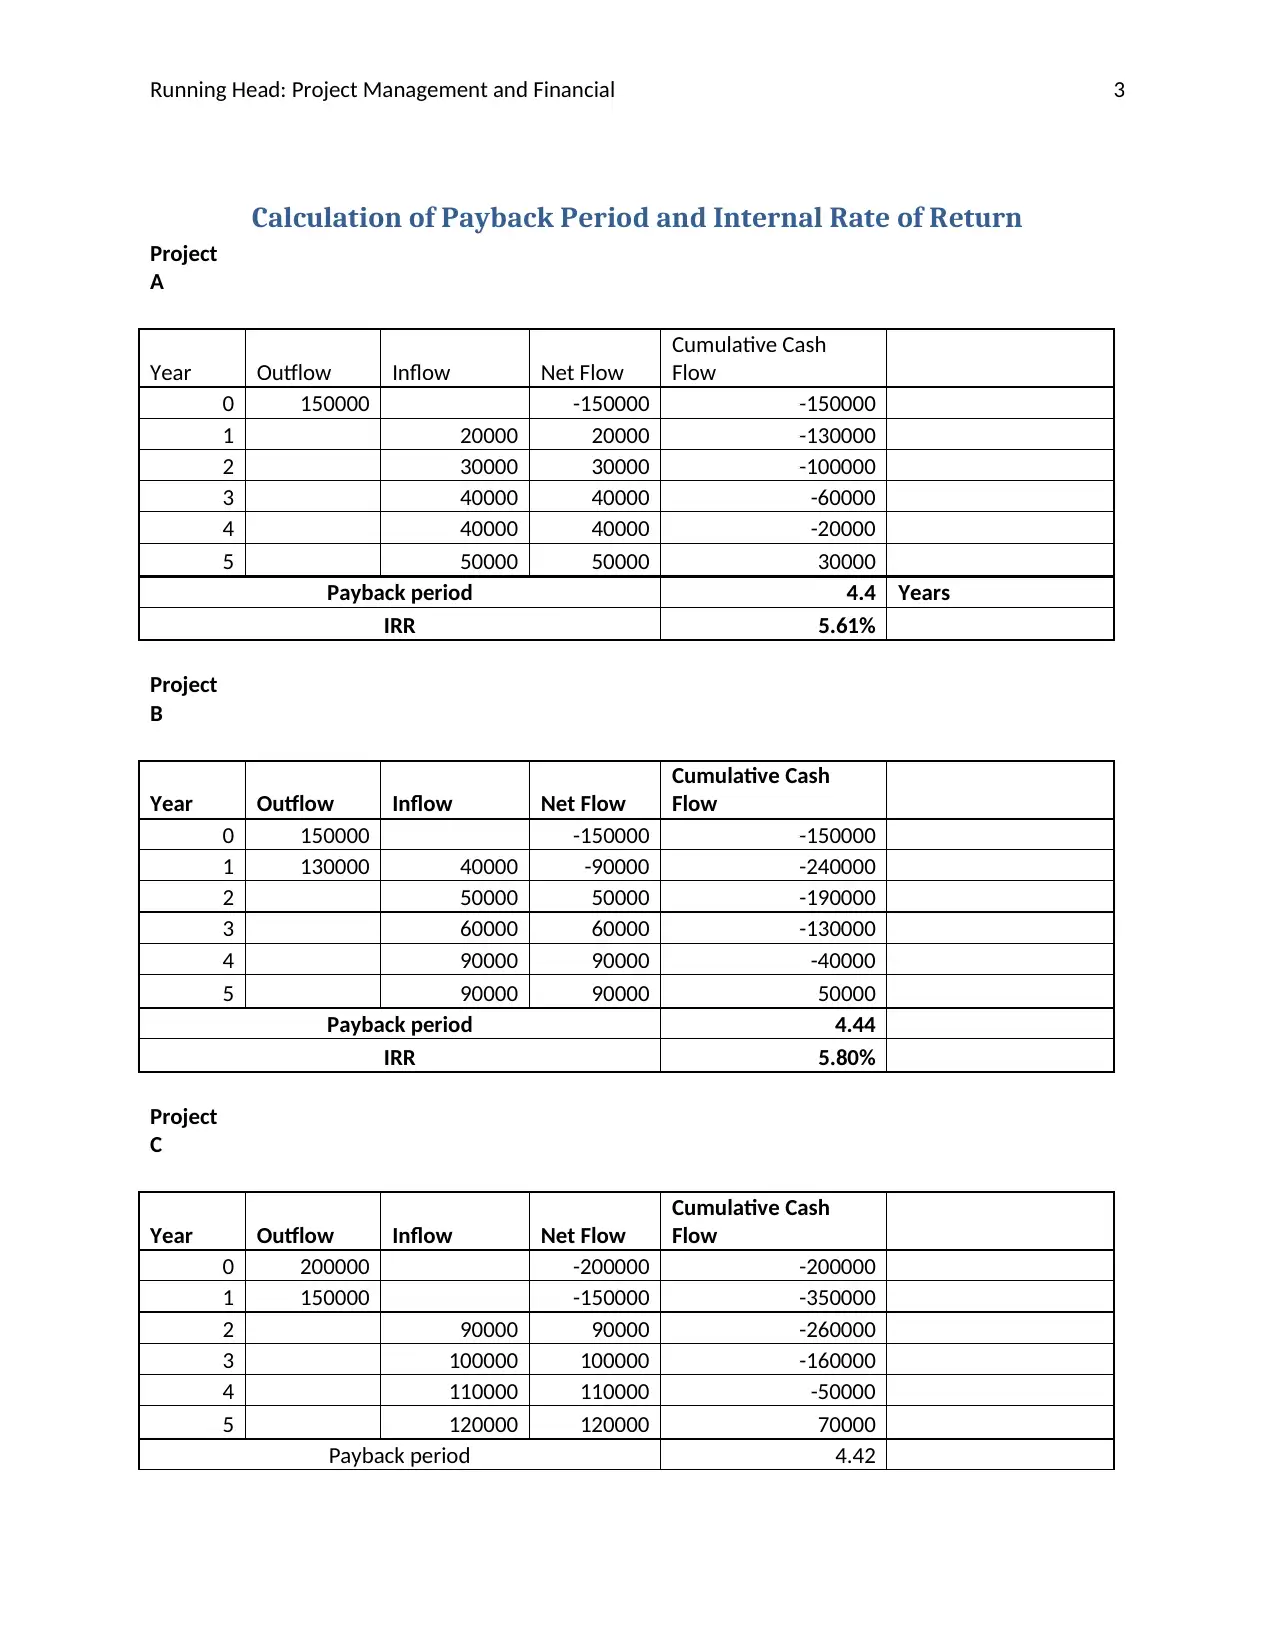
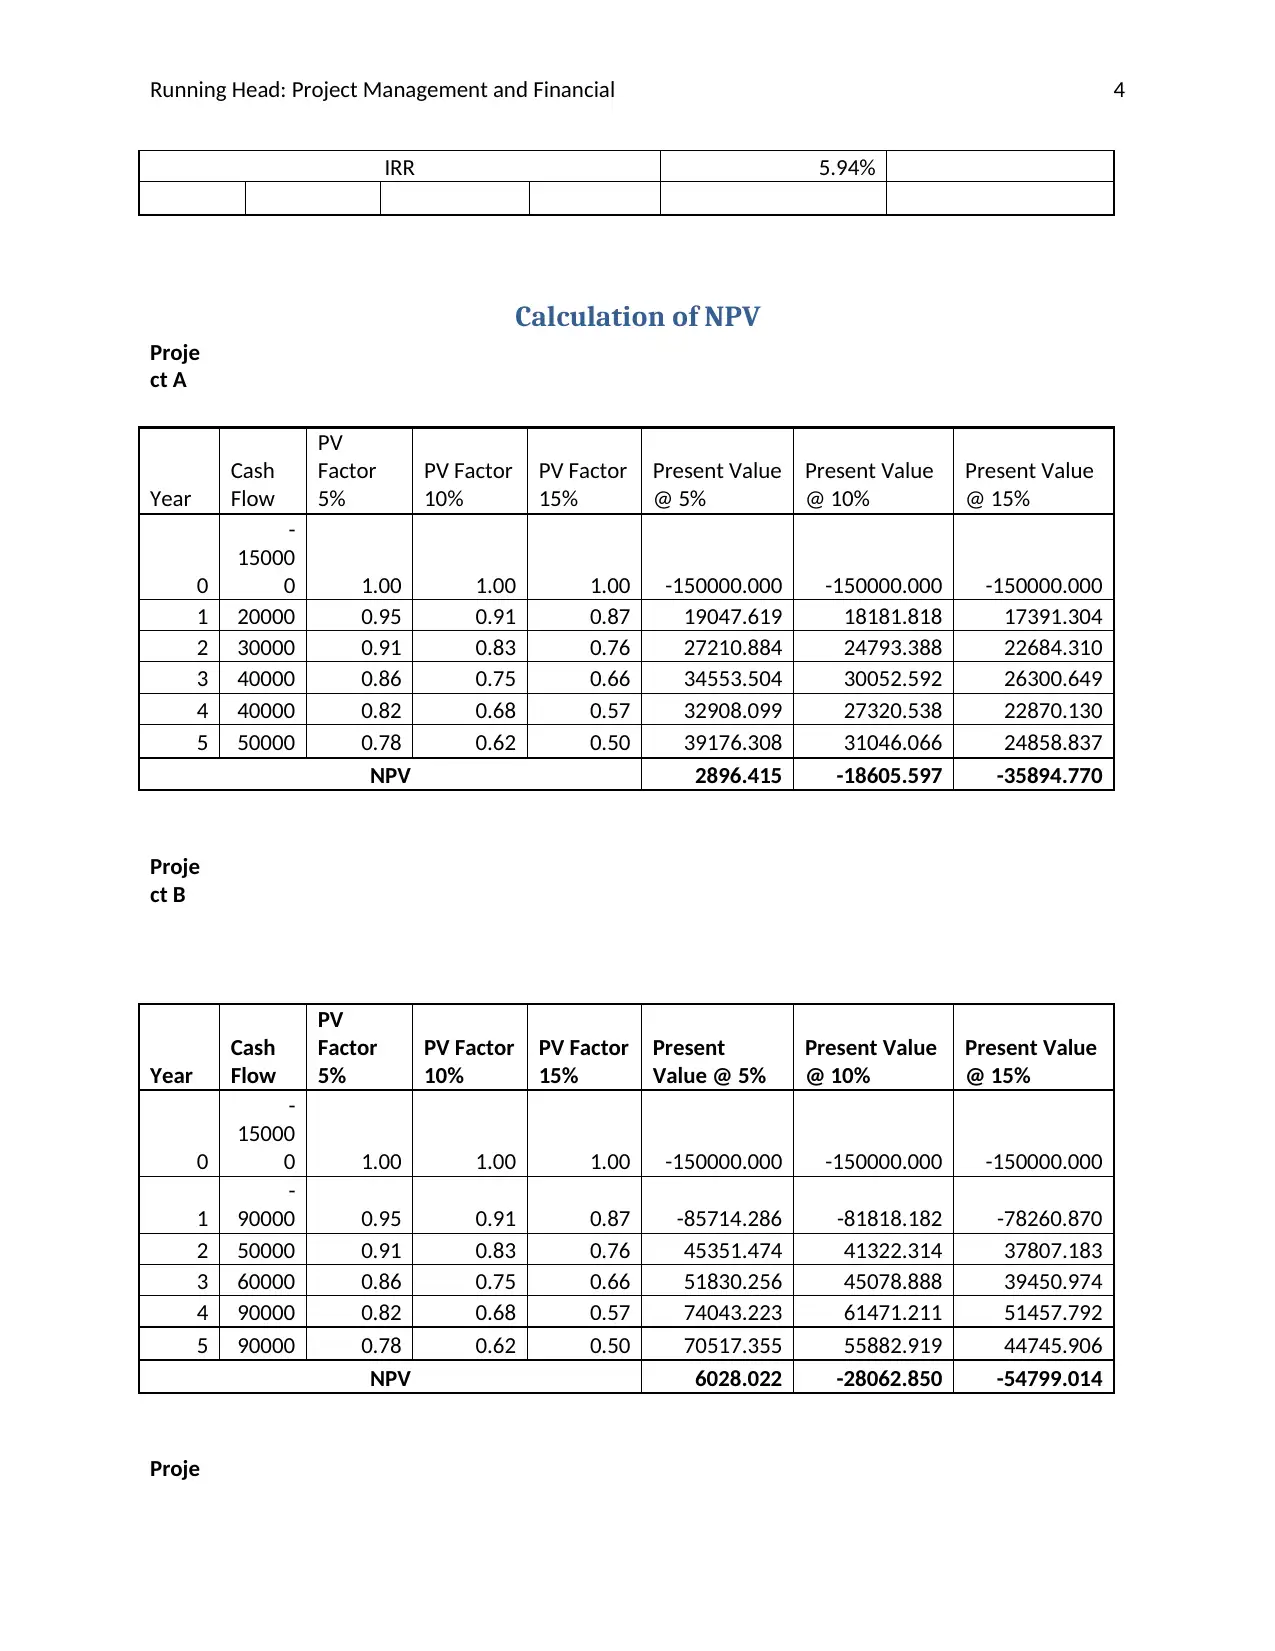
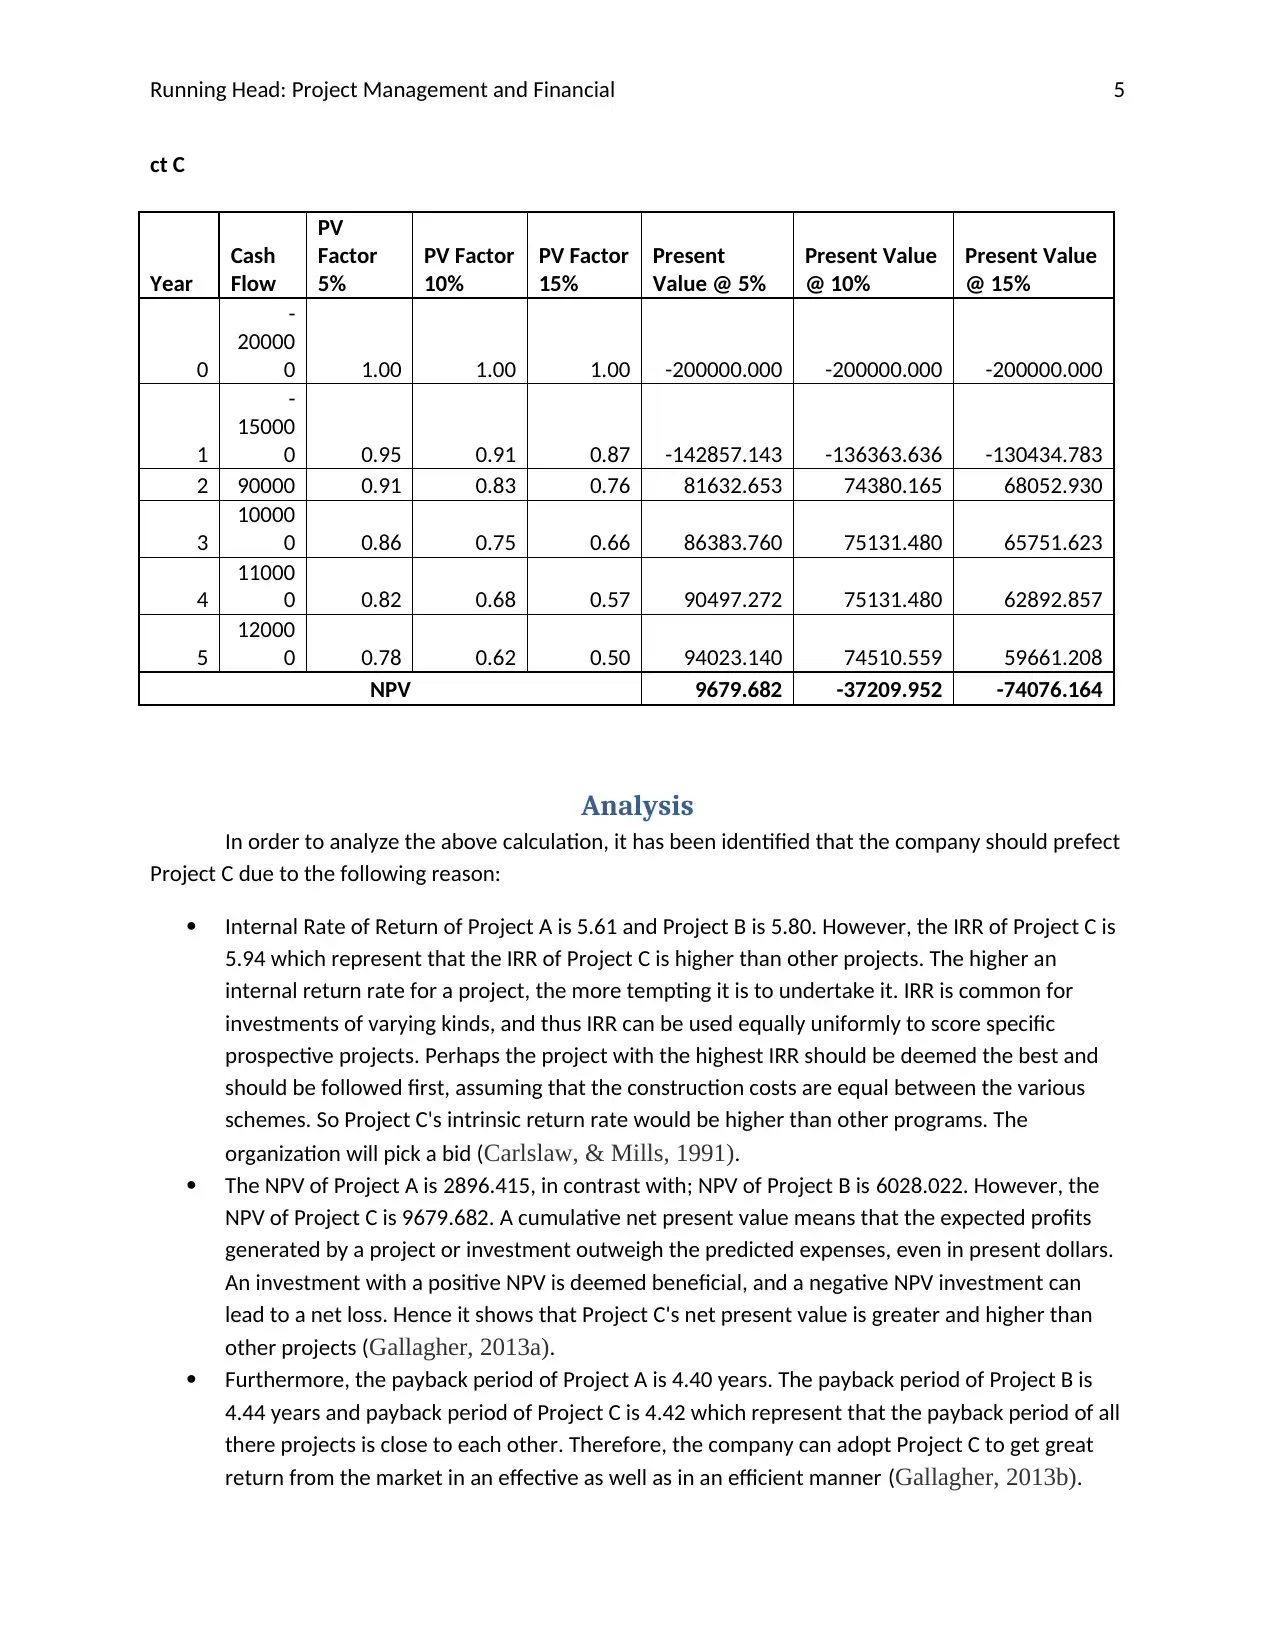
This project analyzes three mutually exclusive projects from a capital budgeting perspective. The analysis includes the calculation of payback periods, Internal Rate of Return (IRR), and Net Present Value (NPV) at different discount rates (5%, 10%, and 15%). The assignment provides detailed cash flow projections, calculations, and interpretations for each project, enabling a comparison based on financial metrics. The student recommends project C based on the highest IRR and NPV, suggesting its superior financial performance compared to projects A and B. The analysis considers the implications of the findings for the review board, who will also consider non-financial aspects when selecting a project. The project uses financial management techniques to provide recommendations for the capital budgeting decision.
tabler-icon-diamond-filled.svg

Contribute Materials

Your contribution can guide someone’s learning journey. Share your documents today.
Document Page
Running Head: Project Management & Financial 1
Project Management
Student Name
3/11/2020
tabler-icon-diamond-filled.svg

Secure Best Marks with AI Grader

Need help grading? Try our AI Grader for instant feedback on your assignments.
Document Page
Running Head: Project Management and Financial 2
Contents
Calculation of Payback Period and Internal Rate of Return.........................................................................3
Calculation of NPV.......................................................................................................................................4
Analysis........................................................................................................................................................5
References...................................................................................................................................................6
Document Page
Running Head: Project Management and Financial 3
Calculation of Payback Period and Internal Rate of Return
Project
A
Year Outflow Inflow Net Flow
Cumulative Cash
Flow
0 150000 -150000 -150000
1 20000 20000 -130000
2 30000 30000 -100000
3 40000 40000 -60000
4 40000 40000 -20000
5 50000 50000 30000
Payback period 4.4 Years
IRR 5.61%
Project
B
Year Outflow Inflow Net Flow
Cumulative Cash
Flow
0 150000 -150000 -150000
1 130000 40000 -90000 -240000
2 50000 50000 -190000
3 60000 60000 -130000
4 90000 90000 -40000
5 90000 90000 50000
Payback period 4.44
IRR 5.80%
Project
C
Year Outflow Inflow Net Flow
Cumulative Cash
Flow
0 200000 -200000 -200000
1 150000 -150000 -350000
2 90000 90000 -260000
3 100000 100000 -160000
4 110000 110000 -50000
5 120000 120000 70000
Payback period 4.42
Document Page
Running Head: Project Management and Financial 4
IRR 5.94%
Calculation of NPV
Proje
ct A
Year
Cash
Flow
PV
Factor
5%
PV Factor
10%
PV Factor
15%
Present Value
@ 5%
Present Value
@ 10%
Present Value
@ 15%
0
-
15000
0 1.00 1.00 1.00 -150000.000 -150000.000 -150000.000
1 20000 0.95 0.91 0.87 19047.619 18181.818 17391.304
2 30000 0.91 0.83 0.76 27210.884 24793.388 22684.310
3 40000 0.86 0.75 0.66 34553.504 30052.592 26300.649
4 40000 0.82 0.68 0.57 32908.099 27320.538 22870.130
5 50000 0.78 0.62 0.50 39176.308 31046.066 24858.837
NPV 2896.415 -18605.597 -35894.770
Proje
ct B
Year
Cash
Flow
PV
Factor
5%
PV Factor
10%
PV Factor
15%
Present
Value @ 5%
Present Value
@ 10%
Present Value
@ 15%
0
-
15000
0 1.00 1.00 1.00 -150000.000 -150000.000 -150000.000
1
-
90000 0.95 0.91 0.87 -85714.286 -81818.182 -78260.870
2 50000 0.91 0.83 0.76 45351.474 41322.314 37807.183
3 60000 0.86 0.75 0.66 51830.256 45078.888 39450.974
4 90000 0.82 0.68 0.57 74043.223 61471.211 51457.792
5 90000 0.78 0.62 0.50 70517.355 55882.919 44745.906
NPV 6028.022 -28062.850 -54799.014
Proje
tabler-icon-diamond-filled.svg

Secure Best Marks with AI Grader

Need help grading? Try our AI Grader for instant feedback on your assignments.
Document Page
Running Head: Project Management and Financial 5
ct C
Year
Cash
Flow
PV
Factor
5%
PV Factor
10%
PV Factor
15%
Present
Value @ 5%
Present Value
@ 10%
Present Value
@ 15%
0
-
20000
0 1.00 1.00 1.00 -200000.000 -200000.000 -200000.000
1
-
15000
0 0.95 0.91 0.87 -142857.143 -136363.636 -130434.783
2 90000 0.91 0.83 0.76 81632.653 74380.165 68052.930
3
10000
0 0.86 0.75 0.66 86383.760 75131.480 65751.623
4
11000
0 0.82 0.68 0.57 90497.272 75131.480 62892.857
5
12000
0 0.78 0.62 0.50 94023.140 74510.559 59661.208
NPV 9679.682 -37209.952 -74076.164
Analysis
In order to analyze the above calculation, it has been identified that the company should prefect
Project C due to the following reason:
Internal Rate of Return of Project A is 5.61 and Project B is 5.80. However, the IRR of Project C is
5.94 which represent that the IRR of Project C is higher than other projects. The higher an
internal return rate for a project, the more tempting it is to undertake it. IRR is common for
investments of varying kinds, and thus IRR can be used equally uniformly to score specific
prospective projects. Perhaps the project with the highest IRR should be deemed the best and
should be followed first, assuming that the construction costs are equal between the various
schemes. So Project C's intrinsic return rate would be higher than other programs. The
organization will pick a bid (Carlslaw, & Mills, 1991).
The NPV of Project A is 2896.415, in contrast with; NPV of Project B is 6028.022. However, the
NPV of Project C is 9679.682. A cumulative net present value means that the expected profits
generated by a project or investment outweigh the predicted expenses, even in present dollars.
An investment with a positive NPV is deemed beneficial, and a negative NPV investment can
lead to a net loss. Hence it shows that Project C's net present value is greater and higher than
other projects (Gallagher, 2013a).
Furthermore, the payback period of Project A is 4.40 years. The payback period of Project B is
4.44 years and payback period of Project C is 4.42 which represent that the payback period of all
there projects is close to each other. Therefore, the company can adopt Project C to get great
return from the market in an effective as well as in an efficient manner (Gallagher, 2013b).
Document Page
Running Head: Project Management and Financial 6
Document Page
Running Head: Project Management and Financial 7
References
Carlslaw, C. & Mills, R. (1991). Developing ratios for effective cash flow statement analysis.
Journal of Accountancy, 172(5), pp.63-70. Retrieved from:
http://ezproxy.umuc.edu/login?url=http://search.ebscohost.com/login.aspx?
direct=true&db=bth&AN=4583309&site=eds-live&scope=site
Gallagher, T. (2013a). Chapter 10 – Capital Budgeting Decision Methods (pgs. 270-290) in
Financial Management (6th Edition). (Available in eReserves.)
Caplan, D. (2010a). Chapter 19 Capital Budgeting in Management Accounting
Concepts and Techniques. Retrieved from:
http://www.albany.edu/~dc641869/Chapter19.htm
Gallagher, T. (2013b). Chapter 4 – Review of Accounting in Financial Management (6th
Edition). (Available in eReserves.)
Gallagher, T. (2013c). Chapter 5 – Analysis of Financial Statements in Financial
Management (6th Edition). (Available in eReserves.)
chevron_up_icon
1 out of 7
circle_padding
hide_on_mobile
zoom_out_icon
logo.png

Your All-in-One AI-Powered Toolkit for Academic Success.

Available 24*7 on WhatsApp / Email

[object Object]