Managerial Finance: Project Evaluation and Capital Budgeting Analysis

Verified

Added on  2021/06/17

|8
|1285
|22
Homework Assignment
AI Summary
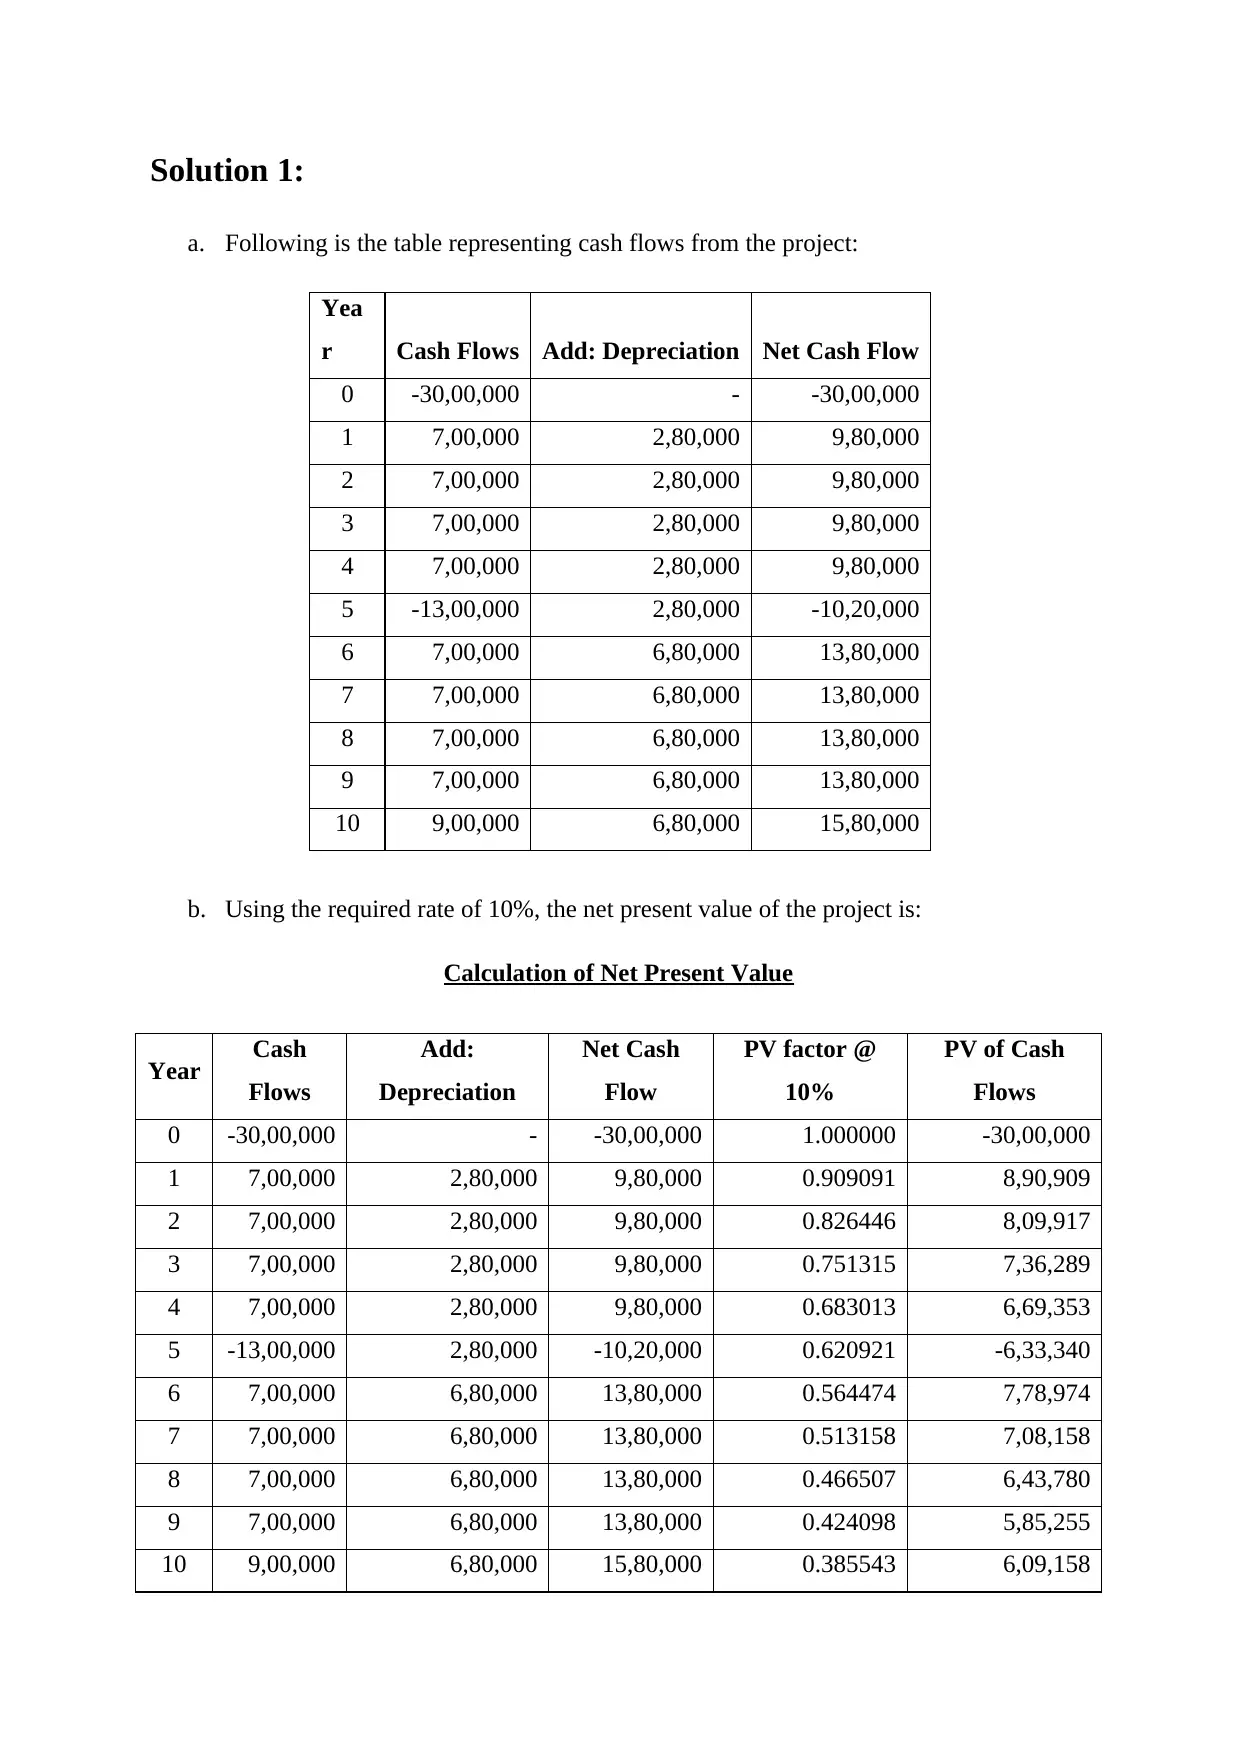
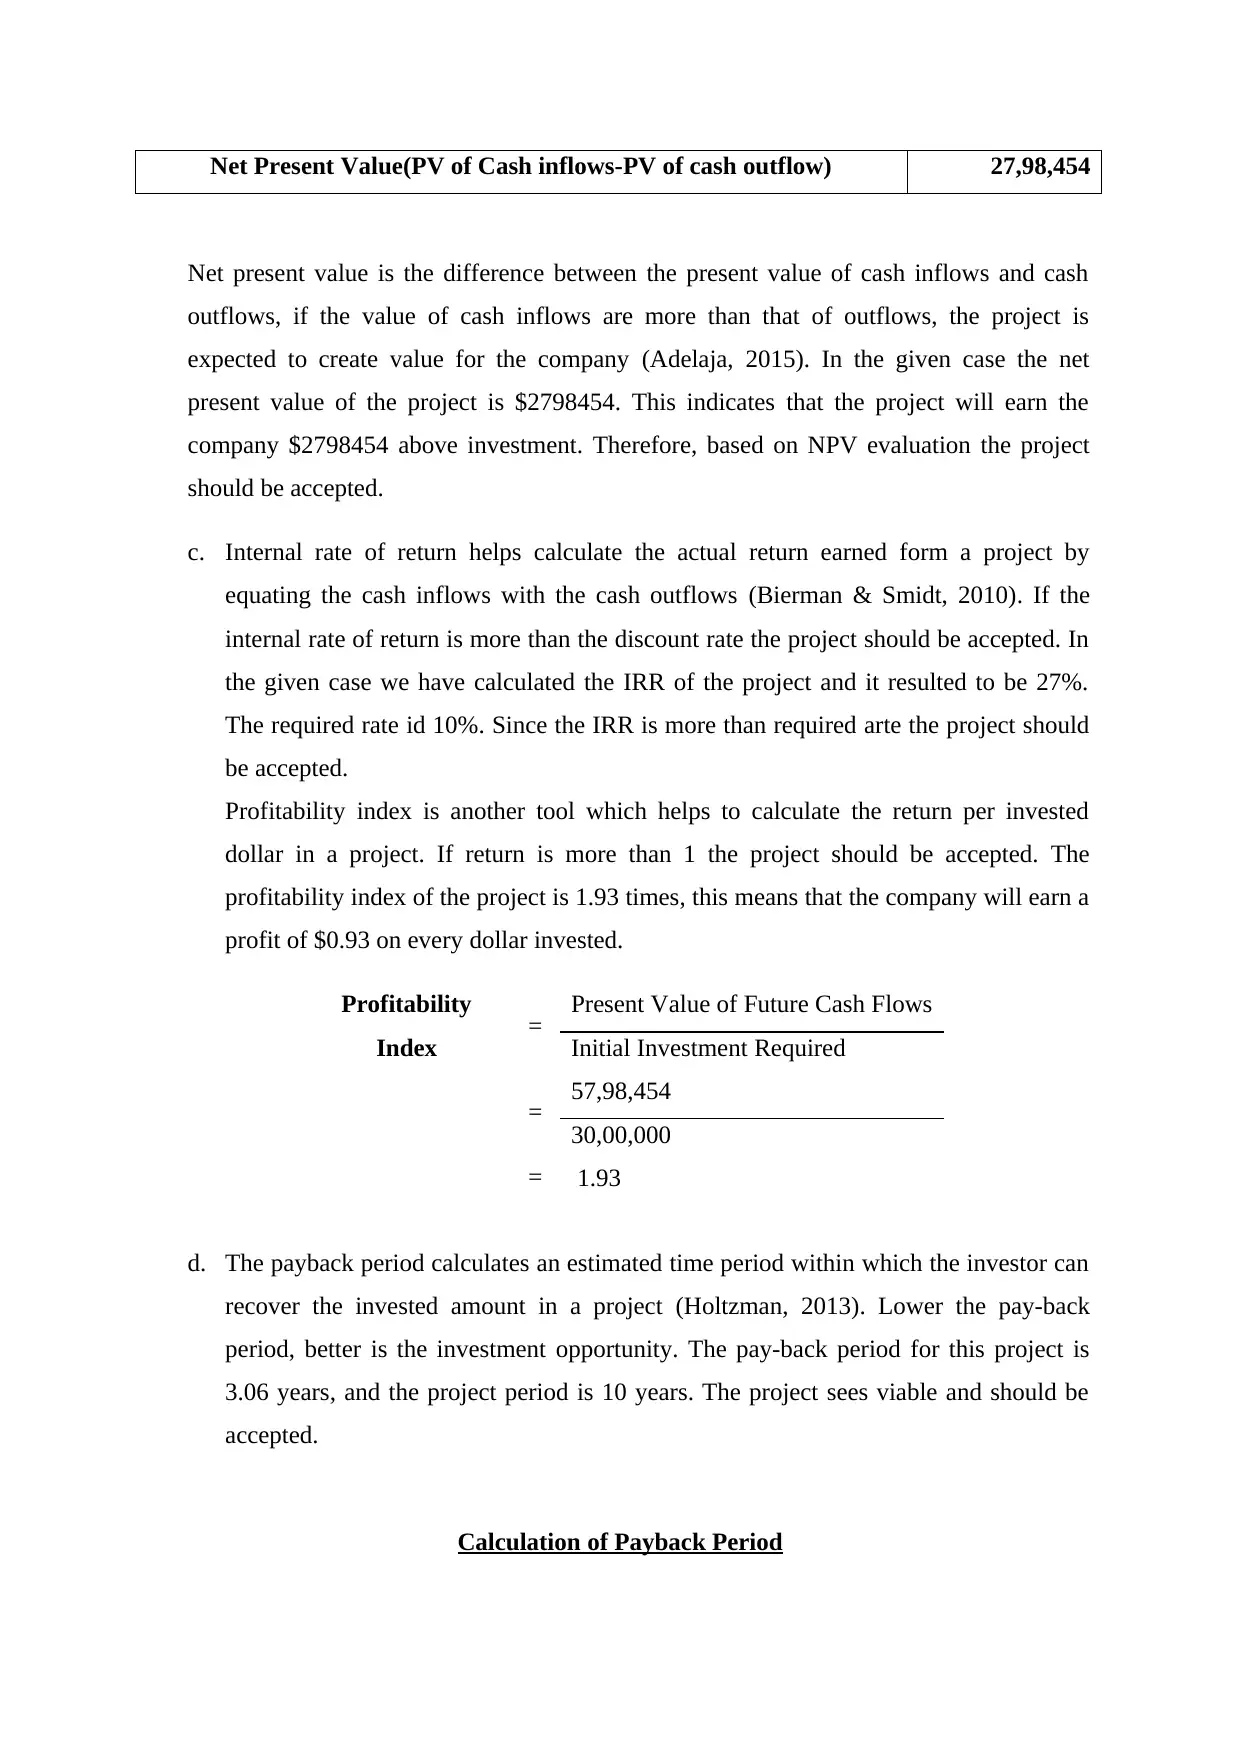
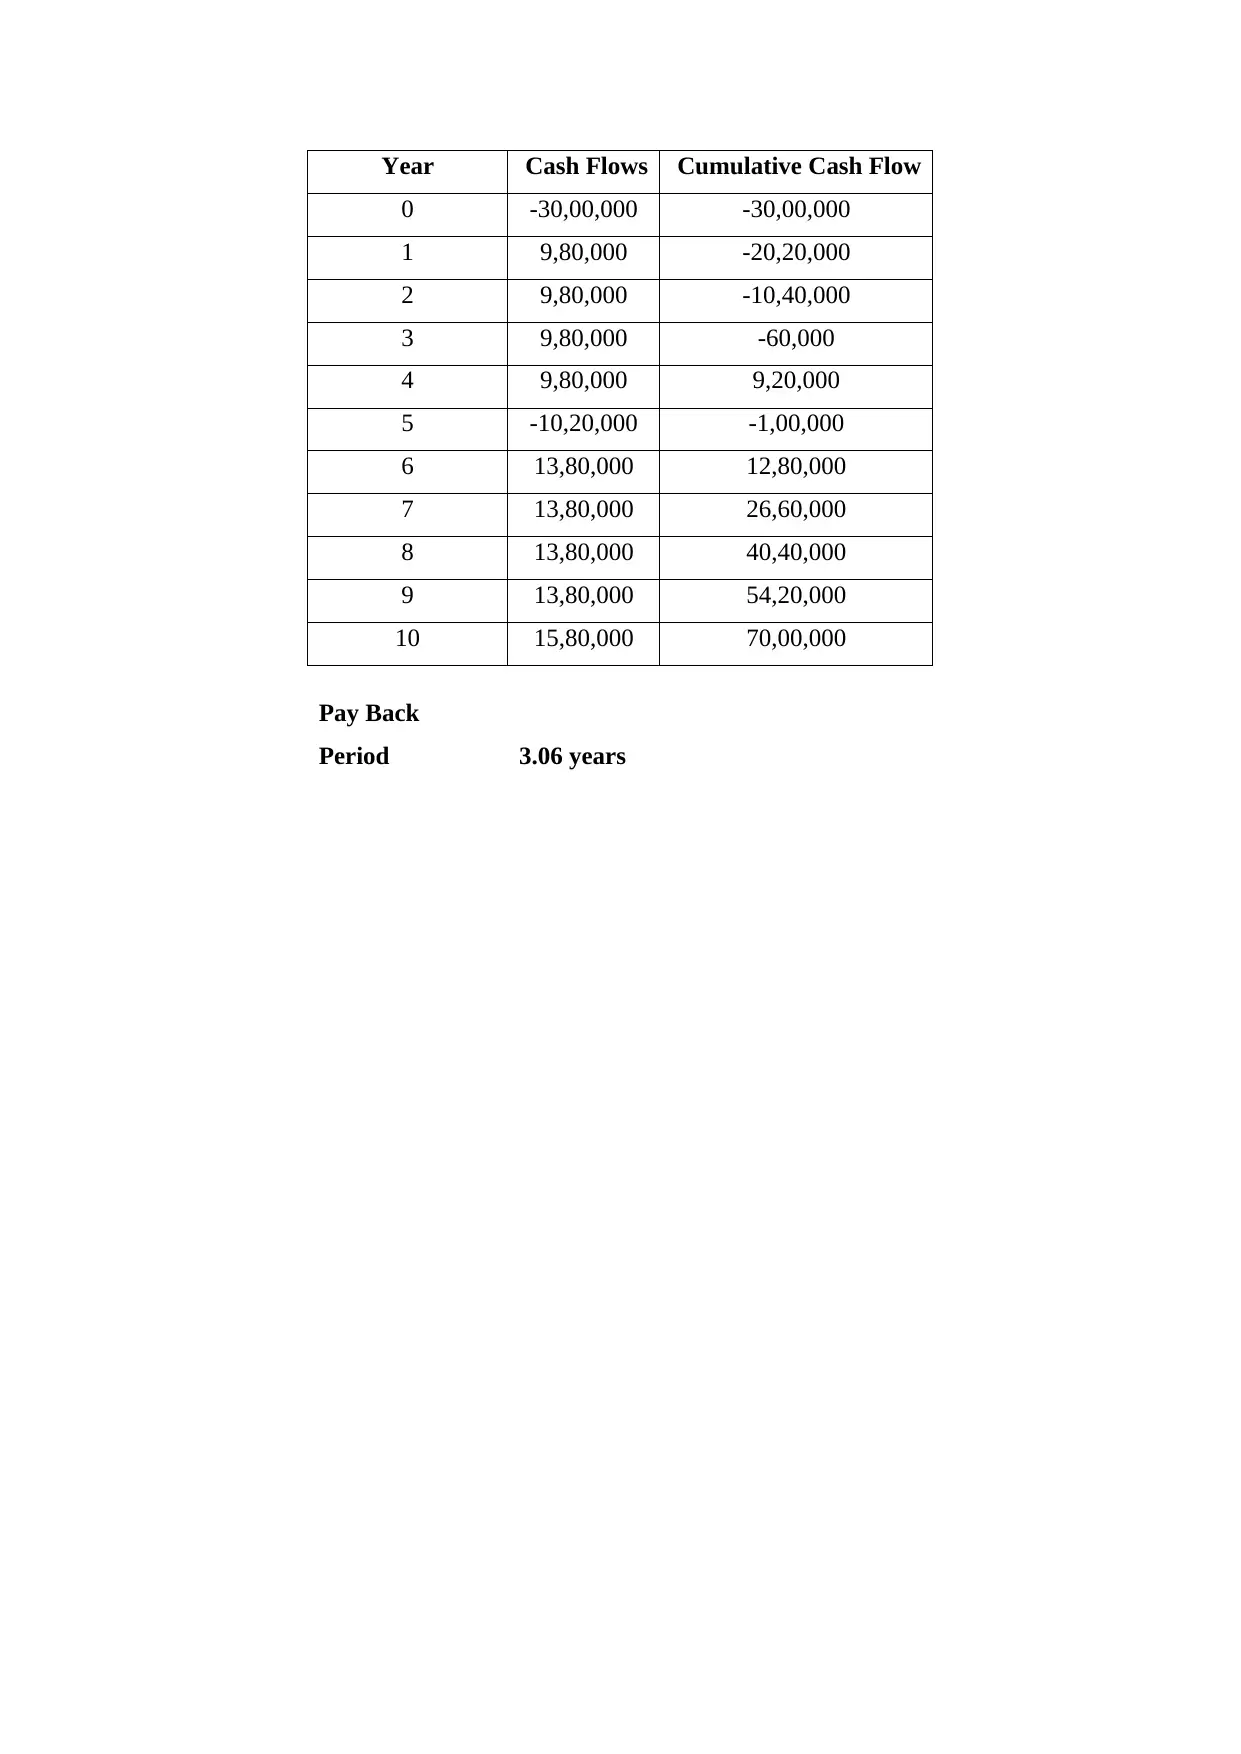
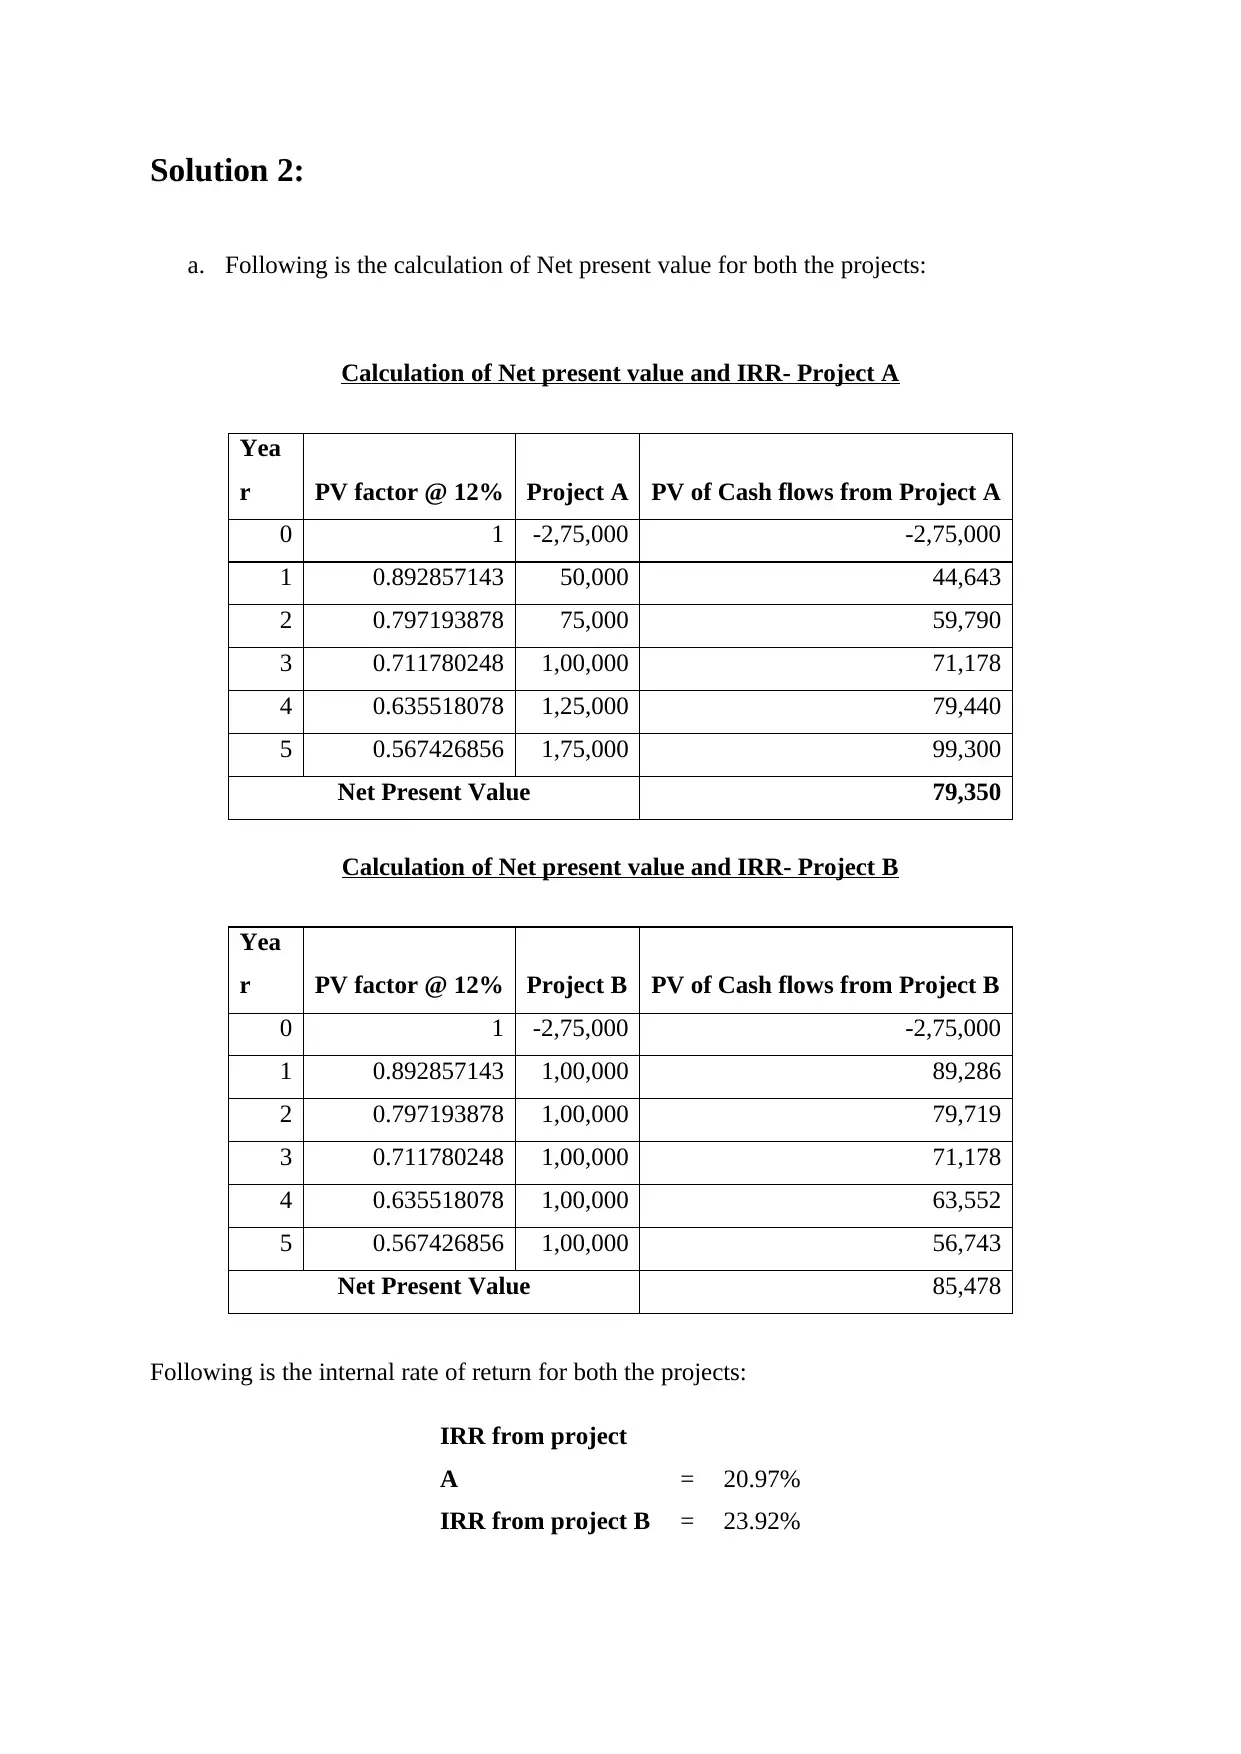
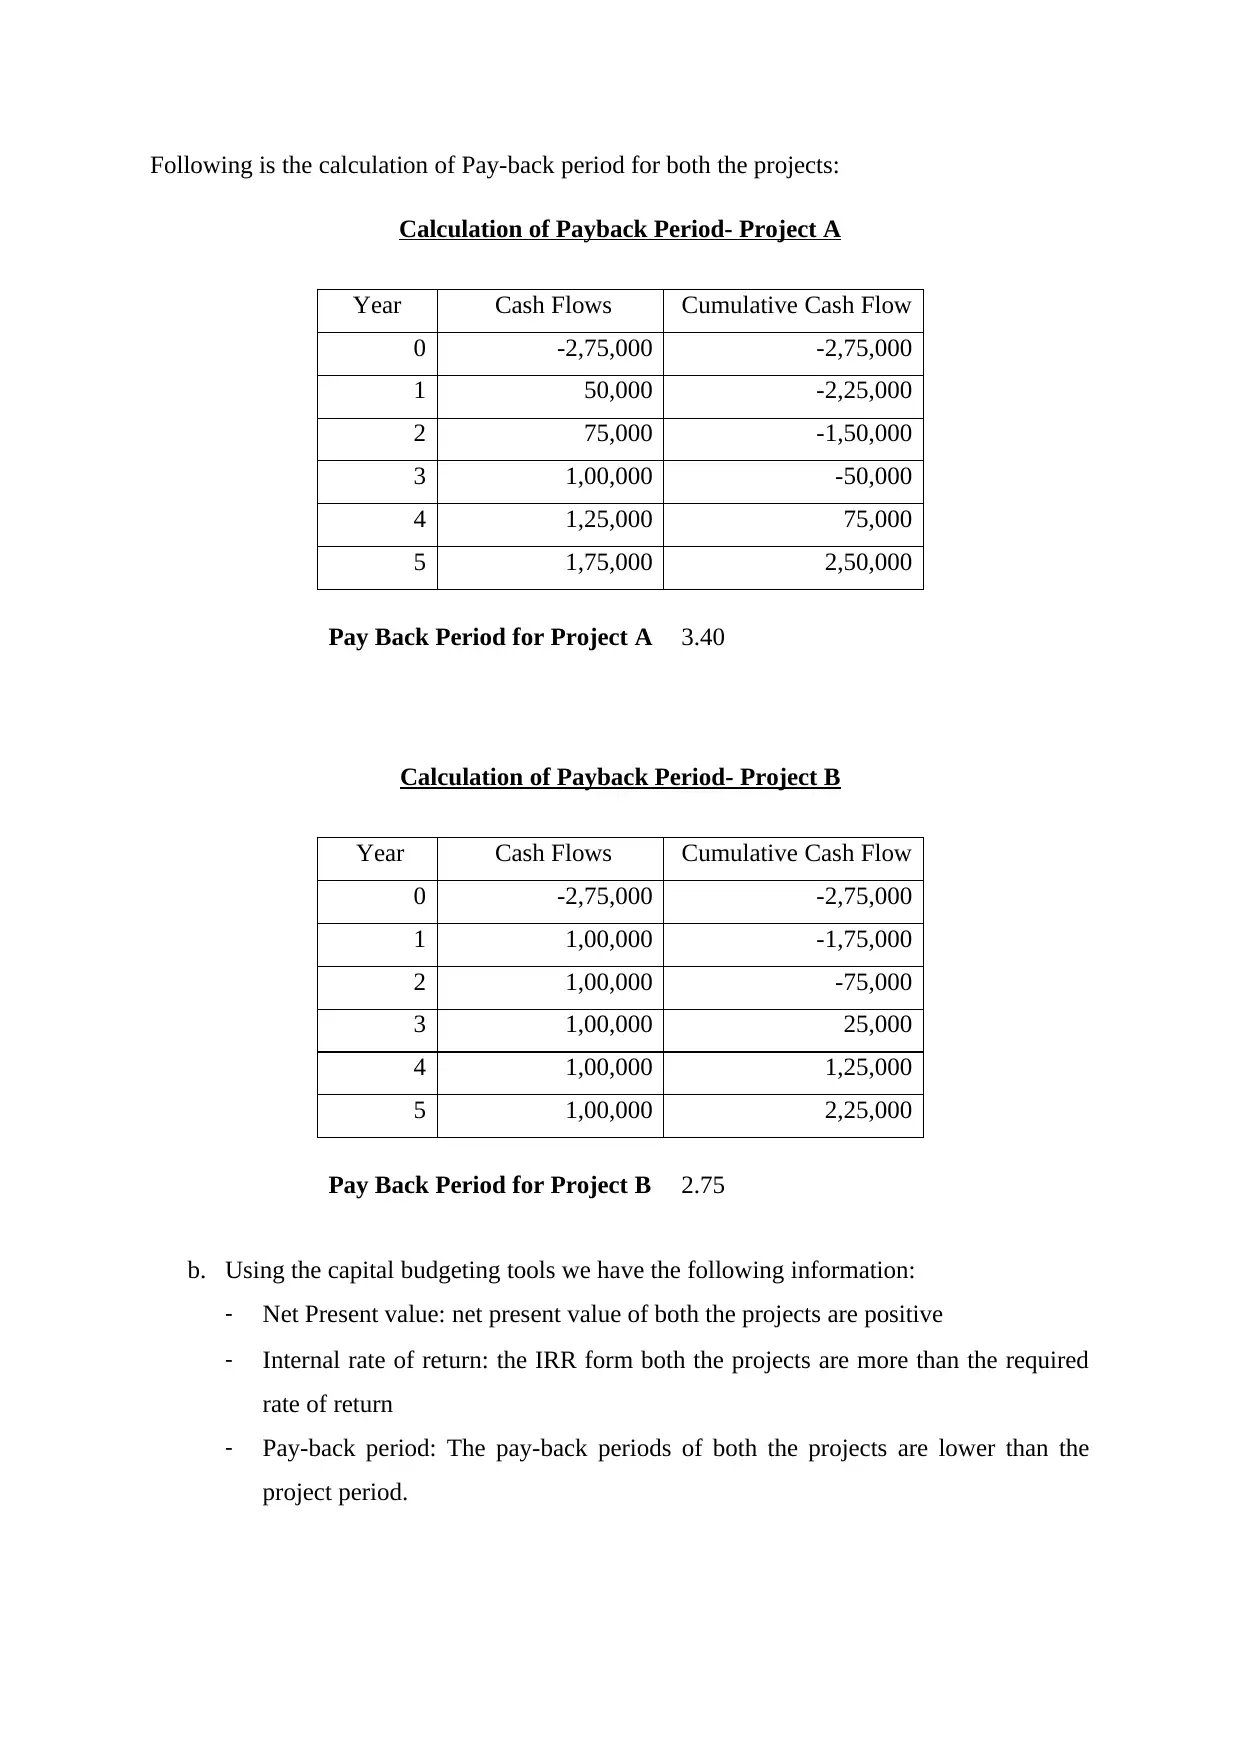
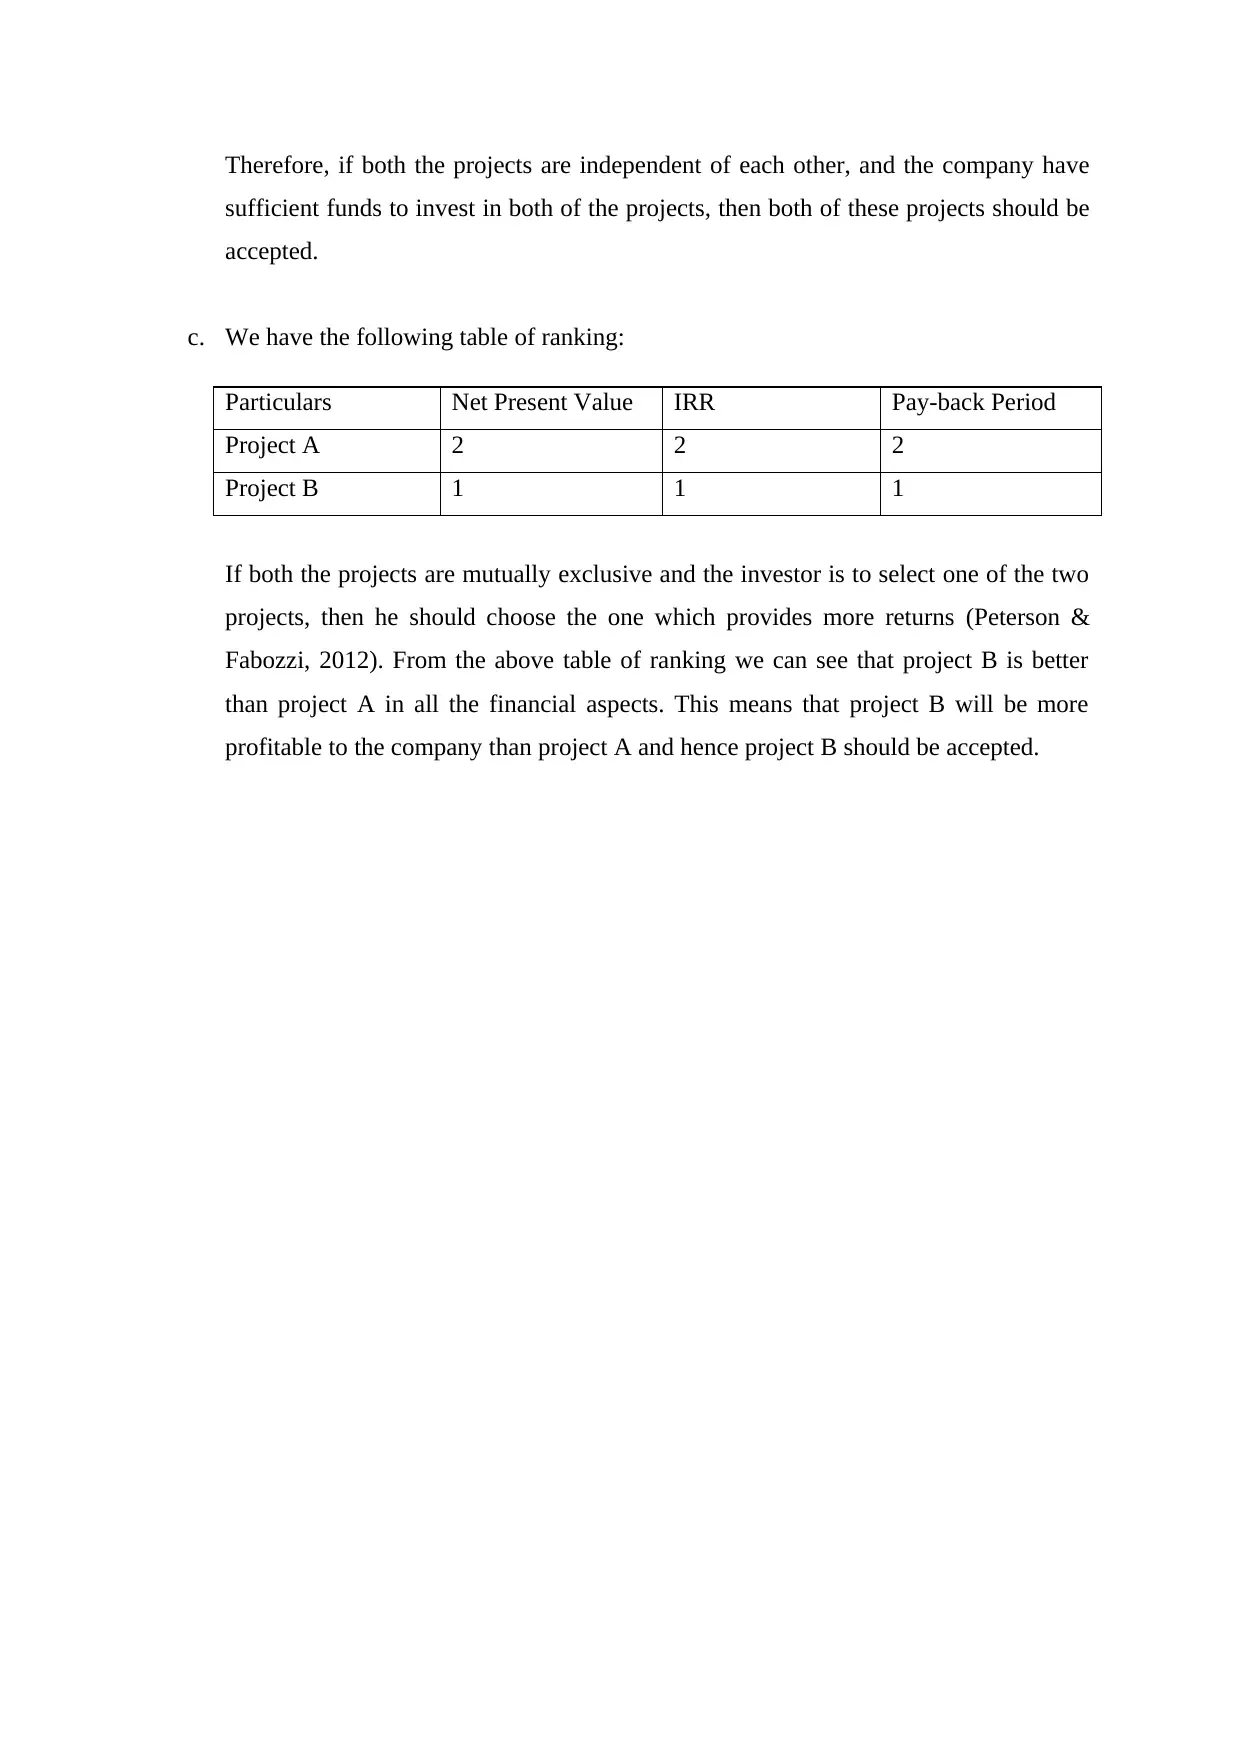
This managerial finance assignment analyzes two projects using capital budgeting techniques. The solution calculates and interprets Net Present Value (NPV), Internal Rate of Return (IRR), Profitability Index, and Payback Period for each project. Solution 1 evaluates a single project, determining its financial viability based on the calculated metrics. Solution 2 compares two mutually exclusive projects, providing a ranking based on NPV, IRR, and payback period to determine which project offers the better financial return. The assignment emphasizes the importance of these tools in making sound investment decisions, with detailed calculations and explanations. The analysis includes a discussion of the financial implications of each project, along with a conclusion about which project to accept. The document references several academic sources to support the financial analysis.
tabler-icon-diamond-filled.svg

Contribute Materials

Your contribution can guide someone’s learning journey. Share your documents today.
Document Page
Managerial Finance
tabler-icon-diamond-filled.svg

Secure Best Marks with AI Grader

Need help grading? Try our AI Grader for instant feedback on your assignments.
Document Page
Solution 1:
a. Following is the table representing cash flows from the project:
Yea
r Cash Flows Add: Depreciation Net Cash Flow
0 -30,00,000 - -30,00,000
1 7,00,000 2,80,000 9,80,000
2 7,00,000 2,80,000 9,80,000
3 7,00,000 2,80,000 9,80,000
4 7,00,000 2,80,000 9,80,000
5 -13,00,000 2,80,000 -10,20,000
6 7,00,000 6,80,000 13,80,000
7 7,00,000 6,80,000 13,80,000
8 7,00,000 6,80,000 13,80,000
9 7,00,000 6,80,000 13,80,000
10 9,00,000 6,80,000 15,80,000
b. Using the required rate of 10%, the net present value of the project is:
Calculation of Net Present Value
Year Cash
Flows
Add:
Depreciation
Net Cash
Flow
PV factor @
10%
PV of Cash
Flows
0 -30,00,000 - -30,00,000 1.000000 -30,00,000
1 7,00,000 2,80,000 9,80,000 0.909091 8,90,909
2 7,00,000 2,80,000 9,80,000 0.826446 8,09,917
3 7,00,000 2,80,000 9,80,000 0.751315 7,36,289
4 7,00,000 2,80,000 9,80,000 0.683013 6,69,353
5 -13,00,000 2,80,000 -10,20,000 0.620921 -6,33,340
6 7,00,000 6,80,000 13,80,000 0.564474 7,78,974
7 7,00,000 6,80,000 13,80,000 0.513158 7,08,158
8 7,00,000 6,80,000 13,80,000 0.466507 6,43,780
9 7,00,000 6,80,000 13,80,000 0.424098 5,85,255
10 9,00,000 6,80,000 15,80,000 0.385543 6,09,158
Document Page
Net Present Value(PV of Cash inflows-PV of cash outflow) 27,98,454
Net present value is the difference between the present value of cash inflows and cash
outflows, if the value of cash inflows are more than that of outflows, the project is
expected to create value for the company (Adelaja, 2015). In the given case the net
present value of the project is $2798454. This indicates that the project will earn the
company $2798454 above investment. Therefore, based on NPV evaluation the project
should be accepted.
c. Internal rate of return helps calculate the actual return earned form a project by
equating the cash inflows with the cash outflows (Bierman & Smidt, 2010). If the
internal rate of return is more than the discount rate the project should be accepted. In
the given case we have calculated the IRR of the project and it resulted to be 27%.
The required rate id 10%. Since the IRR is more than required arte the project should
be accepted.
Profitability index is another tool which helps to calculate the return per invested
dollar in a project. If return is more than 1 the project should be accepted. The
profitability index of the project is 1.93 times, this means that the company will earn a
profit of $0.93 on every dollar invested.
Profitability
Index = Present Value of Future Cash Flows
Initial Investment Required
= 57,98,454
30,00,000
= 1.93
d. The payback period calculates an estimated time period within which the investor can
recover the invested amount in a project (Holtzman, 2013). Lower the pay-back
period, better is the investment opportunity. The pay-back period for this project is
3.06 years, and the project period is 10 years. The project sees viable and should be
accepted.
Calculation of Payback Period
Document Page
Year Cash Flows Cumulative Cash Flow
0 -30,00,000 -30,00,000
1 9,80,000 -20,20,000
2 9,80,000 -10,40,000
3 9,80,000 -60,000
4 9,80,000 9,20,000
5 -10,20,000 -1,00,000
6 13,80,000 12,80,000
7 13,80,000 26,60,000
8 13,80,000 40,40,000
9 13,80,000 54,20,000
10 15,80,000 70,00,000
Pay Back
Period 3.06 years
tabler-icon-diamond-filled.svg

Secure Best Marks with AI Grader

Need help grading? Try our AI Grader for instant feedback on your assignments.
Document Page
Solution 2:
a. Following is the calculation of Net present value for both the projects:
Calculation of Net present value and IRR- Project A
Yea
r PV factor @ 12% Project A PV of Cash flows from Project A
0 1 -2,75,000 -2,75,000
1 0.892857143 50,000 44,643
2 0.797193878 75,000 59,790
3 0.711780248 1,00,000 71,178
4 0.635518078 1,25,000 79,440
5 0.567426856 1,75,000 99,300
Net Present Value 79,350
Calculation of Net present value and IRR- Project B
Yea
r PV factor @ 12% Project B PV of Cash flows from Project B
0 1 -2,75,000 -2,75,000
1 0.892857143 1,00,000 89,286
2 0.797193878 1,00,000 79,719
3 0.711780248 1,00,000 71,178
4 0.635518078 1,00,000 63,552
5 0.567426856 1,00,000 56,743
Net Present Value 85,478
Following is the internal rate of return for both the projects:
IRR from project
A = 20.97%
IRR from project B = 23.92%
Document Page
Following is the calculation of Pay-back period for both the projects:
Calculation of Payback Period- Project A
Year Cash Flows Cumulative Cash Flow
0 -2,75,000 -2,75,000
1 50,000 -2,25,000
2 75,000 -1,50,000
3 1,00,000 -50,000
4 1,25,000 75,000
5 1,75,000 2,50,000
Pay Back Period for Project A 3.40
Calculation of Payback Period- Project B
Year Cash Flows Cumulative Cash Flow
0 -2,75,000 -2,75,000
1 1,00,000 -1,75,000
2 1,00,000 -75,000
3 1,00,000 25,000
4 1,00,000 1,25,000
5 1,00,000 2,25,000
Pay Back Period for Project B 2.75
b. Using the capital budgeting tools we have the following information:
- Net Present value: net present value of both the projects are positive
- Internal rate of return: the IRR form both the projects are more than the required
rate of return
- Pay-back period: The pay-back periods of both the projects are lower than the
project period.
Document Page
Therefore, if both the projects are independent of each other, and the company have
sufficient funds to invest in both of the projects, then both of these projects should be
accepted.
c. We have the following table of ranking:
Particulars Net Present Value IRR Pay-back Period
Project A 2 2 2
Project B 1 1 1
If both the projects are mutually exclusive and the investor is to select one of the two
projects, then he should choose the one which provides more returns (Peterson &
Fabozzi, 2012). From the above table of ranking we can see that project B is better
than project A in all the financial aspects. This means that project B will be more
profitable to the company than project A and hence project B should be accepted.
tabler-icon-diamond-filled.svg

Paraphrase This Document

Need a fresh take? Get an instant paraphrase of this document with our AI Paraphraser
Document Page
Bibliography
Adelaja, T. (2015). Capital Budgeting: Investment Appraisal Techniques Under Certainty.
Chicago: CreateSpace Independent Publishing Platform .
Bierman, H., & Smidt, S. (2010). The Capital Budgeting Decision. Boston: Routledge.
Dayananda, D., Irons, R., Harrison, S., Herbohn, J., & Rowland, P. (2008). Capital
Budgeting: Financial Appraisal of Investment Projects. Cambridge: Cambridge University
Press.
Holtzman, M. (2013). Managerial Accounting For Dummies. Hoboken, NJ: Wiley.
Menifield, C. E. (2014). The Basics of Public Budgeting and Financial Management: A
Handbook for Academics and Practitioners. Lanham, Md.: University Press of America.
Noreen, E. (2015). The theory of constraints and its implications for management accounting.
Great Barrington, MA: North River Press.
Nwanji, T. (2016). Retrieved from http://www.managementjournals.com:
http://www.managementjournals.com/journals/ig/vol1/21-1-1-1.pdf
Peterson, P. P., & Fabozzi, F. J. (2012). Capital Budgeting. New York, NY: Wiley.
Rivenbark, W. C., Vogt, J., & Marlowe, J. (2009). Capital Budgeting and Finance: A Guide
for Local Governments. Washington, D.C.: ICMA Press.
Seal, W. (2012). Management accounting. Maidenhead: McGraw-Hill Higher Education.
Seitz, N., & Ellison, M. (2009). Capital Budgeting and Long-Term Financing Decisions.
New York: Thomson Learning.
Shapiro, A. C. (2007). Capital Budgeting and Investment Analysis. New Jersey: Wiley.
chevron_up_icon
1 out of 8
circle_padding
hide_on_mobile
zoom_out_icon
logo.png

Your All-in-One AI-Powered Toolkit for Academic Success.

Available 24*7 on WhatsApp / Email

[object Object]