Financial Management Report: Capital Budgeting and Financial Analysis
VerifiedAdded on 2020/03/16
|20
|4184
|205
Report
AI Summary
This financial management report begins with an analysis of two investment projects, evaluating them based on net present values, payback periods, and average annual rates of return, concluding that Project B is the more suitable investment. The report then calculates various elements of financial statements, followed by a critical analysis of Jaguar Land Rover's financial performance using ratio analysis, revealing areas for improvement. Finally, it discusses the importance of budgeting in financial planning, emphasizing the need for participation from all management levels. The report provides a comprehensive overview of capital budgeting techniques, financial statement analysis, and the application of financial ratios to assess a company's performance.

Running Head: Financial Management
Capital Budgeting & Financial Analysis
Capital Budgeting & Financial Analysis
Paraphrase This Document
Need a fresh take? Get an instant paraphrase of this document with our AI Paraphraser
Financial Management 1
Executive summary:
In the first part of report the two projects investments are analysed on the basis of their net
present values, payback periods and the average annual rate of return. From the results of
those capital budgeting techniques project B is considered as the appropriate investment
proposal due to the fact that it is providing higher returns and keeps the ability to recover its
invested amounts in the shorter time than the project A. In the second part various elements
of financial statements have been calculated using certain financial formulas. Using those
calculated amounts the extract for the next year is drawn. In the third part, critical analysis of
financial performance of Jaguar Land Rover is made using ratio analysis approach which
proved that in company needs to improve its performance in certain areas and in some
financial areas it is currently performing well. In the last part of the report, the budgeting
process and its importance is discussed as budgets are necessary for financial planning and
therefore participation from all the levels of management is necessary to make the best use of
budgeting practices.
Financial Management 2
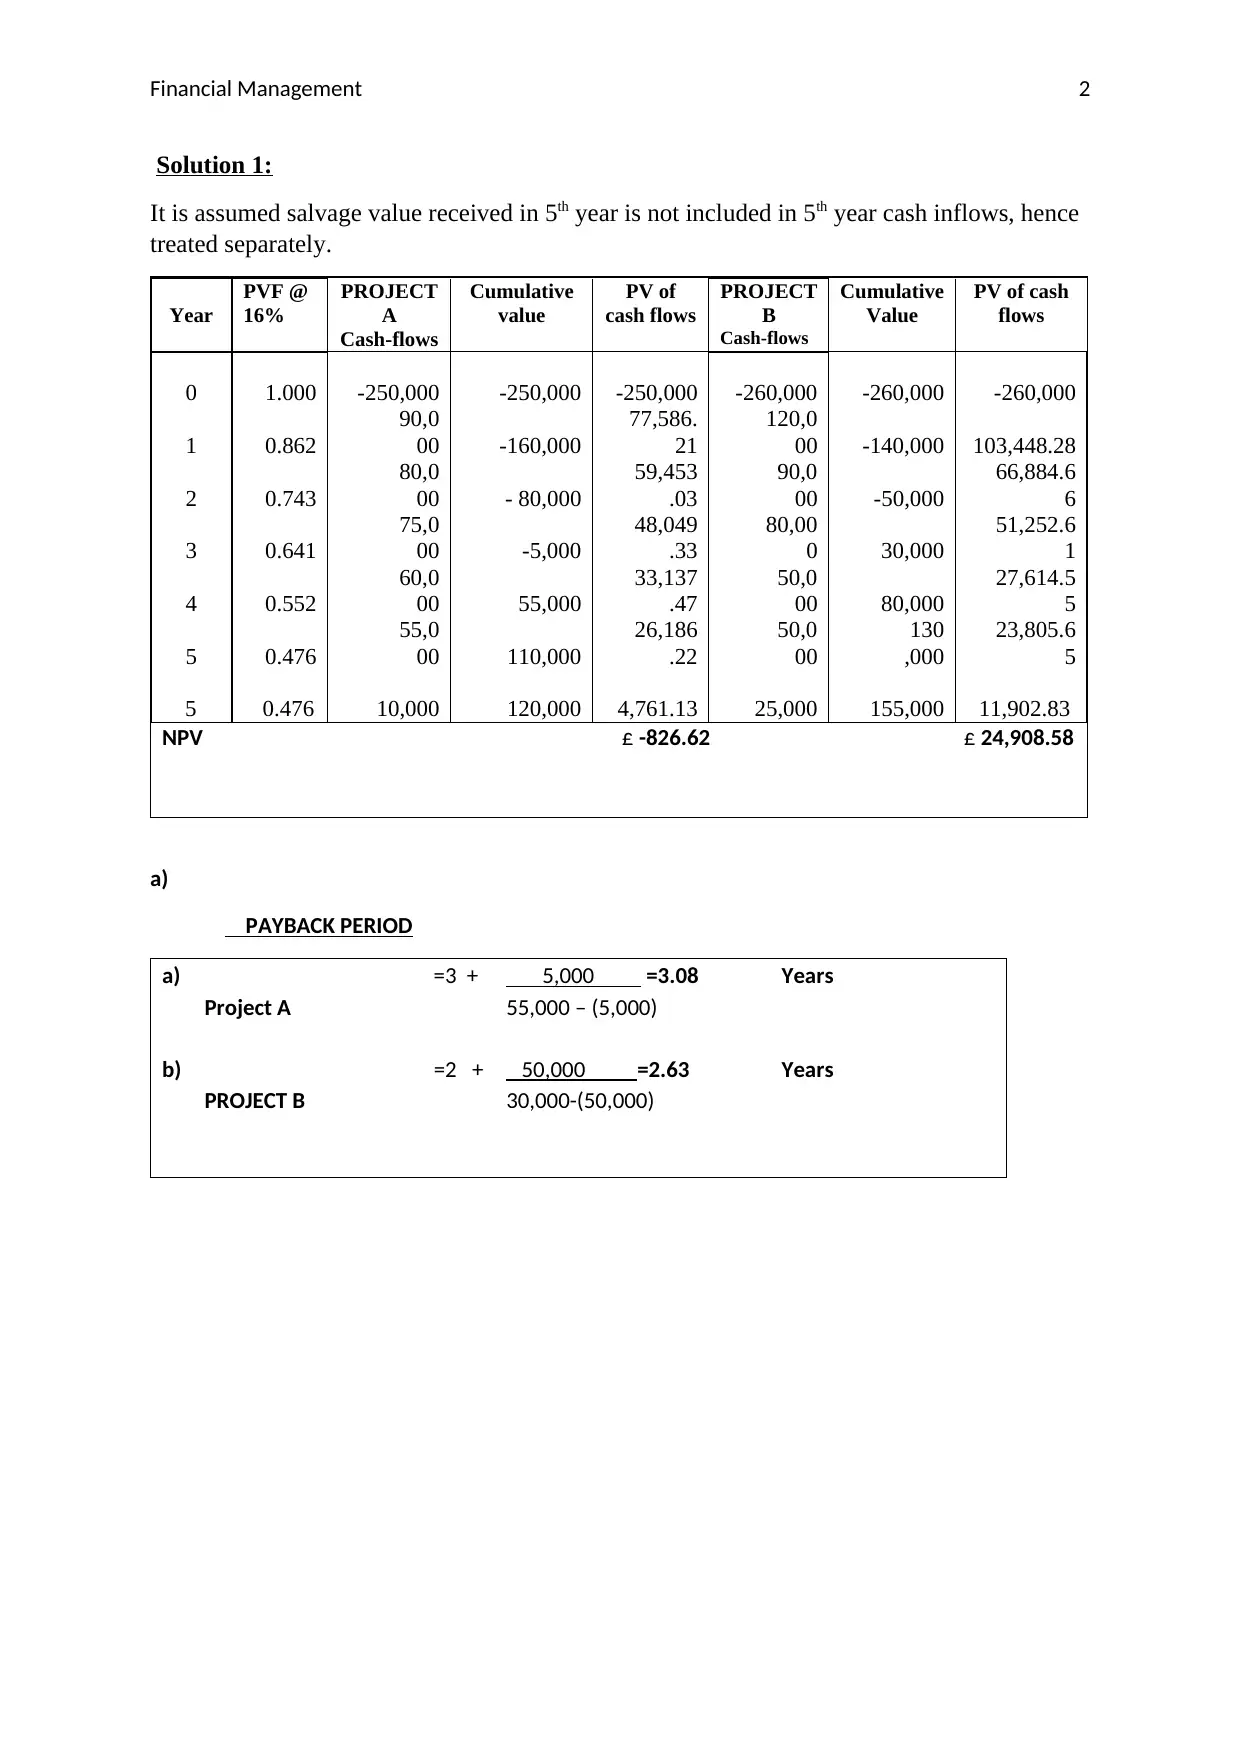
Solution 1:
It is assumed salvage value received in 5th year is not included in 5th year cash inflows, hence
treated separately.
Year
PVF @
16%
PROJECT
A
Cash-flows
Cumulative
value
PV of
cash flows
PROJECT
B
Cash-flows
Cumulative
Value
PV of cash
flows
0 1.000 -250,000 -250,000 -250,000 -260,000 -260,000 -260,000
1 0.862
90,0
00 -160,000
77,586.
21
120,0
00 -140,000 103,448.28
2 0.743
80,0
00 - 80,000
59,453
.03
90,0
00 -50,000
66,884.6
6
3 0.641
75,0
00 -5,000
48,049
.33
80,00
0 30,000
51,252.6
1
4 0.552
60,0
00 55,000
33,137
.47
50,0
00 80,000
27,614.5
5
5 0.476
55,0
00 110,000
26,186
.22
50,0
00
130
,000
23,805.6
5
5 0.476 10,000 120,000 4,761.13 25,000 155,000 11,902.83
NPV £ -826.62 £ 24,908.58
a)
PAYBACK PERIOD
a) =3 + 5,000 =3.08 Years
Project A 55,000 – (5,000)
b) =2 + 50,000 =2.63 Years
PROJECT B 30,000-(50,000)
⊘ This is a preview!⊘
Do you want full access?
Subscribe today to unlock all pages.
Trusted by 1+ million students worldwide
Financial Management 3
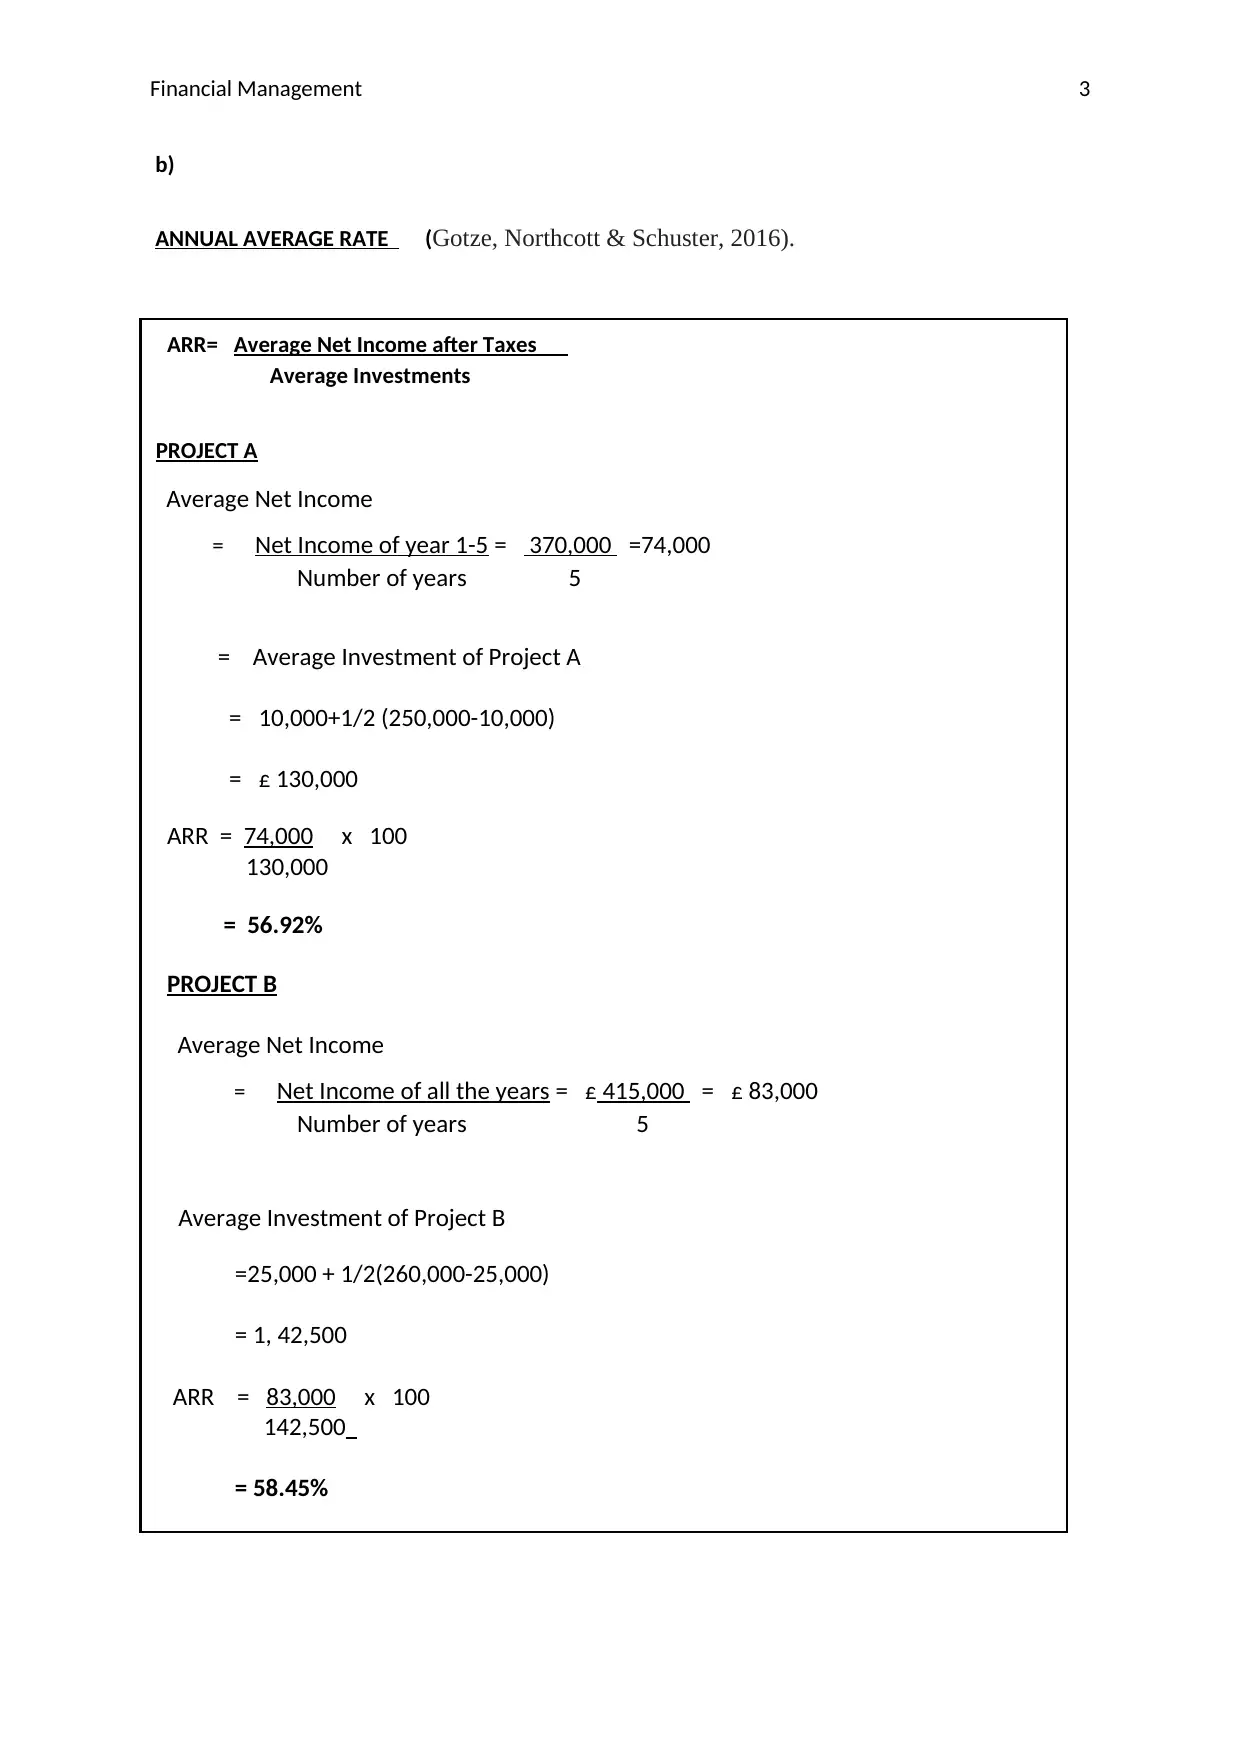
b)
ANNUAL AVERAGE RATE (Gotze, Northcott & Schuster, 2016).
ARR= Average Net Income after Taxes
Average Investments
PROJECT A
Average Net Income
= Net Income of year 1-5 = 370,000 =74,000
Number of years 5
= Average Investment of Project A
= 10,000+1/2 (250,000-10,000)
= £ 130,000
ARR = 74,000 x 100
130,000
= 56.92%
PROJECT B
Average Net Income
= Net Income of all the years = £ 415,000 = £ 83,000
Number of years 5
Average Investment of Project B
=25,000 + 1/2(260,000-25,000)
= 1, 42,500
ARR = 83,000 x 100
£ 142,500
= 58.45%
Paraphrase This Document
Need a fresh take? Get an instant paraphrase of this document with our AI Paraphraser
Financial Management 4
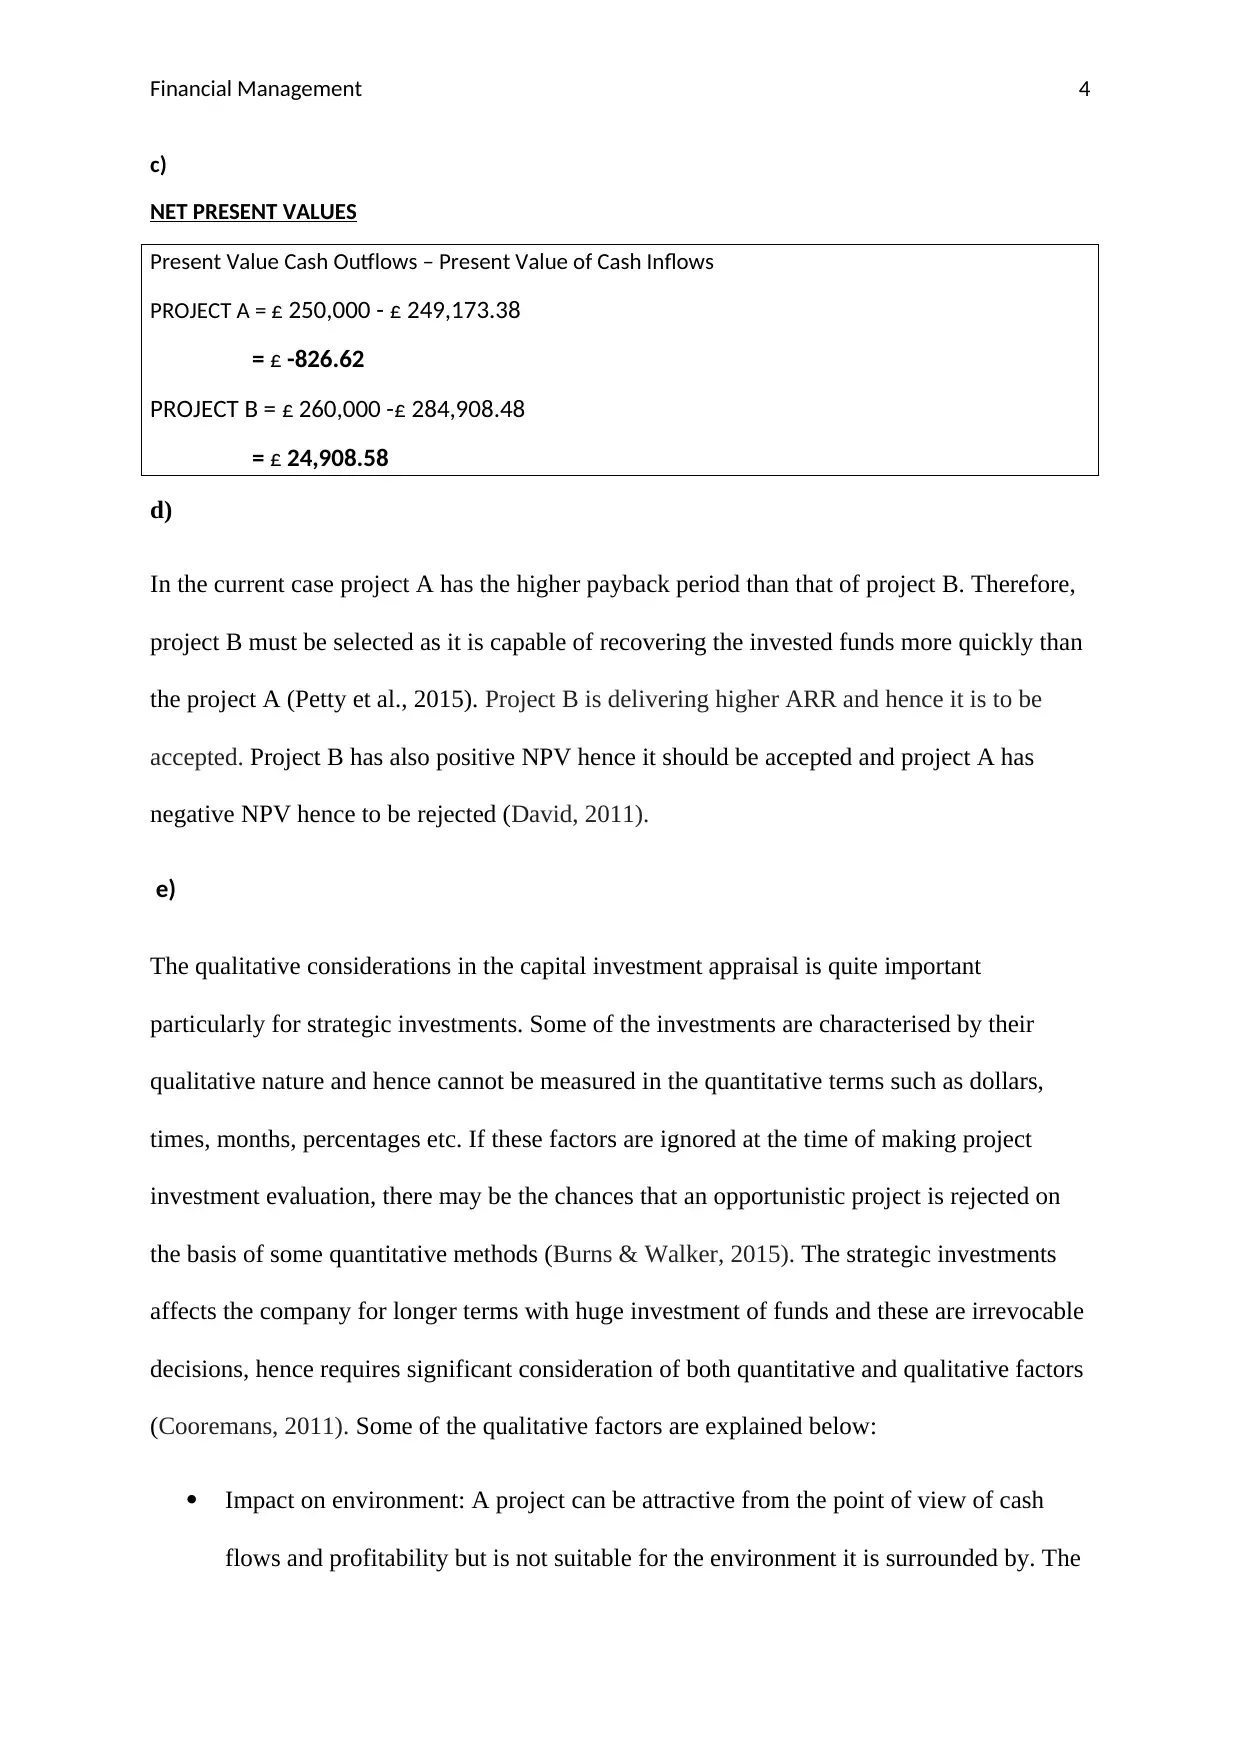
c)
NET PRESENT VALUES
Present Value Cash Outflows – Present Value of Cash Inflows
PROJECT A = £ 250,000 - £ 249,173.38
= £ -826.62
PROJECT B = £ 260,000 -£ 284,908.48
= £ 24,908.58
d)
In the current case project A has the higher payback period than that of project B. Therefore,
project B must be selected as it is capable of recovering the invested funds more quickly than
the project A (Petty et al., 2015). Project B is delivering higher ARR and hence it is to be
accepted. Project B has also positive NPV hence it should be accepted and project A has
negative NPV hence to be rejected (David, 2011).
e)
The qualitative considerations in the capital investment appraisal is quite important
particularly for strategic investments. Some of the investments are characterised by their
qualitative nature and hence cannot be measured in the quantitative terms such as dollars,
times, months, percentages etc. If these factors are ignored at the time of making project
investment evaluation, there may be the chances that an opportunistic project is rejected on
the basis of some quantitative methods (Burns & Walker, 2015). The strategic investments
affects the company for longer terms with huge investment of funds and these are irrevocable
decisions, hence requires significant consideration of both quantitative and qualitative factors
(Cooremans, 2011). Some of the qualitative factors are explained below:
Impact on environment: A project can be attractive from the point of view of cash
flows and profitability but is not suitable for the environment it is surrounded by. The
Financial Management 5
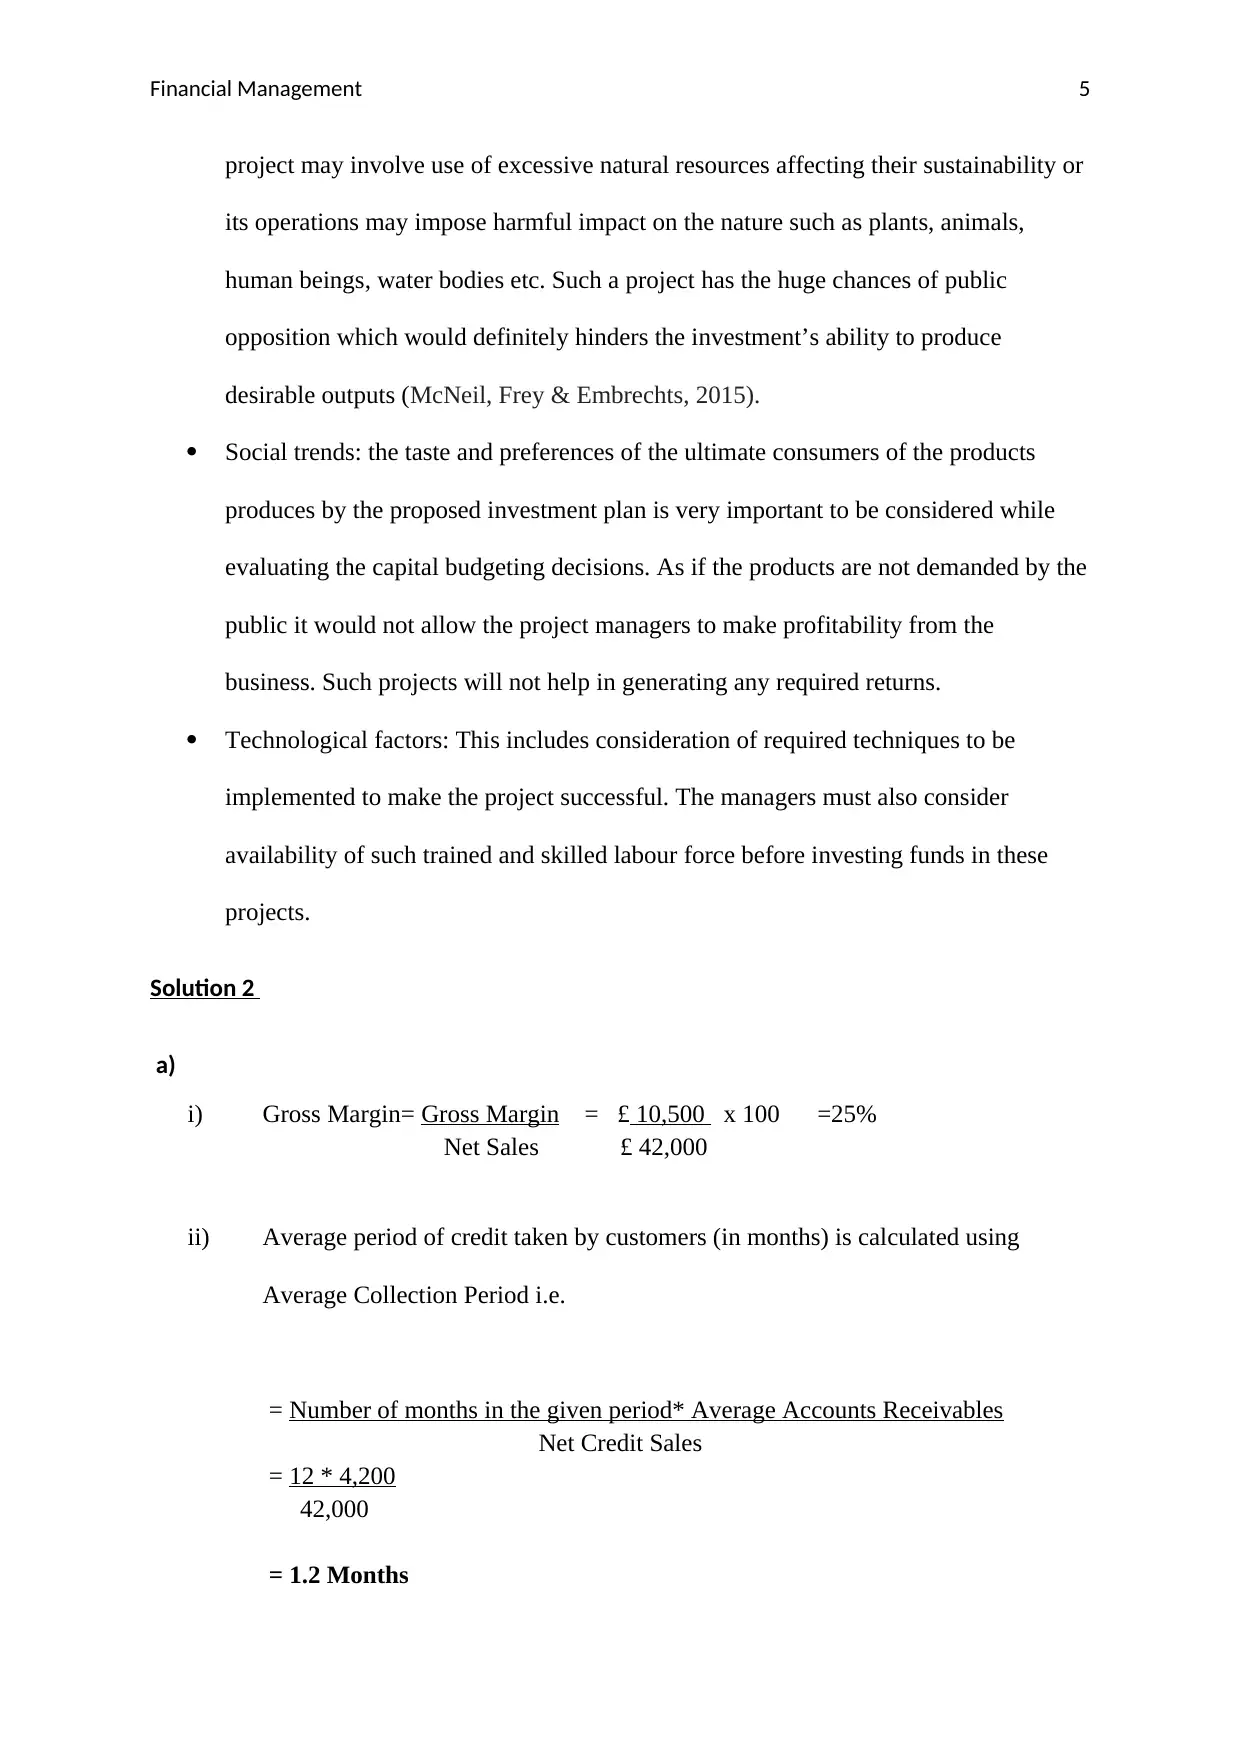
project may involve use of excessive natural resources affecting their sustainability or
its operations may impose harmful impact on the nature such as plants, animals,
human beings, water bodies etc. Such a project has the huge chances of public
opposition which would definitely hinders the investment’s ability to produce
desirable outputs (McNeil, Frey & Embrechts, 2015).
Social trends: the taste and preferences of the ultimate consumers of the products
produces by the proposed investment plan is very important to be considered while
evaluating the capital budgeting decisions. As if the products are not demanded by the
public it would not allow the project managers to make profitability from the
business. Such projects will not help in generating any required returns.
Technological factors: This includes consideration of required techniques to be
implemented to make the project successful. The managers must also consider
availability of such trained and skilled labour force before investing funds in these
projects.
Solution 2
a)
i) Gross Margin= Gross Margin = £ 10,500 x 100 =25%
Net Sales £ 42,000
ii) Average period of credit taken by customers (in months) is calculated using
Average Collection Period i.e.
= Number of months in the given period* Average Accounts Receivables
Net Credit Sales
= 12 * 4,200
42,000
= 1.2 Months
⊘ This is a preview!⊘
Do you want full access?
Subscribe today to unlock all pages.
Trusted by 1+ million students worldwide
Financial Management 6
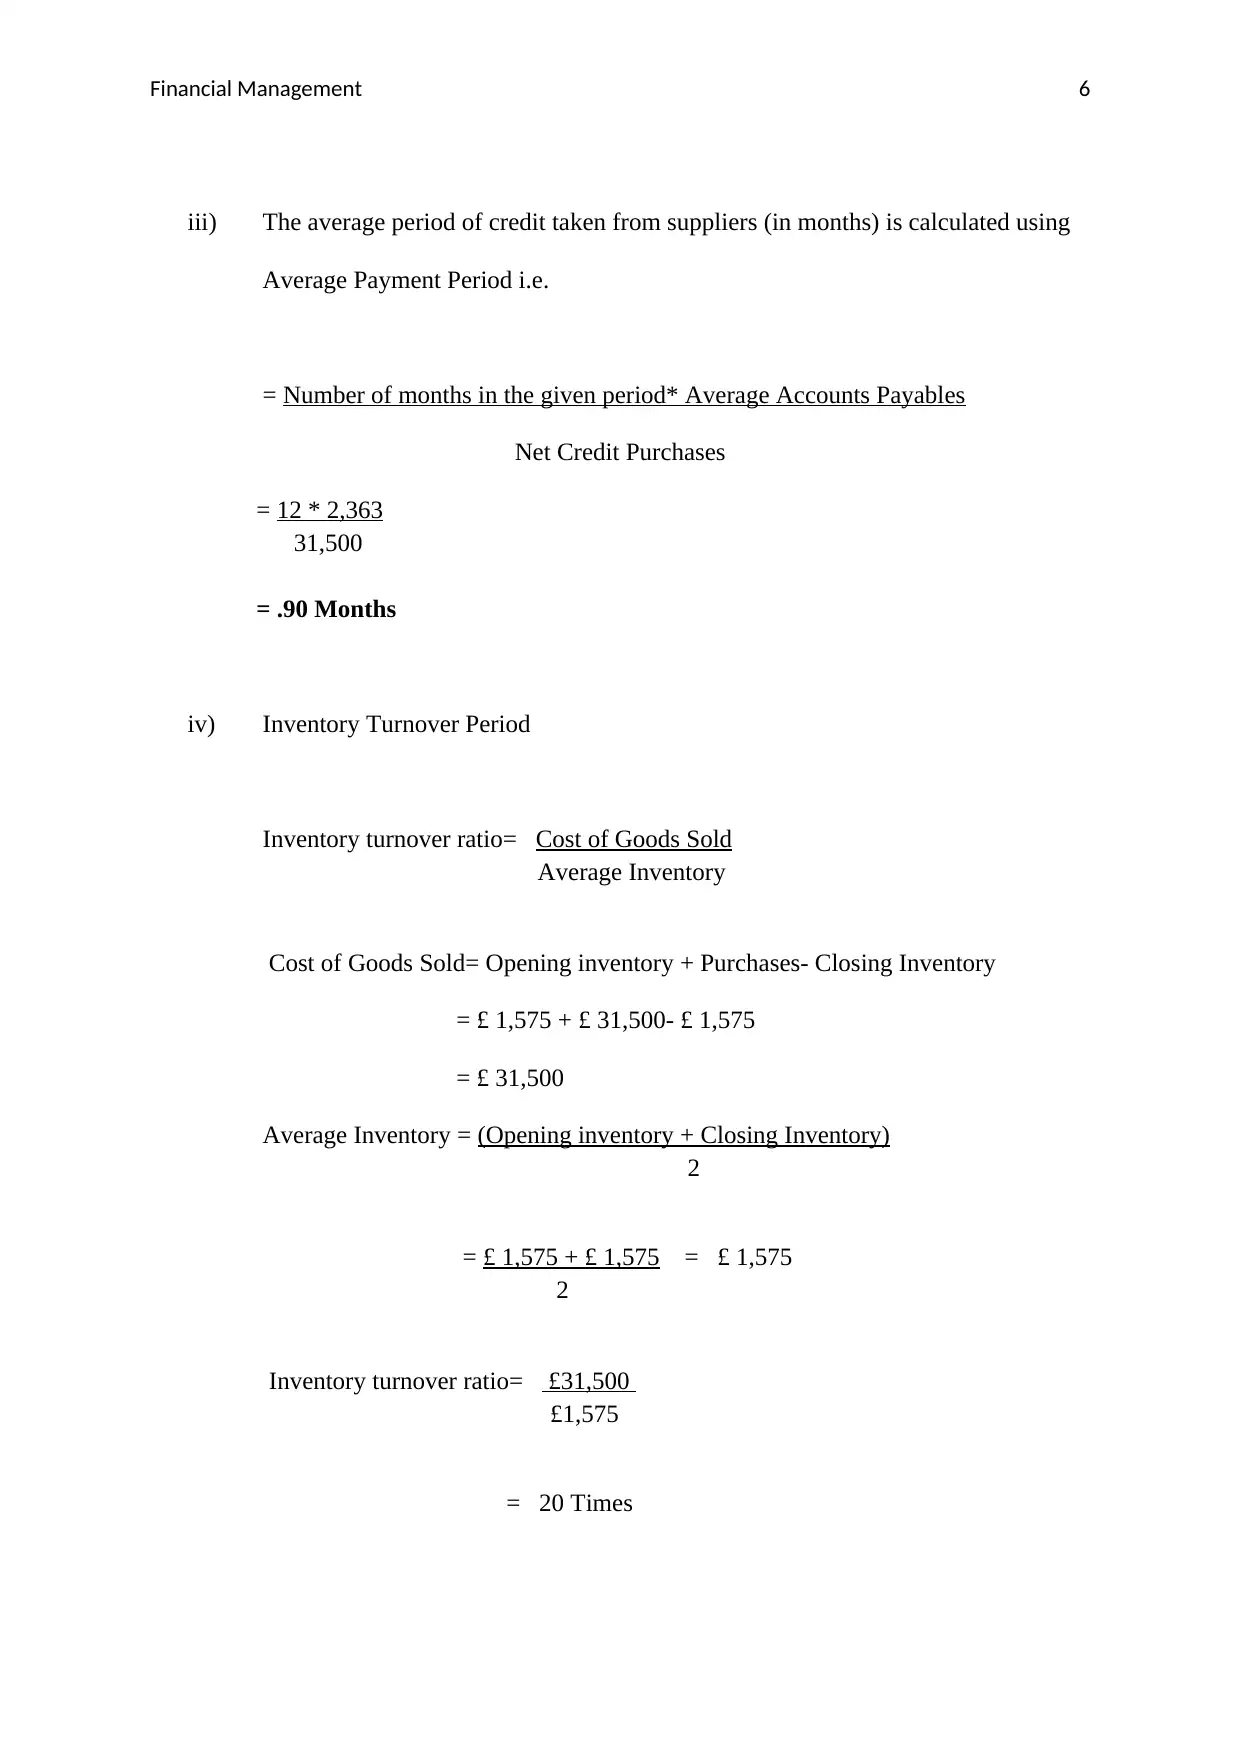
iii) The average period of credit taken from suppliers (in months) is calculated using
Average Payment Period i.e.
= Number of months in the given period* Average Accounts Payables
Net Credit Purchases
= 12 * 2,363
31,500
= .90 Months
iv) Inventory Turnover Period
Inventory turnover ratio= Cost of Goods Sold
Average Inventory
Cost of Goods Sold= Opening inventory + Purchases- Closing Inventory
= £ 1,575 + £ 31,500- £ 1,575
= £ 31,500
Average Inventory = (Opening inventory + Closing Inventory)
2
= £ 1,575 + £ 1,575 = £ 1,575
2
Inventory turnover ratio= £31,500
£1,575
= 20 Times
Paraphrase This Document
Need a fresh take? Get an instant paraphrase of this document with our AI Paraphraser
Financial Management 7
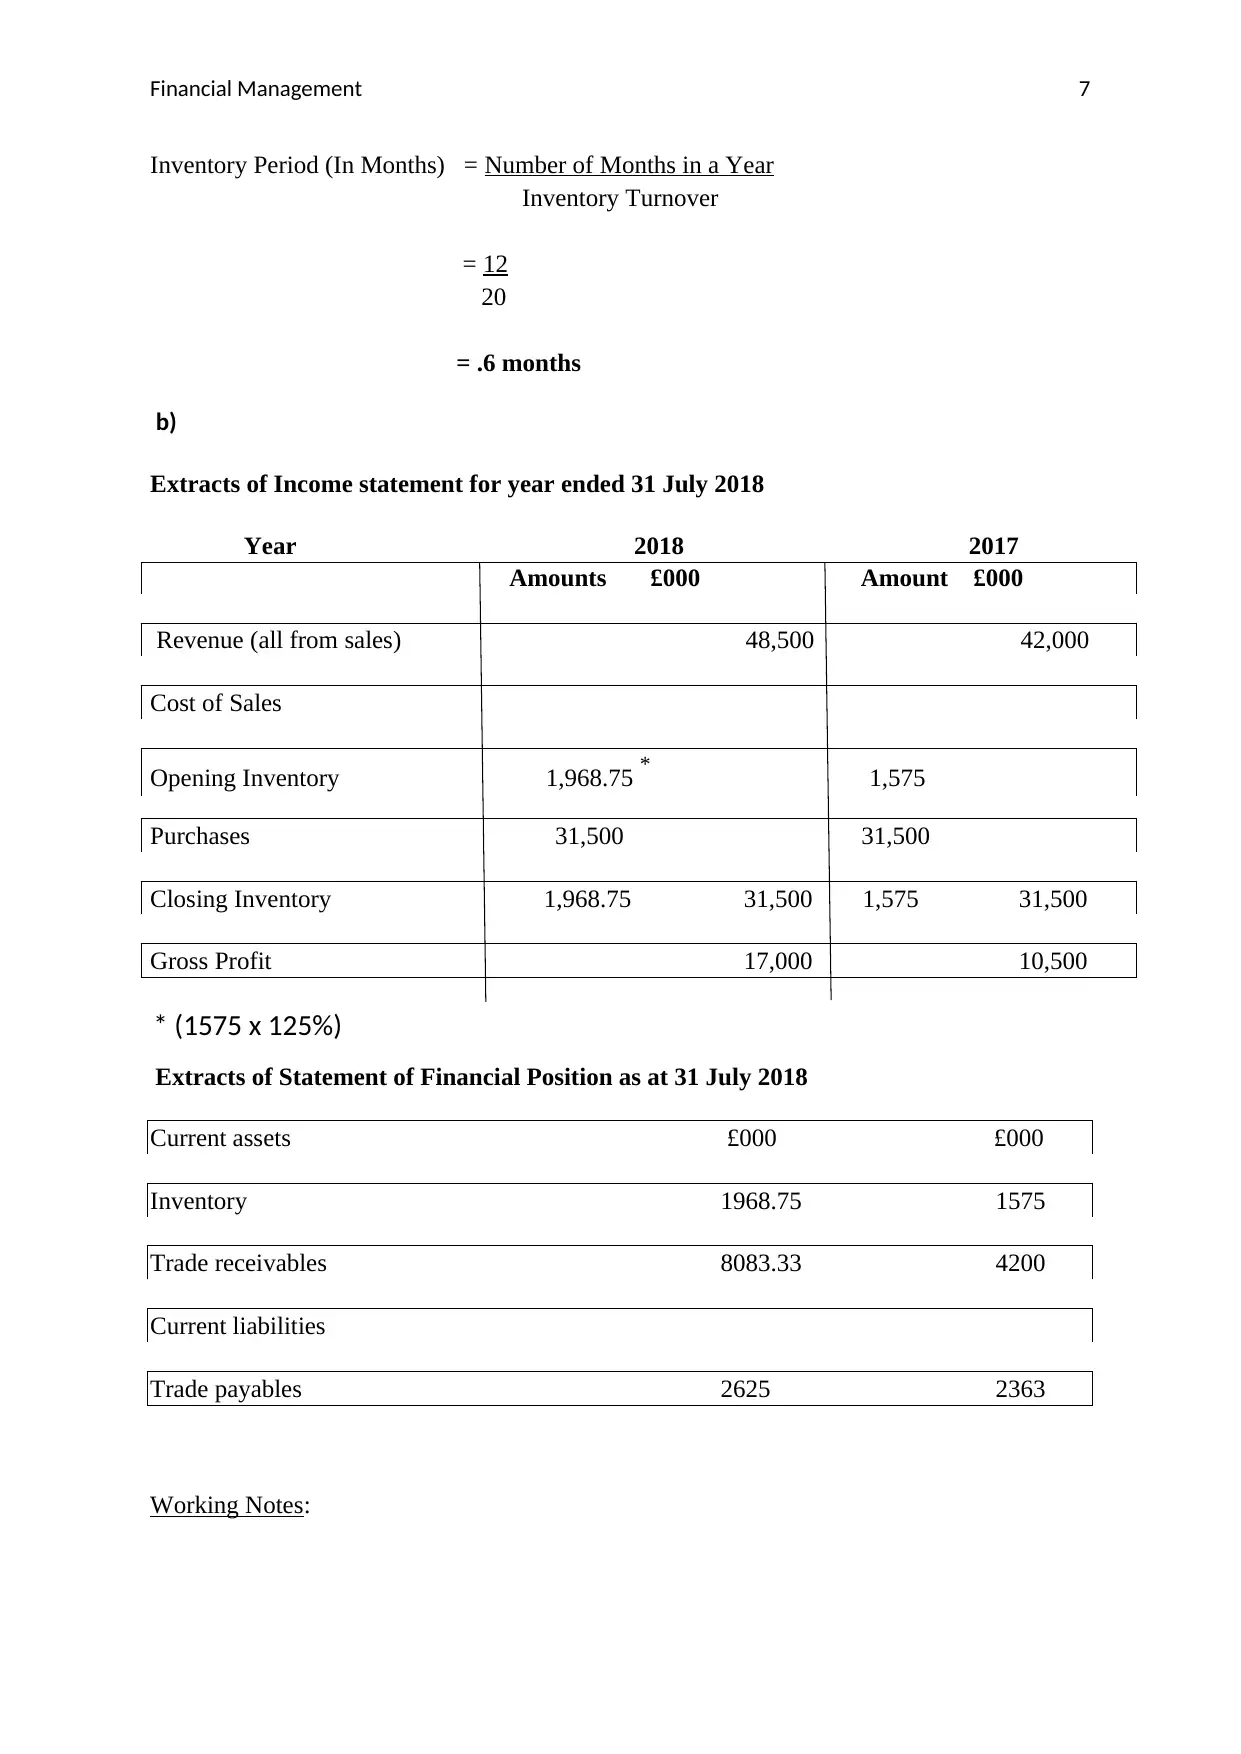
Inventory Period (In Months) = Number of Months in a Year
Inventory Turnover
= 12
20
= .6 months
b)
Extracts of Income statement for year ended 31 July 2018
Year 2018 2017
Amounts £000 Amount £000
Revenue (all from sales) 48,500 42,000
Cost of Sales
Opening Inventory 1,968.75 * 1,575
Purchases 31,500 31,500
Closing Inventory 1,968.75 31,500 1,575 31,500
Gross Profit 17,000 10,500
* (1575 x 125%)
Extracts of Statement of Financial Position as at 31 July 2018
Current assets £000 £000
Inventory 1968.75 1575
Trade receivables 8083.33 4200
Current liabilities
Trade payables 2625 2363
Working Notes:
Financial Management 8
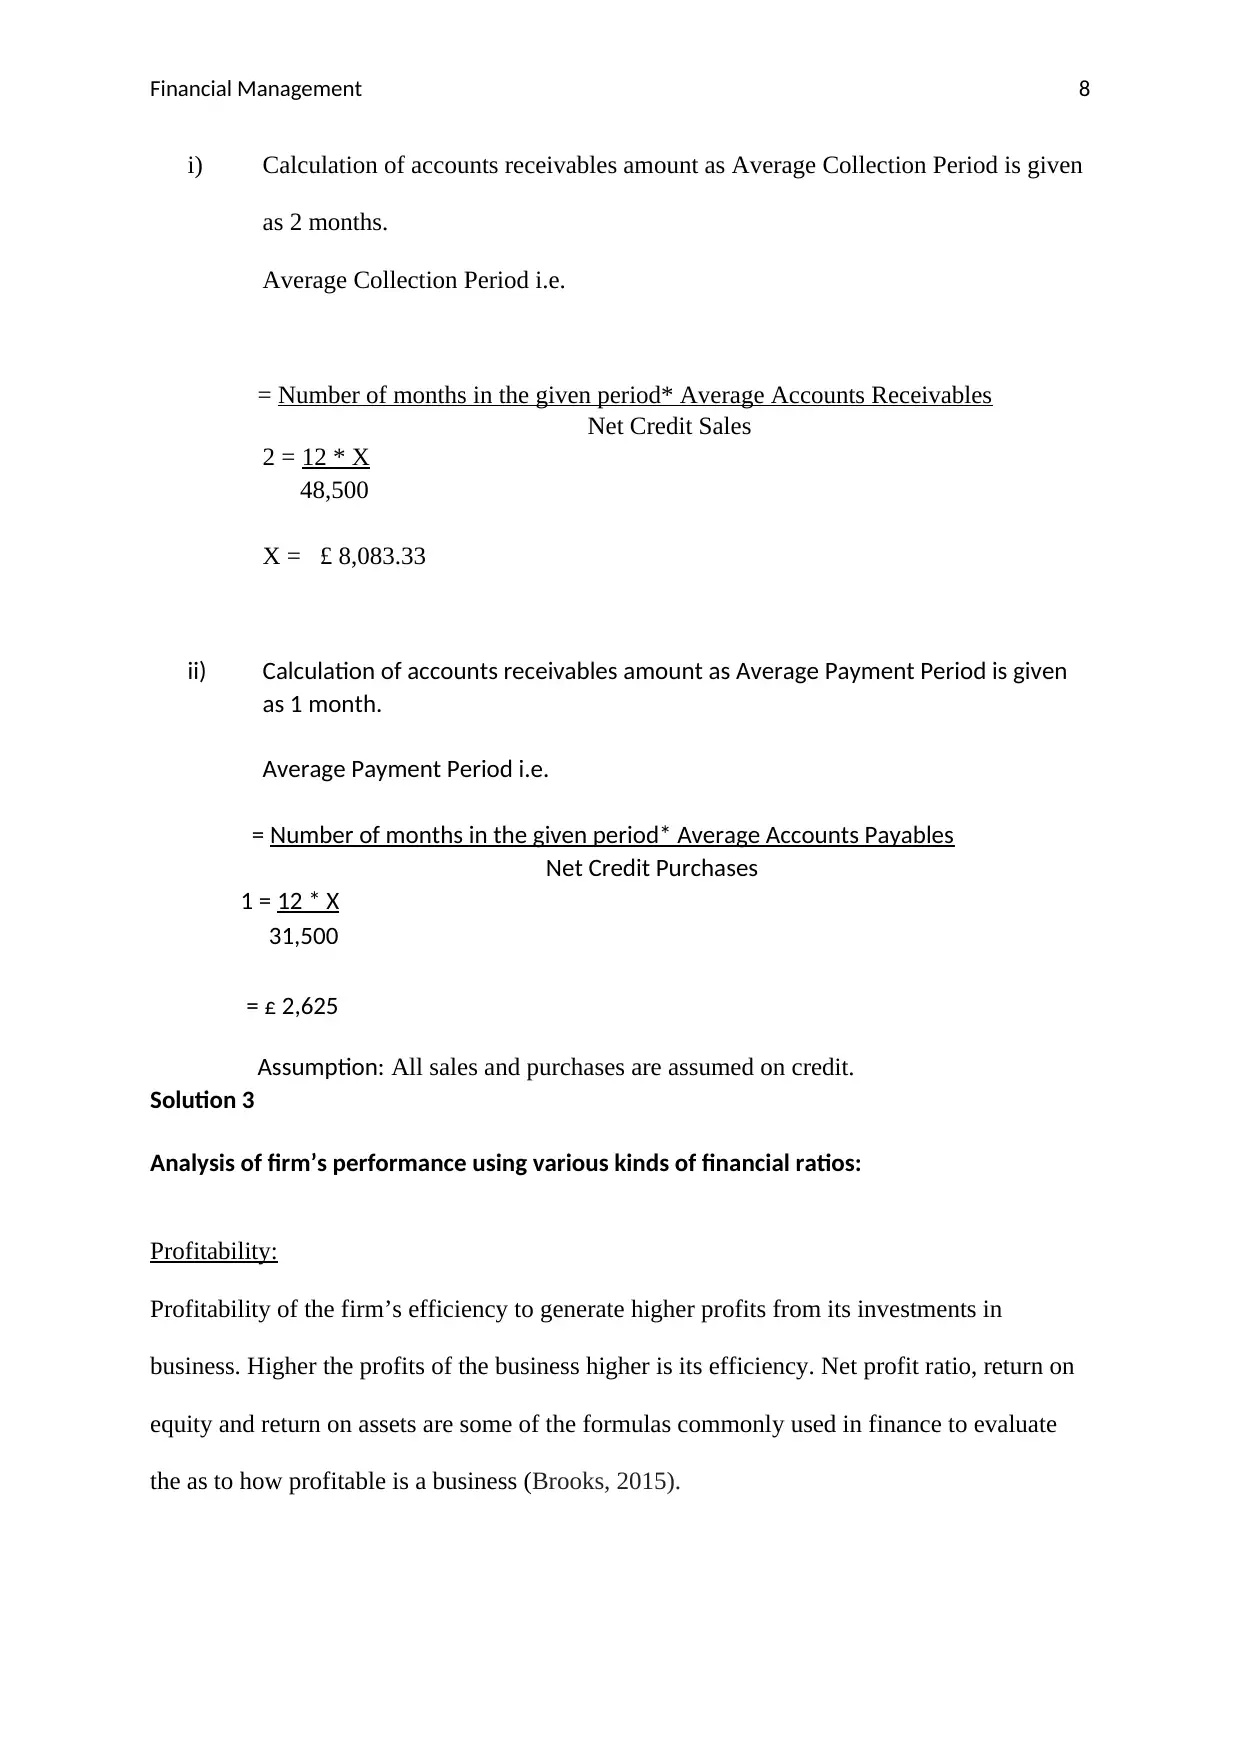
i) Calculation of accounts receivables amount as Average Collection Period is given
as 2 months.
Average Collection Period i.e.
= Number of months in the given period* Average Accounts Receivables
Net Credit Sales
2 = 12 * X
48,500
X = £ 8,083.33
ii) Calculation of accounts receivables amount as Average Payment Period is given
as 1 month.
Average Payment Period i.e.
= Number of months in the given period* Average Accounts Payables
Net Credit Purchases
1 = 12 * X
31,500
= £ 2,625
Assumption: All sales and purchases are assumed on credit.
Solution 3
Analysis of firm’s performance using various kinds of financial ratios:
Profitability:
Profitability of the firm’s efficiency to generate higher profits from its investments in
business. Higher the profits of the business higher is its efficiency. Net profit ratio, return on
equity and return on assets are some of the formulas commonly used in finance to evaluate
the as to how profitable is a business (Brooks, 2015).
⊘ This is a preview!⊘
Do you want full access?
Subscribe today to unlock all pages.
Trusted by 1+ million students worldwide
Financial Management 9
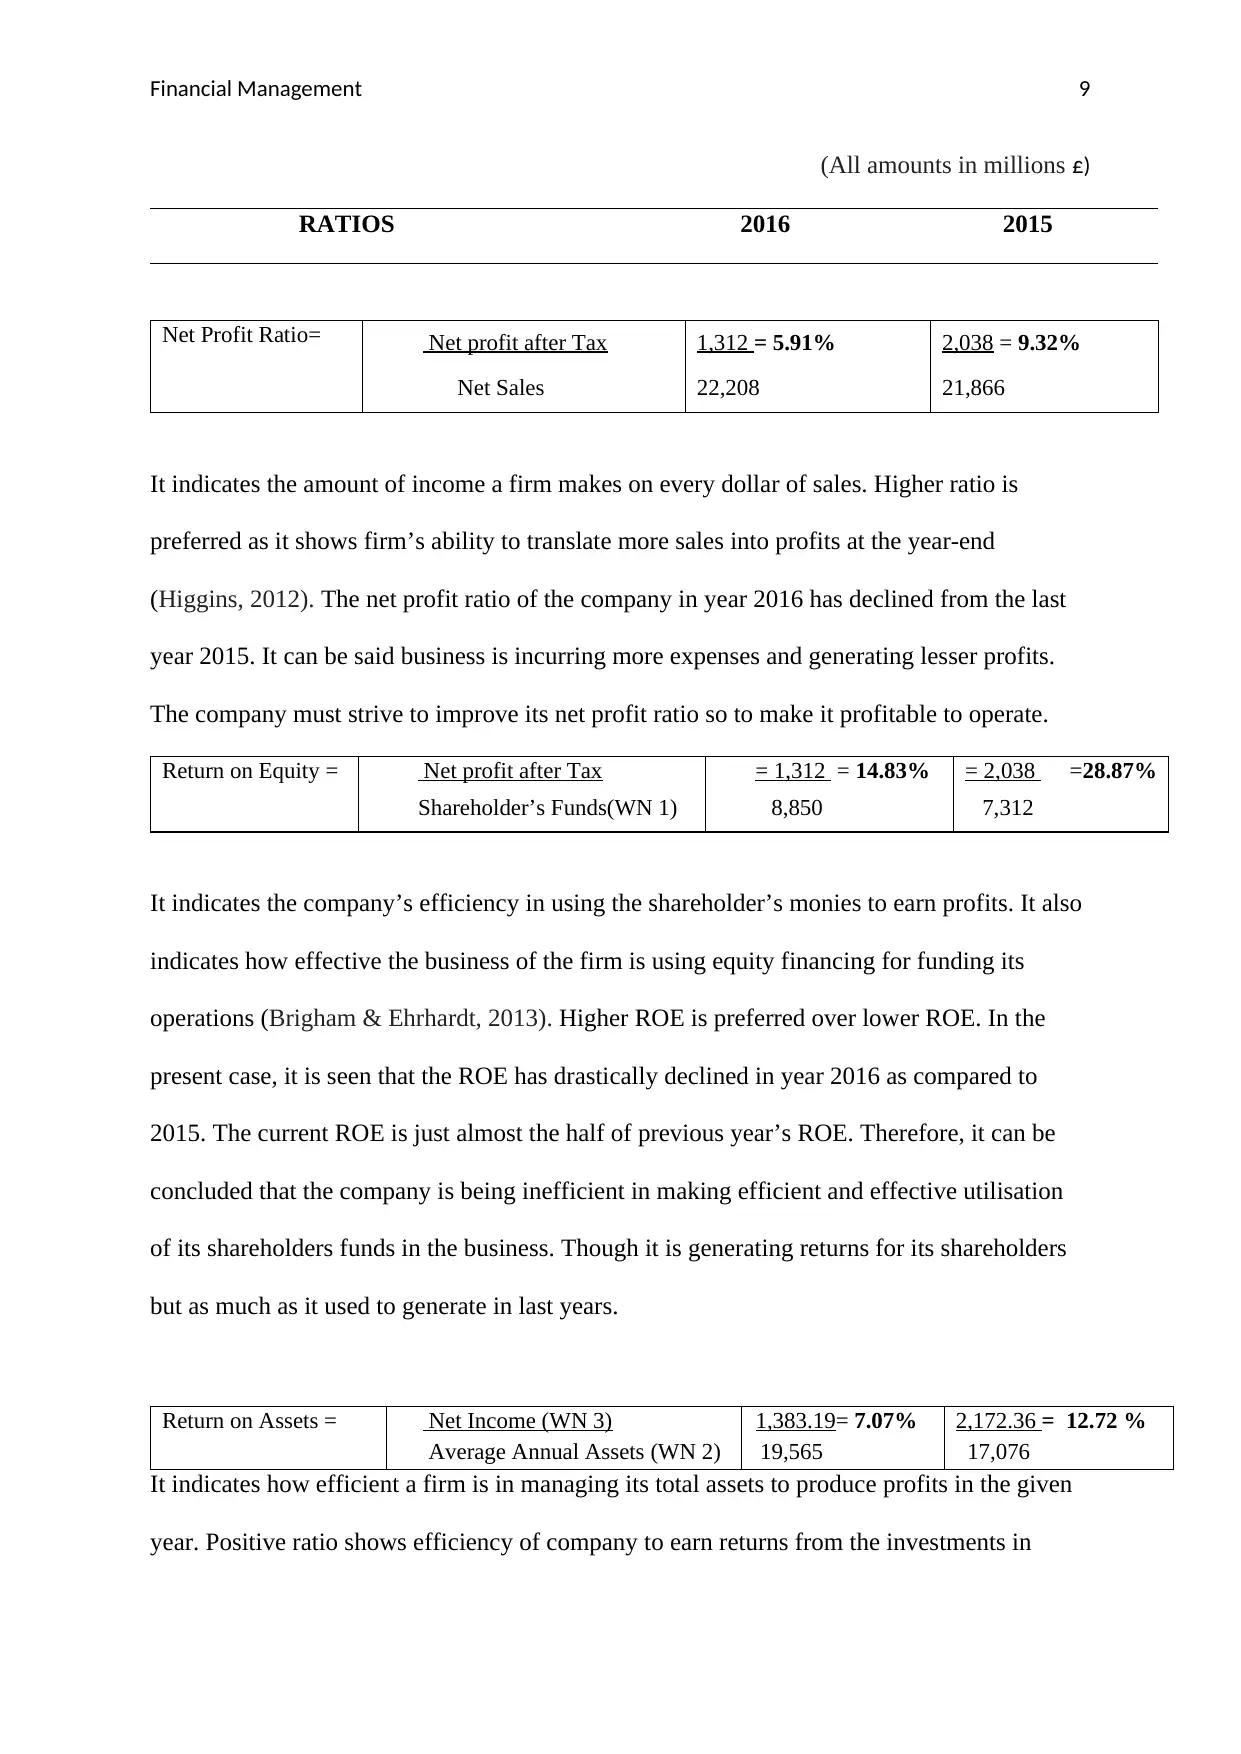
(All amounts in millions £)
RATIOS 2016 2015
Net Profit Ratio= Net profit after Tax 1,312 = 5.91% 2,038 = 9.32%
Net Sales 22,208 21,866
It indicates the amount of income a firm makes on every dollar of sales. Higher ratio is
preferred as it shows firm’s ability to translate more sales into profits at the year-end
(Higgins, 2012). The net profit ratio of the company in year 2016 has declined from the last
year 2015. It can be said business is incurring more expenses and generating lesser profits.
The company must strive to improve its net profit ratio so to make it profitable to operate.
Return on Equity = Net profit after Tax = 1,312 = 14.83% = 2,038 =28.87%
Shareholder’s Funds(WN 1) 8,850 7,312
It indicates the company’s efficiency in using the shareholder’s monies to earn profits. It also
indicates how effective the business of the firm is using equity financing for funding its
operations (Brigham & Ehrhardt, 2013). Higher ROE is preferred over lower ROE. In the
present case, it is seen that the ROE has drastically declined in year 2016 as compared to
2015. The current ROE is just almost the half of previous year’s ROE. Therefore, it can be
concluded that the company is being inefficient in making efficient and effective utilisation
of its shareholders funds in the business. Though it is generating returns for its shareholders
but as much as it used to generate in last years.
Return on Assets = Net Income (WN 3) 1,383.19= 7.07% 2,172.36 = 12.72 %
Average Annual Assets (WN 2) 19,565 17,076
It indicates how efficient a firm is in managing its total assets to produce profits in the given
year. Positive ratio shows efficiency of company to earn returns from the investments in
Paraphrase This Document
Need a fresh take? Get an instant paraphrase of this document with our AI Paraphraser
Financial Management 10
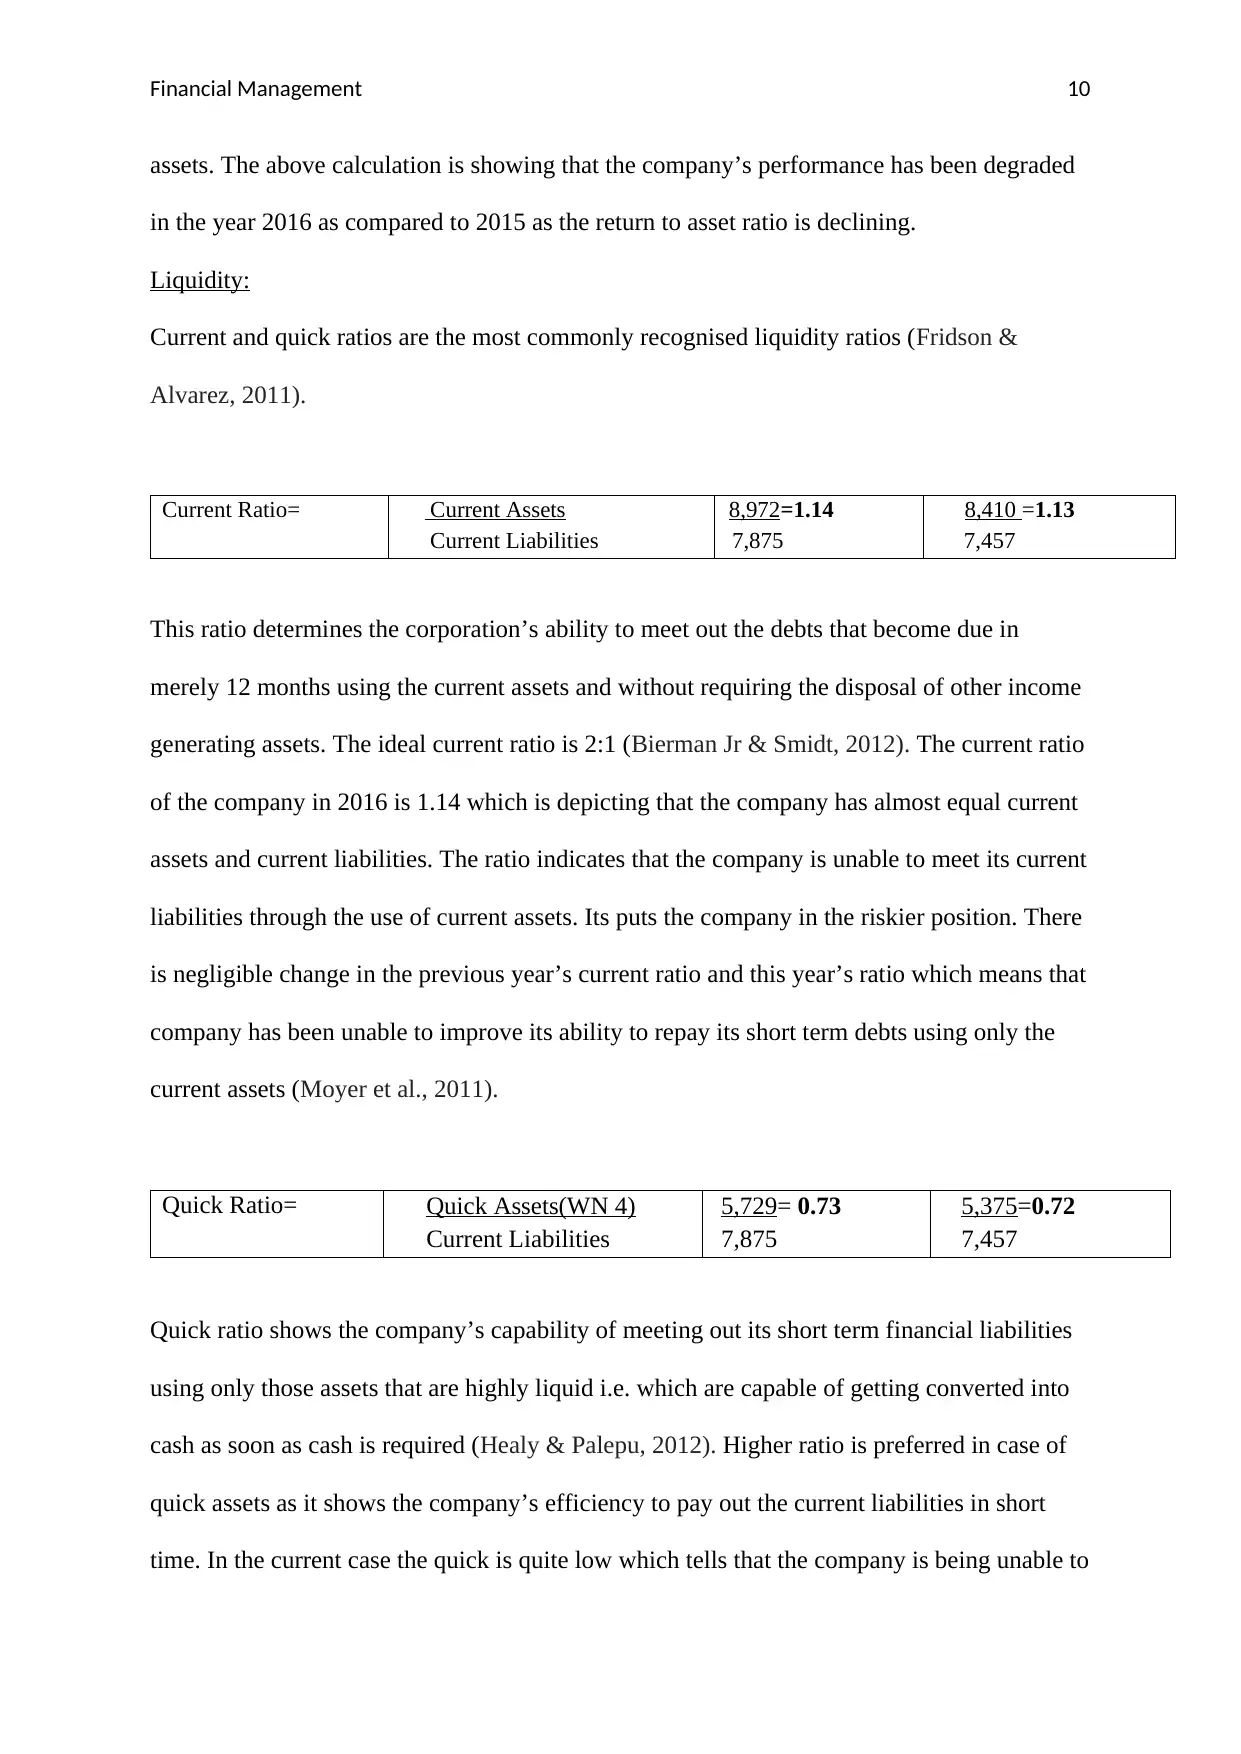
assets. The above calculation is showing that the company’s performance has been degraded
in the year 2016 as compared to 2015 as the return to asset ratio is declining.
Liquidity:
Current and quick ratios are the most commonly recognised liquidity ratios (Fridson &
Alvarez, 2011).
Current Ratio= Current Assets 8,972=1.14 8,410 =1.13
Current Liabilities 7,875 7,457
This ratio determines the corporation’s ability to meet out the debts that become due in
merely 12 months using the current assets and without requiring the disposal of other income
generating assets. The ideal current ratio is 2:1 (Bierman Jr & Smidt, 2012). The current ratio
of the company in 2016 is 1.14 which is depicting that the company has almost equal current
assets and current liabilities. The ratio indicates that the company is unable to meet its current
liabilities through the use of current assets. Its puts the company in the riskier position. There
is negligible change in the previous year’s current ratio and this year’s ratio which means that
company has been unable to improve its ability to repay its short term debts using only the
current assets (Moyer et al., 2011).
Quick Ratio= Quick Assets(WN 4) 5,729= 0.73 5,375=0.72
Current Liabilities 7,875 7,457
Quick ratio shows the company’s capability of meeting out its short term financial liabilities
using only those assets that are highly liquid i.e. which are capable of getting converted into
cash as soon as cash is required (Healy & Palepu, 2012). Higher ratio is preferred in case of
quick assets as it shows the company’s efficiency to pay out the current liabilities in short
time. In the current case the quick is quite low which tells that the company is being unable to
Financial Management 11
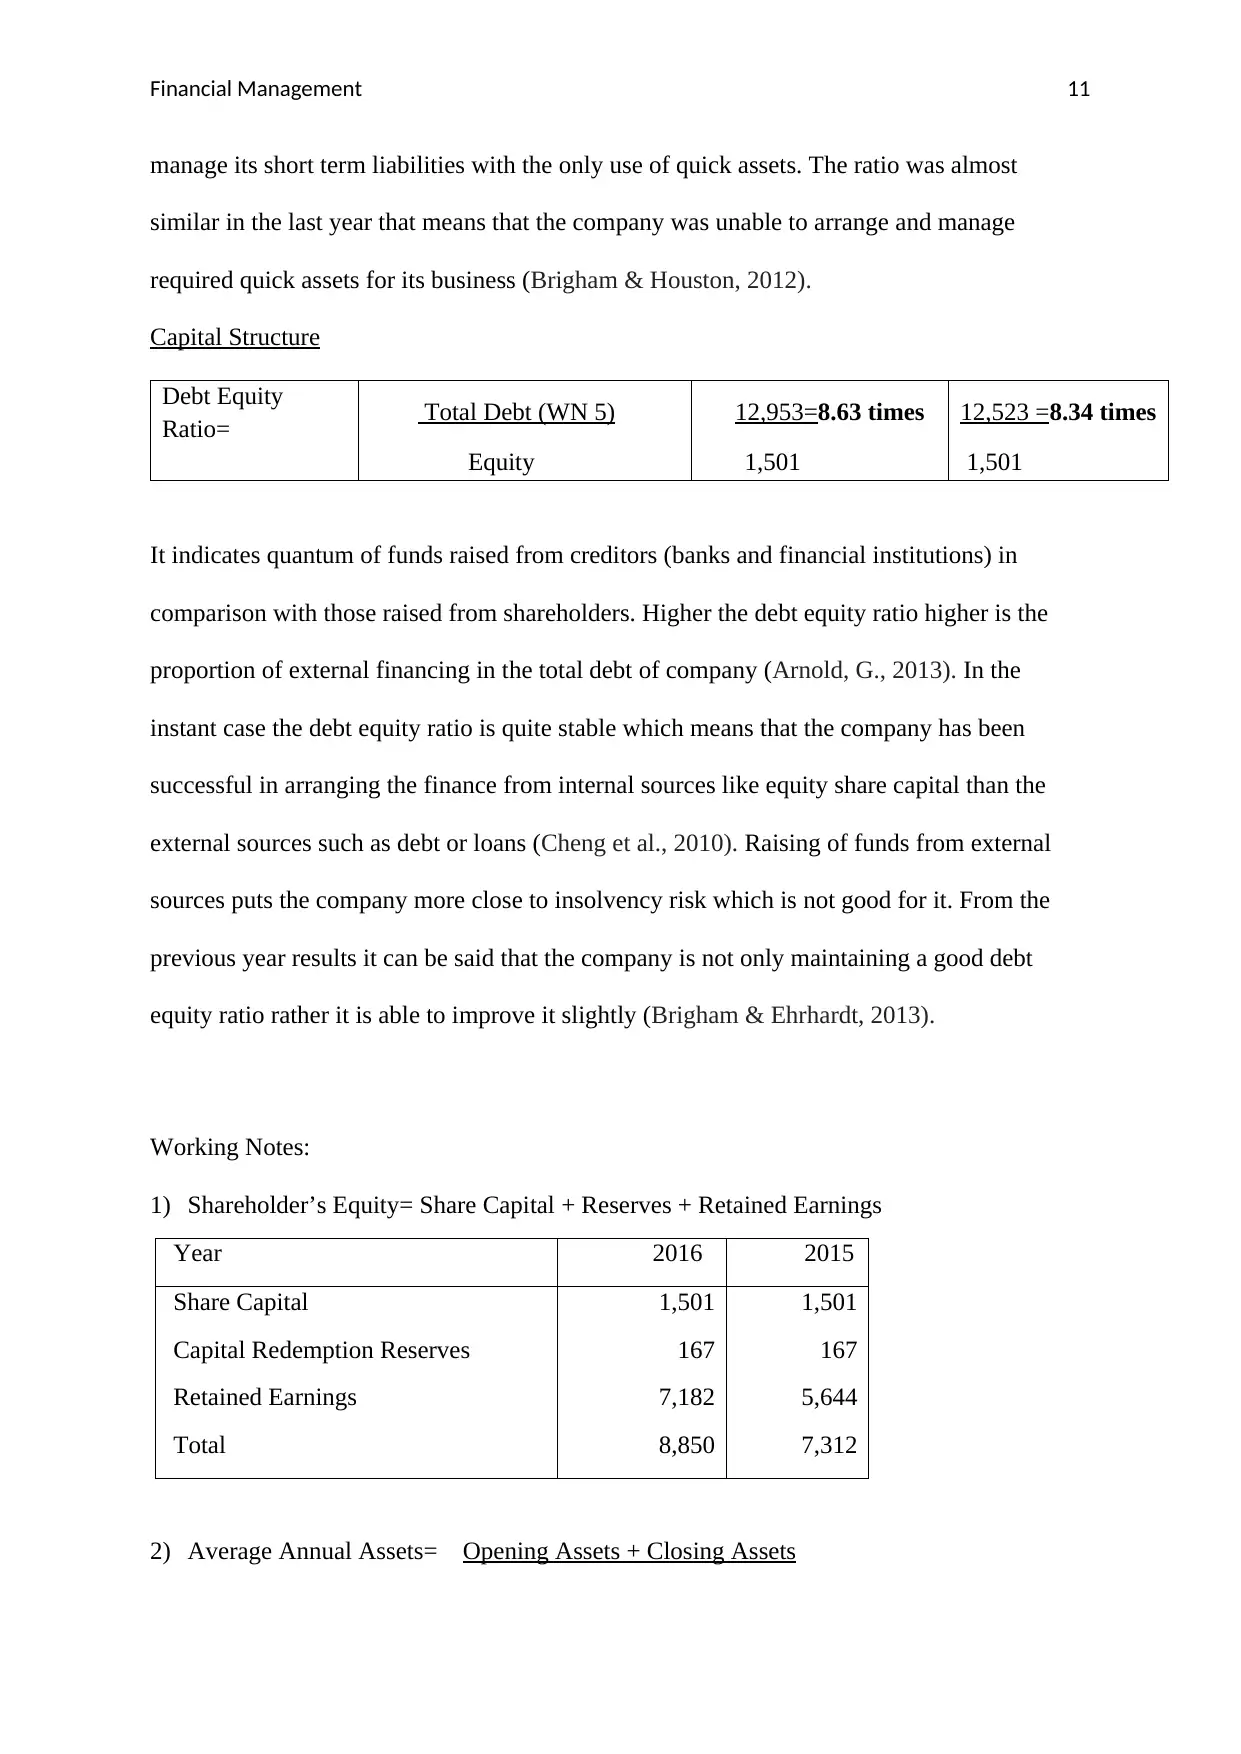
manage its short term liabilities with the only use of quick assets. The ratio was almost
similar in the last year that means that the company was unable to arrange and manage
required quick assets for its business (Brigham & Houston, 2012).
Capital Structure
Debt Equity
Ratio= Total Debt (WN 5) 12,953=8.63 times 12,523 =8.34 times
Equity 1,501 1,501
It indicates quantum of funds raised from creditors (banks and financial institutions) in
comparison with those raised from shareholders. Higher the debt equity ratio higher is the
proportion of external financing in the total debt of company (Arnold, G., 2013). In the
instant case the debt equity ratio is quite stable which means that the company has been
successful in arranging the finance from internal sources like equity share capital than the
external sources such as debt or loans (Cheng et al., 2010). Raising of funds from external
sources puts the company more close to insolvency risk which is not good for it. From the
previous year results it can be said that the company is not only maintaining a good debt
equity ratio rather it is able to improve it slightly (Brigham & Ehrhardt, 2013).
Working Notes:
1) Shareholder’s Equity= Share Capital + Reserves + Retained Earnings
Year 2016 2015
Share Capital
Capital Redemption Reserves
Retained Earnings
Total
1,501
167
7,182
8,850
1,501
167
5,644
7,312
2) Average Annual Assets= Opening Assets + Closing Assets
⊘ This is a preview!⊘
Do you want full access?
Subscribe today to unlock all pages.
Trusted by 1+ million students worldwide
1 out of 20
Related Documents


Your All-in-One AI-Powered Toolkit for Academic Success.
+13062052269
info@desklib.com
Available 24*7 on WhatsApp / Email
![[object Object]](/_next/static/media/star-bottom.7253800d.svg)
Unlock your academic potential
Copyright © 2020–2026 A2Z Services. All Rights Reserved. Developed and managed by ZUCOL.