Financial Decision Making Assignment - Part 3, Investment Analysis
VerifiedAdded on 2022/08/23
|8
|1140
|11
Homework Assignment
AI Summary
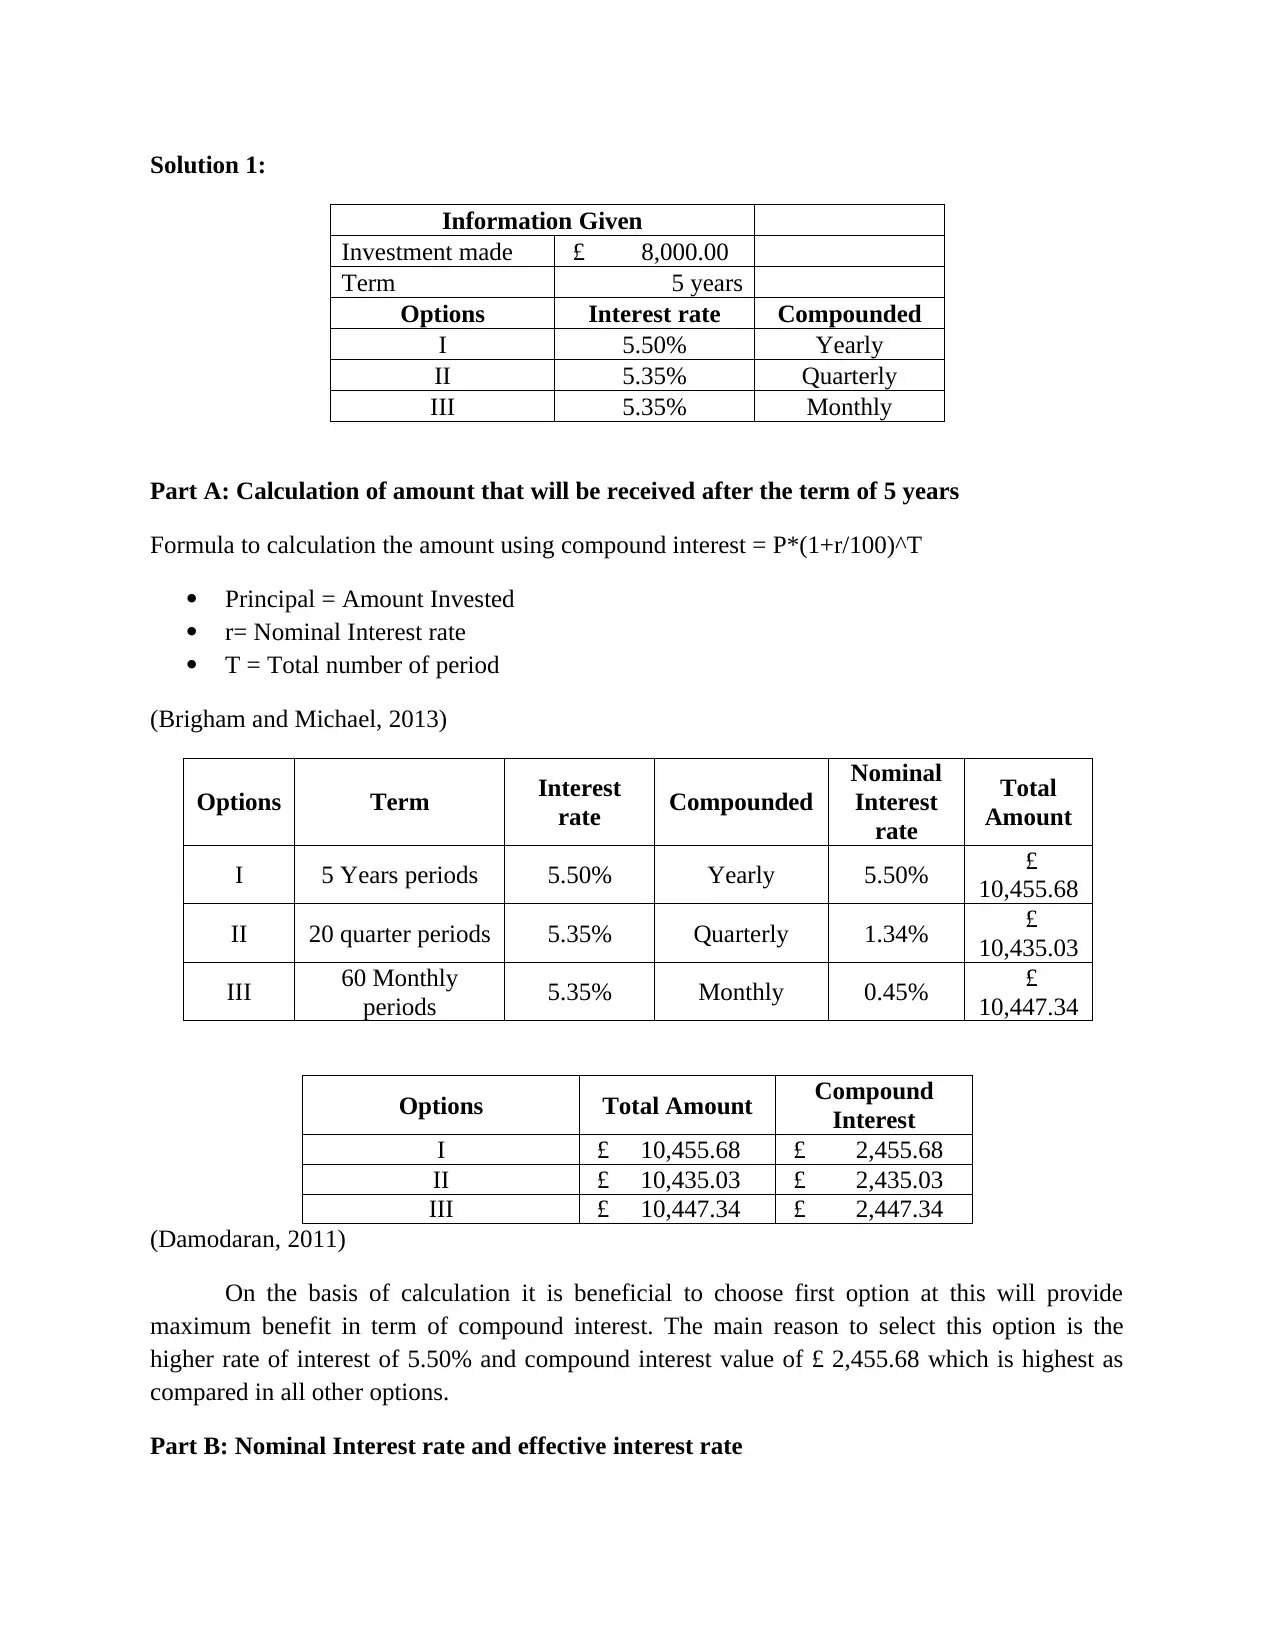
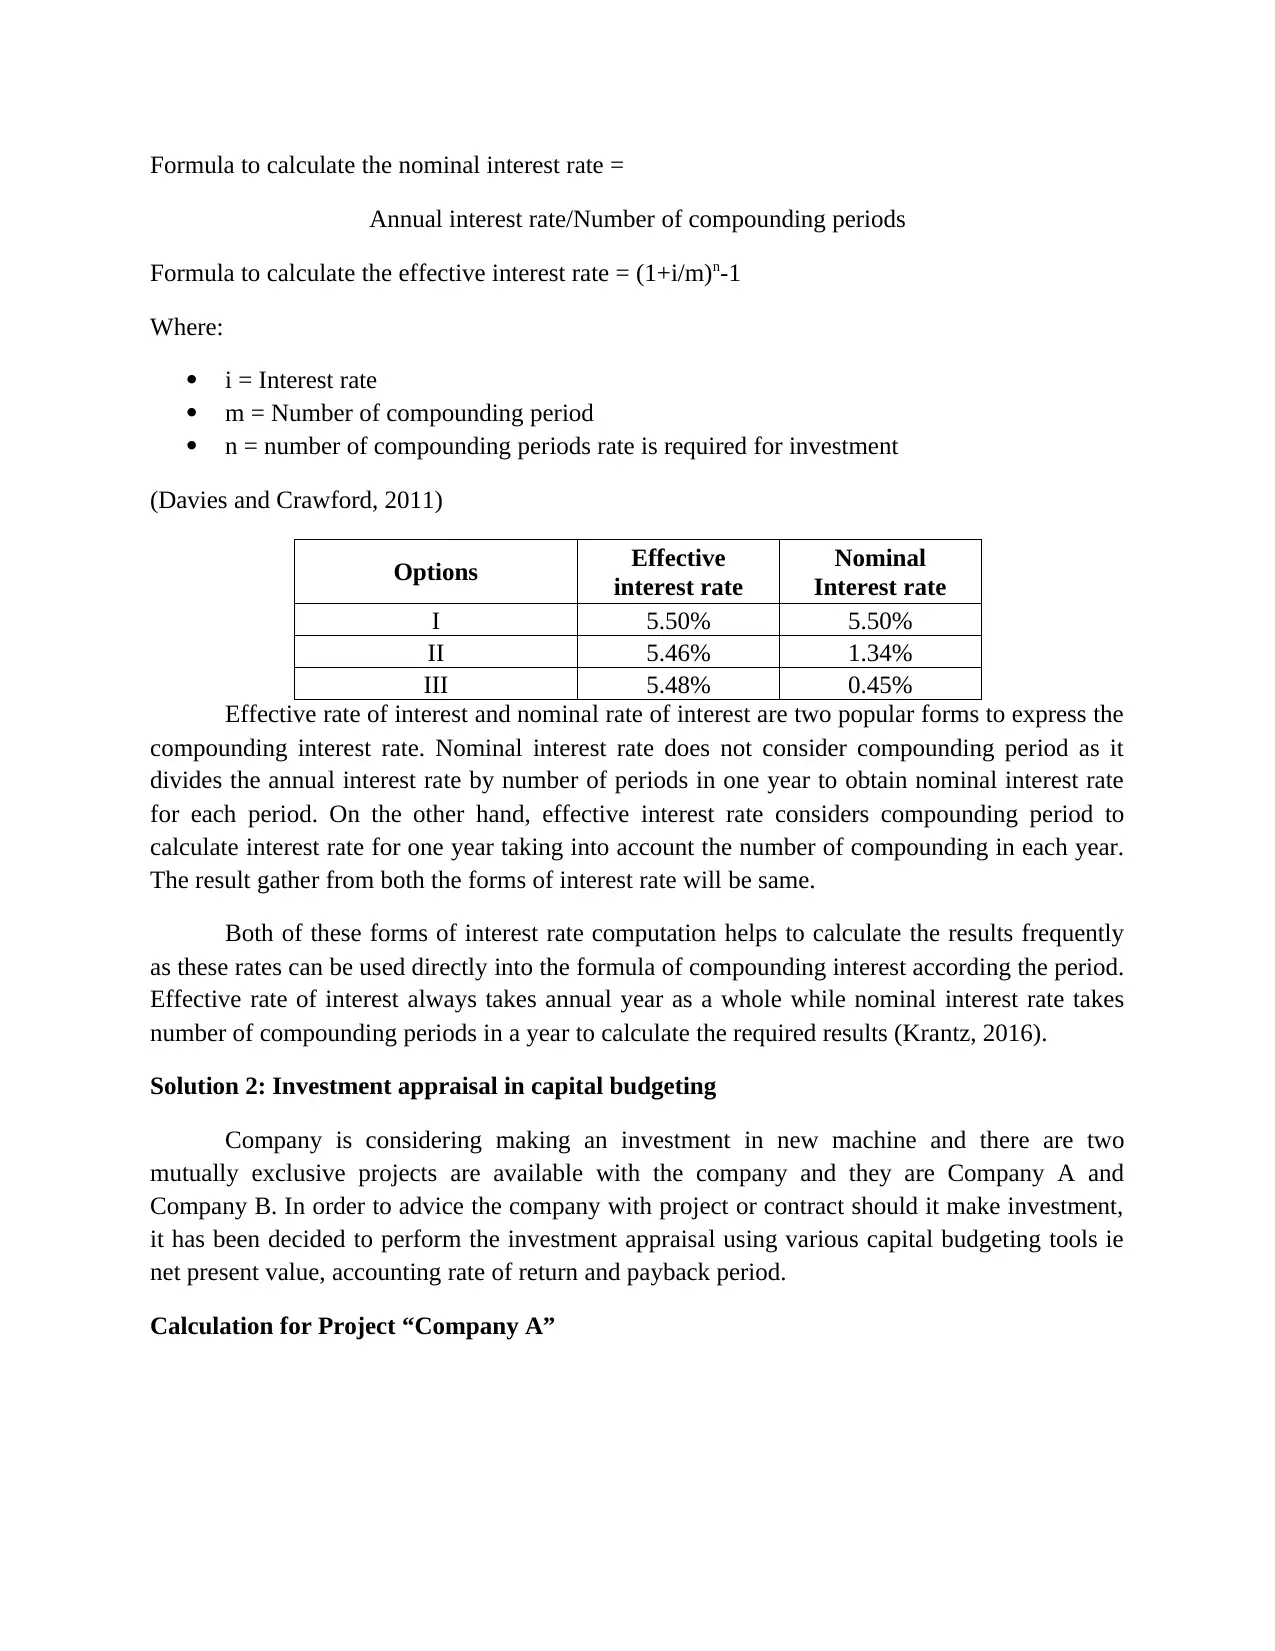
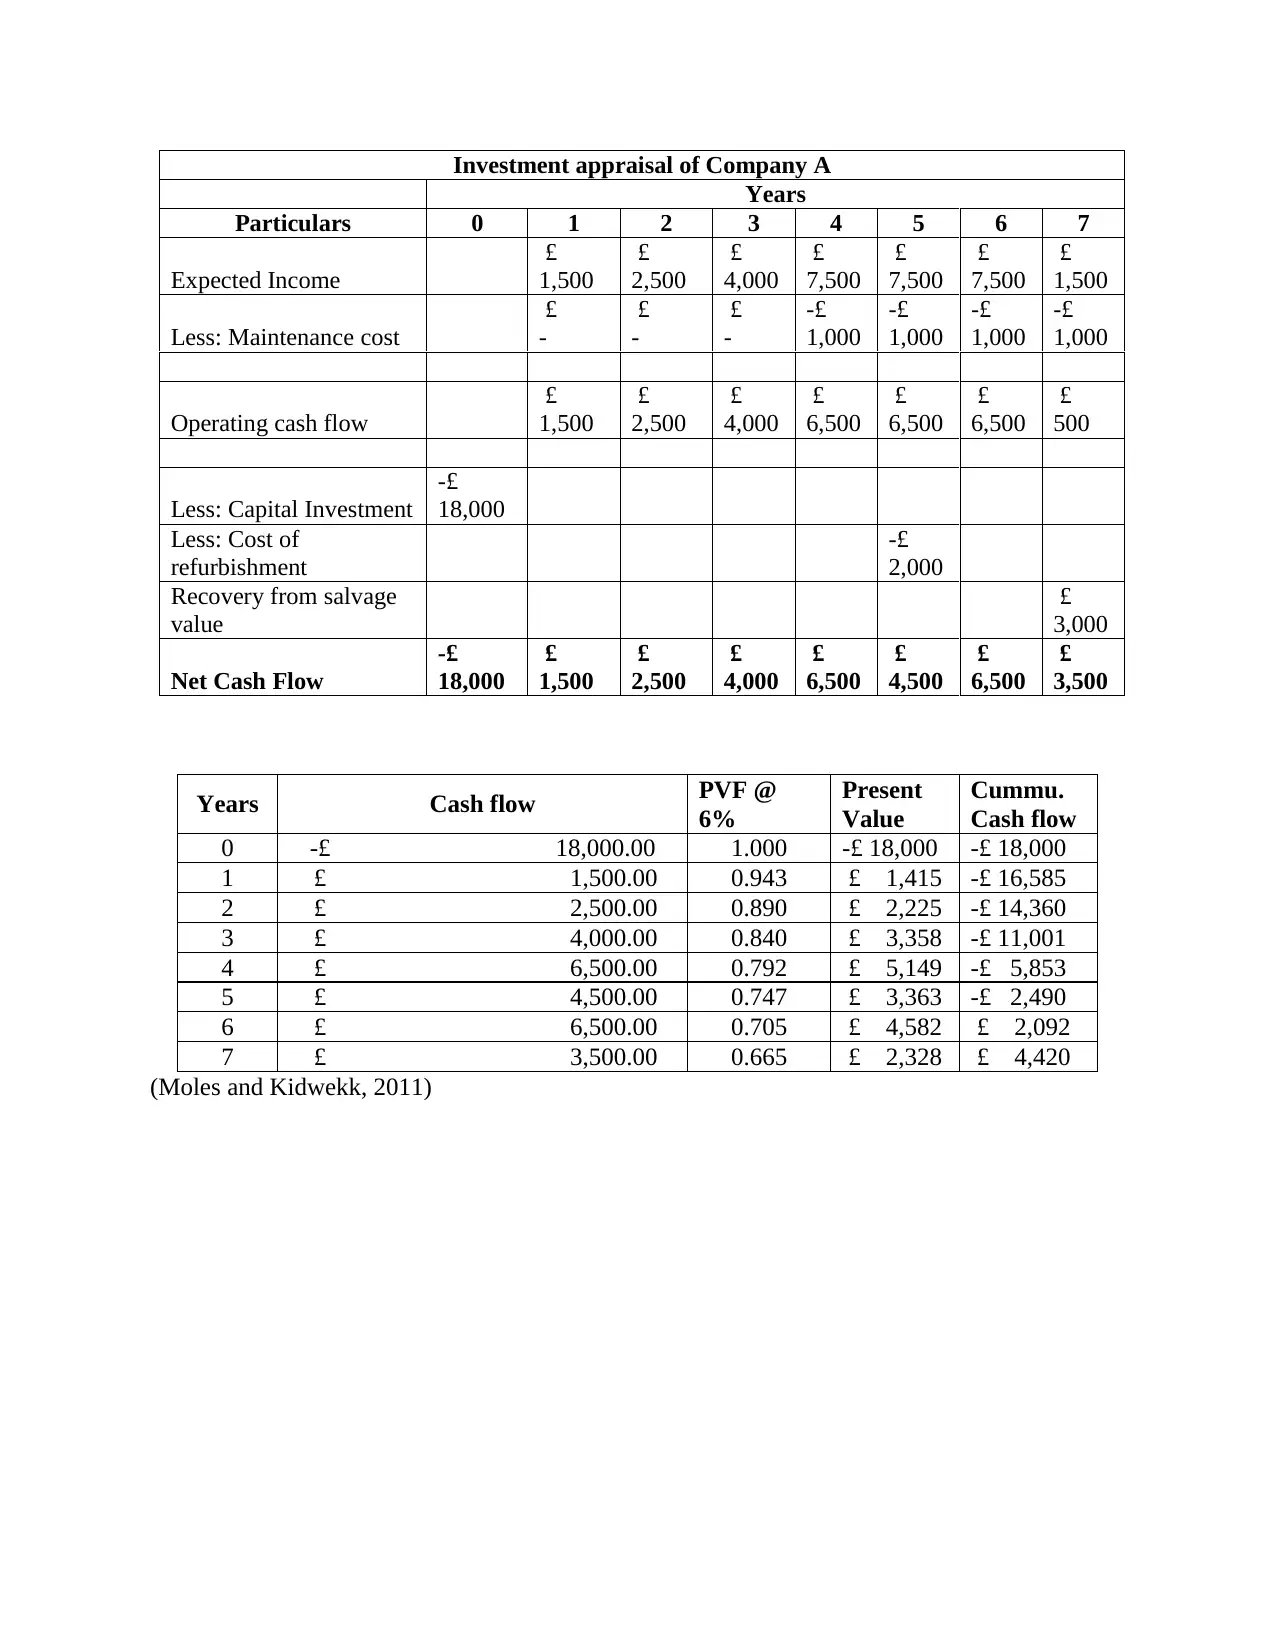
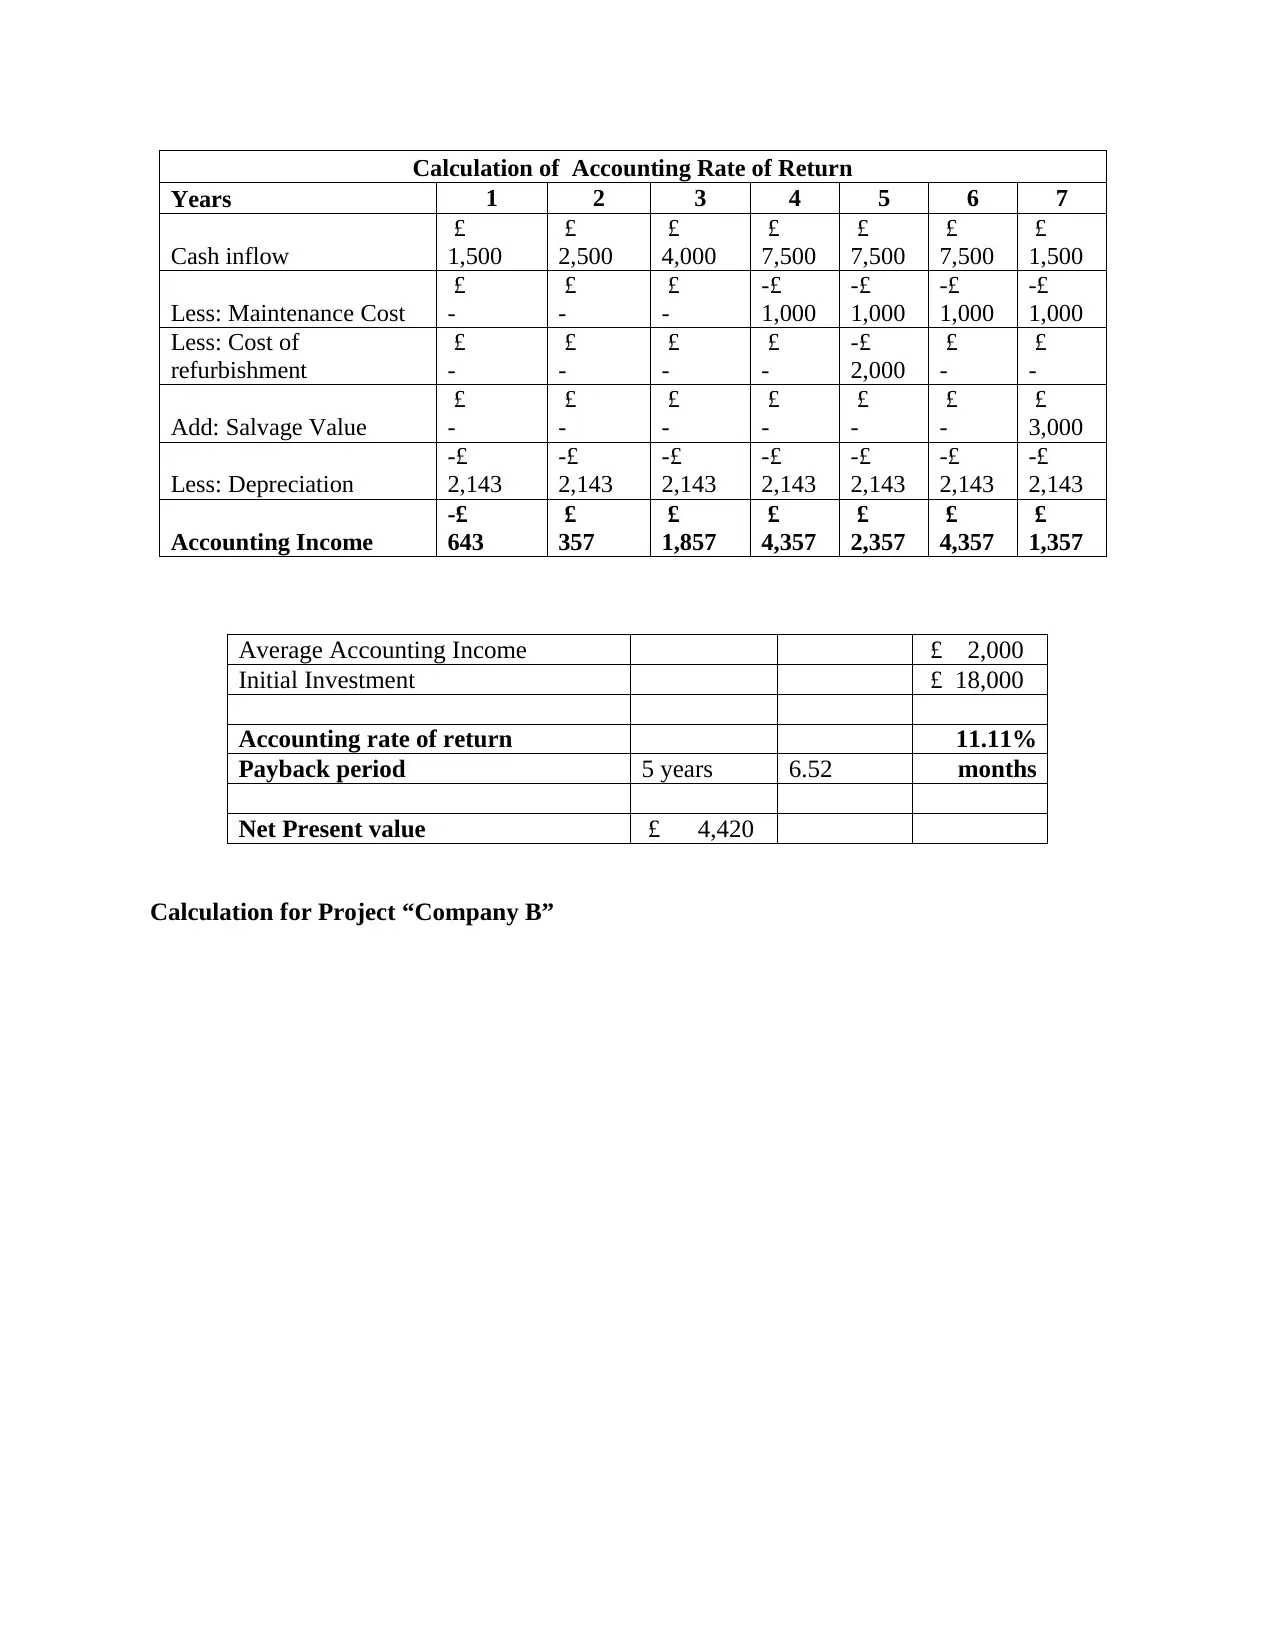
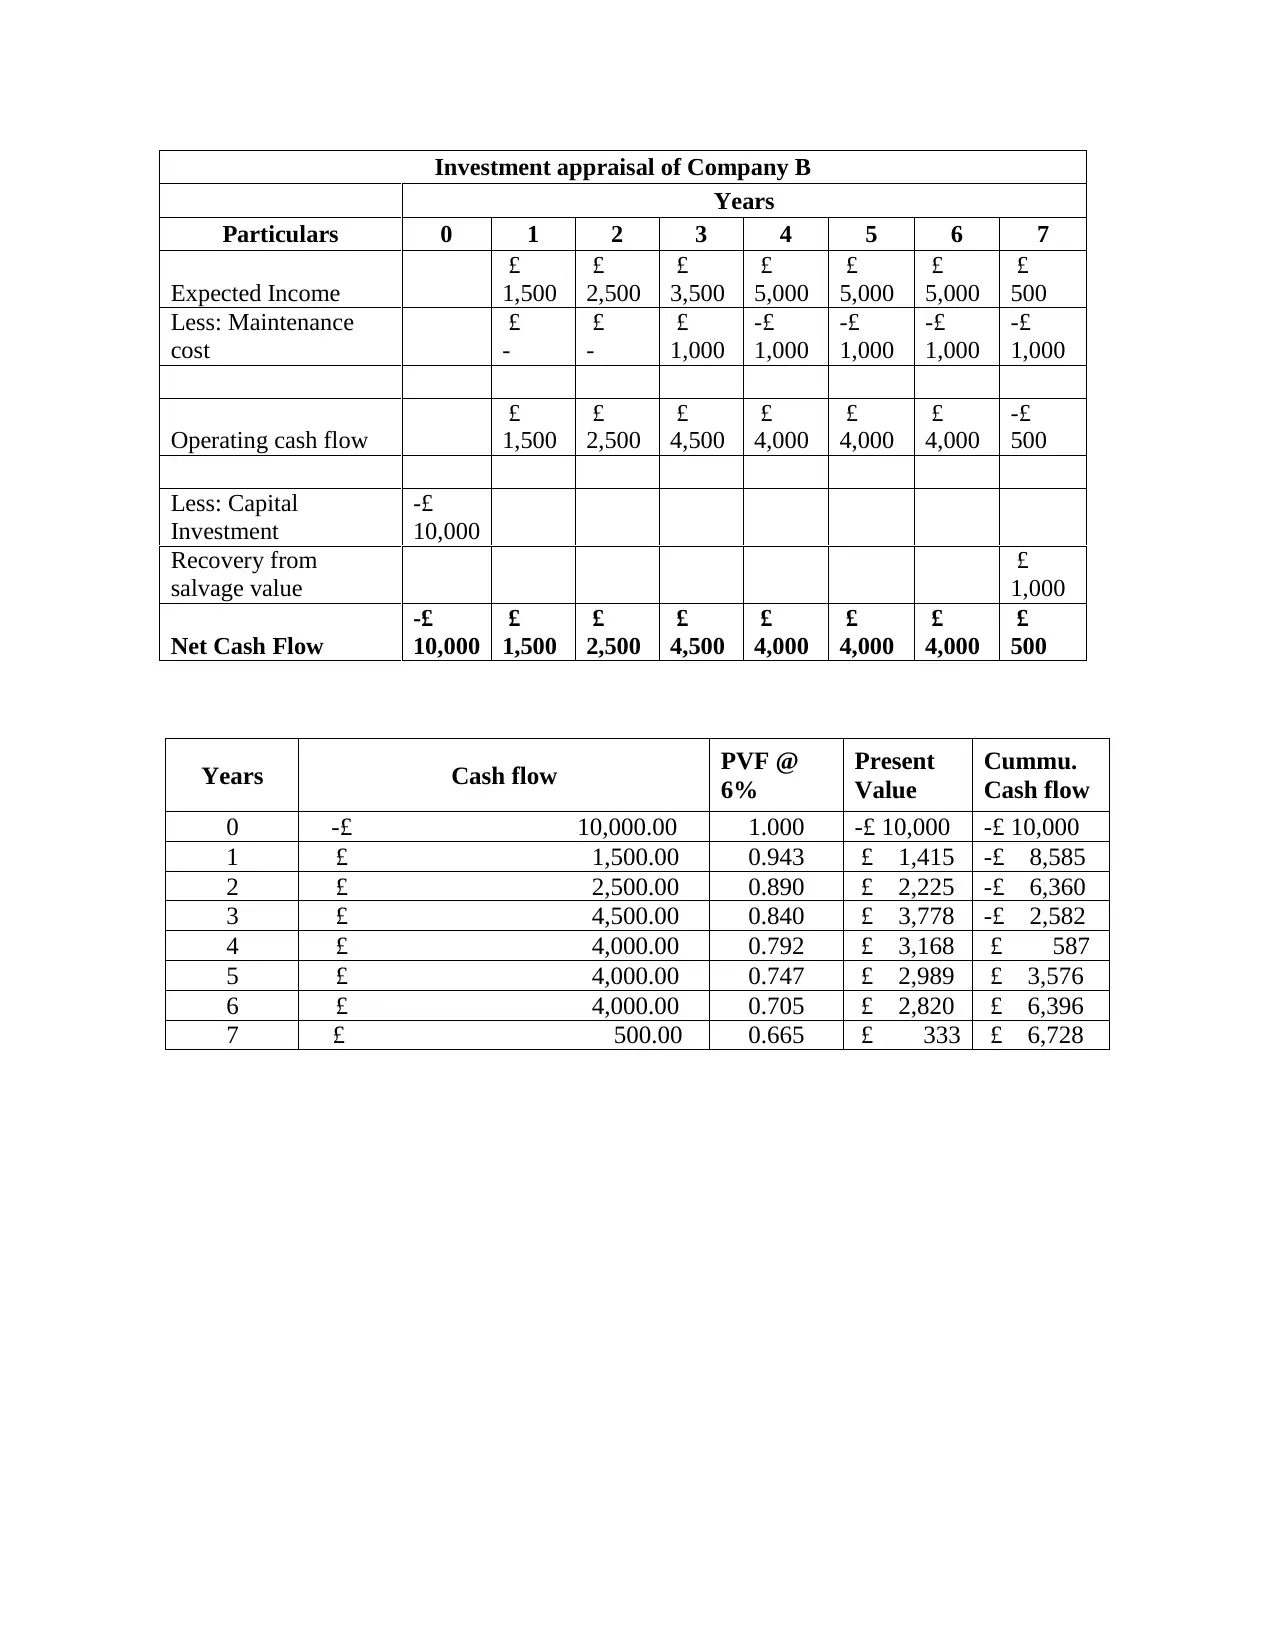
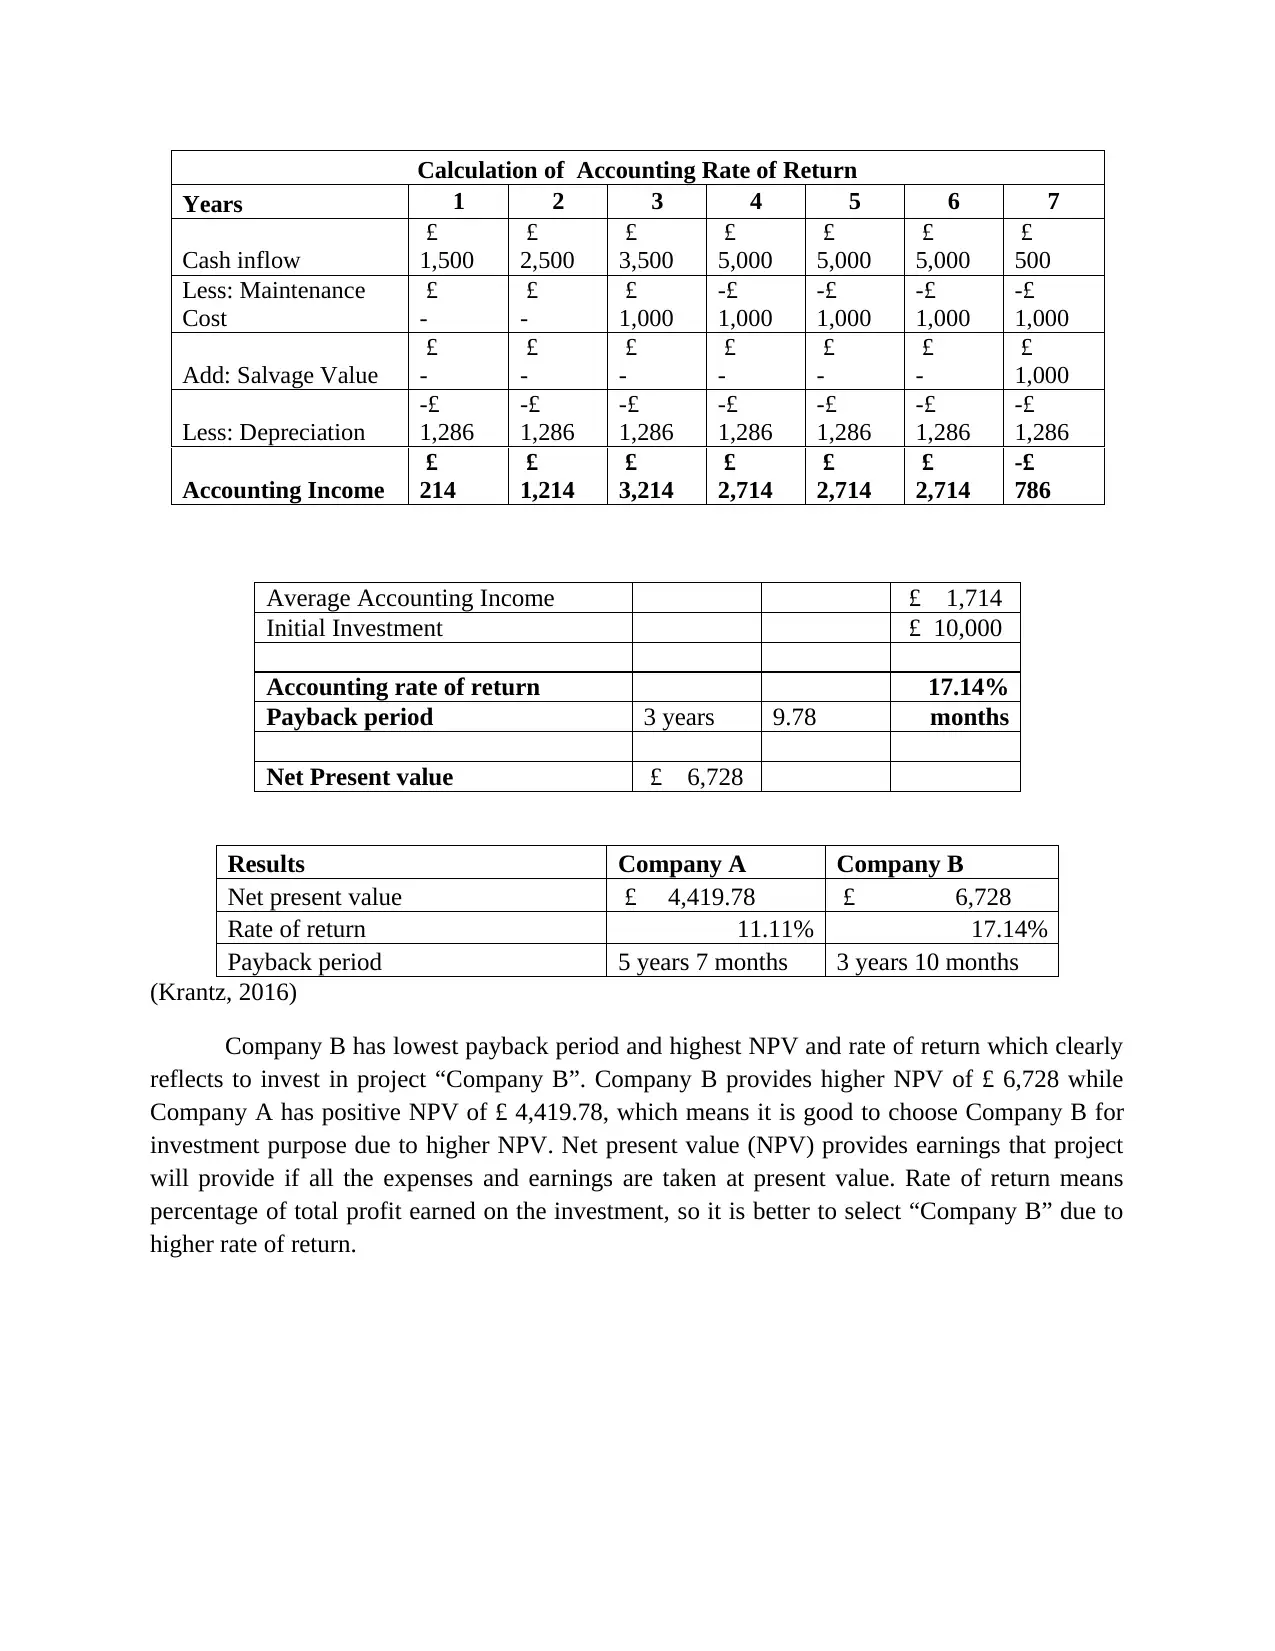
This assignment presents a comprehensive analysis of financial decision-making, focusing on investment appraisal and capital budgeting. The solution begins by evaluating three investment options, calculating the future value of an £8,000 investment over five years with varying compound interest rates (yearly, quarterly, and monthly) to determine the most beneficial option. The second part delves into capital budgeting, comparing two mutually exclusive projects (Company A and Company B) using net present value (NPV), accounting rate of return, and payback period to recommend the optimal investment. The analysis includes detailed calculations for each project, demonstrating how these financial tools guide investment choices. Finally, the assignment concludes with a recommendation, supporting the selection of Project B, and discusses scenarios that could alter this recommendation, such as changes in initial investment, payback period, or rate of return.

Solution 1:
Information Given
Investment made £ 8,000.00
Term 5 years
Options Interest rate Compounded
I 5.50% Yearly
II 5.35% Quarterly
III 5.35% Monthly
Part A: Calculation of amount that will be received after the term of 5 years
Formula to calculation the amount using compound interest = P*(1+r/100)^T
Principal = Amount Invested
r= Nominal Interest rate
T = Total number of period
(Brigham and Michael, 2013)
Options Term Interest
rate Compounded
Nominal
Interest
rate
Total
Amount
I 5 Years periods 5.50% Yearly 5.50% £
10,455.68
II 20 quarter periods 5.35% Quarterly 1.34% £
10,435.03
III 60 Monthly
periods 5.35% Monthly 0.45% £
10,447.34
Options Total Amount Compound
Interest
I £ 10,455.68 £ 2,455.68
II £ 10,435.03 £ 2,435.03
III £ 10,447.34 £ 2,447.34
(Damodaran, 2011)
On the basis of calculation it is beneficial to choose first option at this will provide
maximum benefit in term of compound interest. The main reason to select this option is the
higher rate of interest of 5.50% and compound interest value of £ 2,455.68 which is highest as
compared in all other options.
Part B: Nominal Interest rate and effective interest rate
Paraphrase This Document
Need a fresh take? Get an instant paraphrase of this document with our AI Paraphraser

Formula to calculate the nominal interest rate =
Annual interest rate/Number of compounding periods
Formula to calculate the effective interest rate = (1+i/m)n-1
Where:
i = Interest rate
m = Number of compounding period
n = number of compounding periods rate is required for investment
(Davies and Crawford, 2011)
Options Effective
interest rate
Nominal
Interest rate
I 5.50% 5.50%
II 5.46% 1.34%
III 5.48% 0.45%
Effective rate of interest and nominal rate of interest are two popular forms to express the
compounding interest rate. Nominal interest rate does not consider compounding period as it
divides the annual interest rate by number of periods in one year to obtain nominal interest rate
for each period. On the other hand, effective interest rate considers compounding period to
calculate interest rate for one year taking into account the number of compounding in each year.
The result gather from both the forms of interest rate will be same.
Both of these forms of interest rate computation helps to calculate the results frequently
as these rates can be used directly into the formula of compounding interest according the period.
Effective rate of interest always takes annual year as a whole while nominal interest rate takes
number of compounding periods in a year to calculate the required results (Krantz, 2016).
Solution 2: Investment appraisal in capital budgeting
Company is considering making an investment in new machine and there are two
mutually exclusive projects are available with the company and they are Company A and
Company B. In order to advice the company with project or contract should it make investment,
it has been decided to perform the investment appraisal using various capital budgeting tools ie
net present value, accounting rate of return and payback period.
Calculation for Project “Company A”

Investment appraisal of Company A
Years
Particulars 0 1 2 3 4 5 6 7
Expected Income
£
1,500
£
2,500
£
4,000
£
7,500
£
7,500
£
7,500
£
1,500
Less: Maintenance cost
£
-
£
-
£
-
-£
1,000
-£
1,000
-£
1,000
-£
1,000
Operating cash flow
£
1,500
£
2,500
£
4,000
£
6,500
£
6,500
£
6,500
£
500
Less: Capital Investment
-£
18,000
Less: Cost of
refurbishment
-£
2,000
Recovery from salvage
value
£
3,000
Net Cash Flow
-£
18,000
£
1,500
£
2,500
£
4,000
£
6,500
£
4,500
£
6,500
£
3,500
Years Cash flow PVF @
6%
Present
Value
Cummu.
Cash flow
0 -£ 18,000.00 1.000 -£ 18,000 -£ 18,000
1 £ 1,500.00 0.943 £ 1,415 -£ 16,585
2 £ 2,500.00 0.890 £ 2,225 -£ 14,360
3 £ 4,000.00 0.840 £ 3,358 -£ 11,001
4 £ 6,500.00 0.792 £ 5,149 -£ 5,853
5 £ 4,500.00 0.747 £ 3,363 -£ 2,490
6 £ 6,500.00 0.705 £ 4,582 £ 2,092
7 £ 3,500.00 0.665 £ 2,328 £ 4,420
(Moles and Kidwekk, 2011)
⊘ This is a preview!⊘
Do you want full access?
Subscribe today to unlock all pages.

Trusted by 1+ million students worldwide

Calculation of Accounting Rate of Return
Years 1 2 3 4 5 6 7
Cash inflow
£
1,500
£
2,500
£
4,000
£
7,500
£
7,500
£
7,500
£
1,500
Less: Maintenance Cost
£
-
£
-
£
-
-£
1,000
-£
1,000
-£
1,000
-£
1,000
Less: Cost of
refurbishment
£
-
£
-
£
-
£
-
-£
2,000
£
-
£
-
Add: Salvage Value
£
-
£
-
£
-
£
-
£
-
£
-
£
3,000
Less: Depreciation
-£
2,143
-£
2,143
-£
2,143
-£
2,143
-£
2,143
-£
2,143
-£
2,143
Accounting Income
-£
643
£
357
£
1,857
£
4,357
£
2,357
£
4,357
£
1,357
Average Accounting Income £ 2,000
Initial Investment £ 18,000
Accounting rate of return 11.11%
Payback period 5 years 6.52 months
Net Present value £ 4,420
Calculation for Project “Company B”
Paraphrase This Document
Need a fresh take? Get an instant paraphrase of this document with our AI Paraphraser

Investment appraisal of Company B
Years
Particulars 0 1 2 3 4 5 6 7
Expected Income
£
1,500
£
2,500
£
3,500
£
5,000
£
5,000
£
5,000
£
500
Less: Maintenance
cost
£
-
£
-
£
1,000
-£
1,000
-£
1,000
-£
1,000
-£
1,000
Operating cash flow
£
1,500
£
2,500
£
4,500
£
4,000
£
4,000
£
4,000
-£
500
Less: Capital
Investment
-£
10,000
Recovery from
salvage value
£
1,000
Net Cash Flow
-£
10,000
£
1,500
£
2,500
£
4,500
£
4,000
£
4,000
£
4,000
£
500
Years Cash flow PVF @
6%
Present
Value
Cummu.
Cash flow
0 -£ 10,000.00 1.000 -£ 10,000 -£ 10,000
1 £ 1,500.00 0.943 £ 1,415 -£ 8,585
2 £ 2,500.00 0.890 £ 2,225 -£ 6,360
3 £ 4,500.00 0.840 £ 3,778 -£ 2,582
4 £ 4,000.00 0.792 £ 3,168 £ 587
5 £ 4,000.00 0.747 £ 2,989 £ 3,576
6 £ 4,000.00 0.705 £ 2,820 £ 6,396
7 £ 500.00 0.665 £ 333 £ 6,728

Calculation of Accounting Rate of Return
Years 1 2 3 4 5 6 7
Cash inflow
£
1,500
£
2,500
£
3,500
£
5,000
£
5,000
£
5,000
£
500
Less: Maintenance
Cost
£
-
£
-
£
1,000
-£
1,000
-£
1,000
-£
1,000
-£
1,000
Add: Salvage Value
£
-
£
-
£
-
£
-
£
-
£
-
£
1,000
Less: Depreciation
-£
1,286
-£
1,286
-£
1,286
-£
1,286
-£
1,286
-£
1,286
-£
1,286
Accounting Income
£
214
£
1,214
£
3,214
£
2,714
£
2,714
£
2,714
-£
786
Average Accounting Income £ 1,714
Initial Investment £ 10,000
Accounting rate of return 17.14%
Payback period 3 years 9.78 months
Net Present value £ 6,728
Results Company A Company B
Net present value £ 4,419.78 £ 6,728
Rate of return 11.11% 17.14%
Payback period 5 years 7 months 3 years 10 months
(Krantz, 2016)
Company B has lowest payback period and highest NPV and rate of return which clearly
reflects to invest in project “Company B”. Company B provides higher NPV of £ 6,728 while
Company A has positive NPV of £ 4,419.78, which means it is good to choose Company B for
investment purpose due to higher NPV. Net present value (NPV) provides earnings that project
will provide if all the expenses and earnings are taken at present value. Rate of return means
percentage of total profit earned on the investment, so it is better to select “Company B” due to
higher rate of return.
⊘ This is a preview!⊘
Do you want full access?
Subscribe today to unlock all pages.

Trusted by 1+ million students worldwide

Solution 3:
The recommendation given in part 2 of this assignment is correct as all the investment
criteria such as NPV, rate of return and payback period favors the “Project B” which is very
good reason to consider project “Company B” for investment purpose.
The recommendation will change number of scenarios and they are defined below:
When initial investment is more than the certain limit that will make the NPV falls below
the NPV in case of “Company A”
When payback period increase from 5 years 7 months
When rate of return is lower than “Company A”
(Baker and Powell, 2010)
Paraphrase This Document
Need a fresh take? Get an instant paraphrase of this document with our AI Paraphraser

References
Baker, K. and Powell, G. 2010. Understanding Financial Management: A Practical Guide.
USA: John Wiley & Sons.
Brigham, F., and Michael C. 2013. Financial management: Theory & practice. Canada: Cengage
Learning.
Damodaran, A, 2011. Applied corporate finance. USA: John Wiley & sons.
Davies, T. and Crawford, I., 2011. Business accounting and finance. USA: Pearson.
Krantz, M. 2016. Fundamental Analysis for Dummies. USA: John Wiley & Sons.
Moles, P. and Kidwekk, D. 2011. Corporate finance. USA: John Wiley &sons.
1 out of 8
Related Documents
Your All-in-One AI-Powered Toolkit for Academic Success.
+13062052269
info@desklib.com
Available 24*7 on WhatsApp / Email
Unlock your academic potential
Copyright © 2020–2025 A2Z Services. All Rights Reserved. Developed and managed by ZUCOL.


