Capital Budgeting: Project Evaluation in Managerial Finance
VerifiedAdded on 2022/10/11
|10
|1671
|21
Homework Assignment
AI Summary
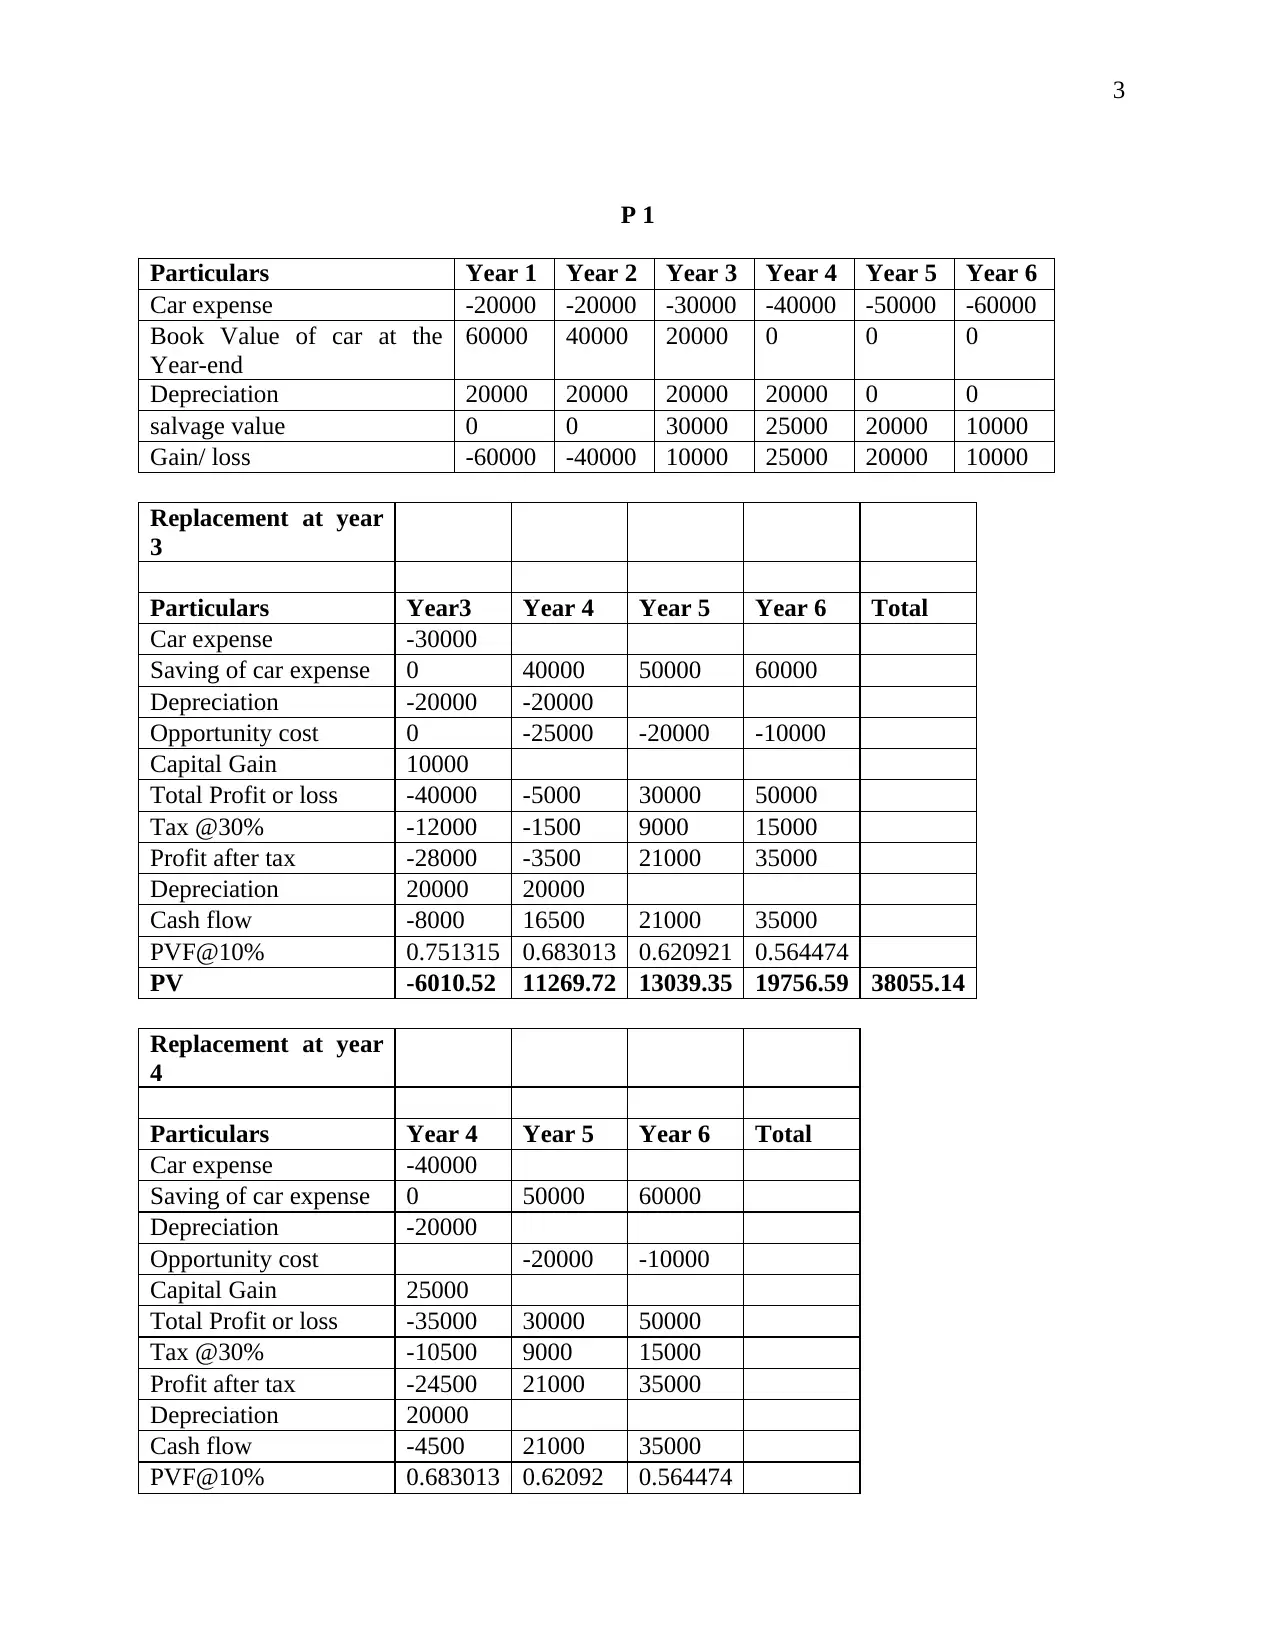
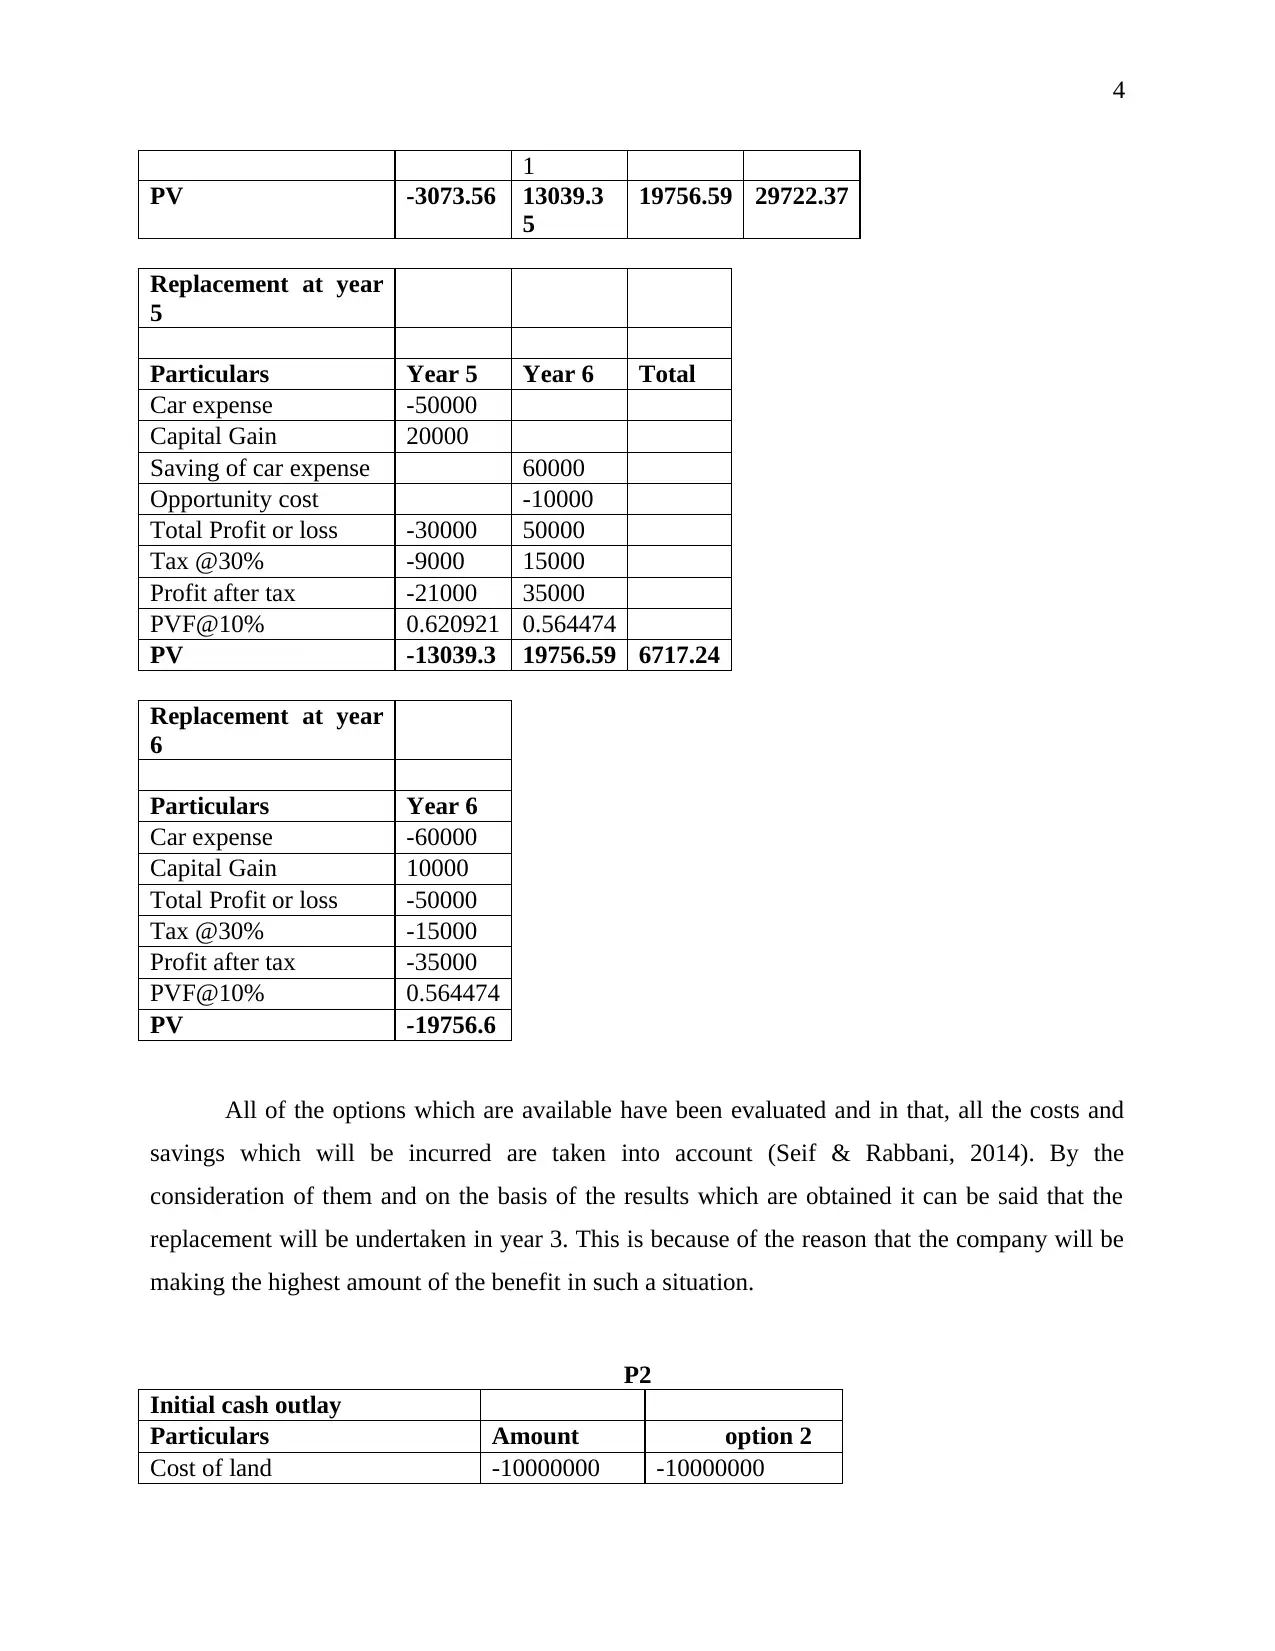
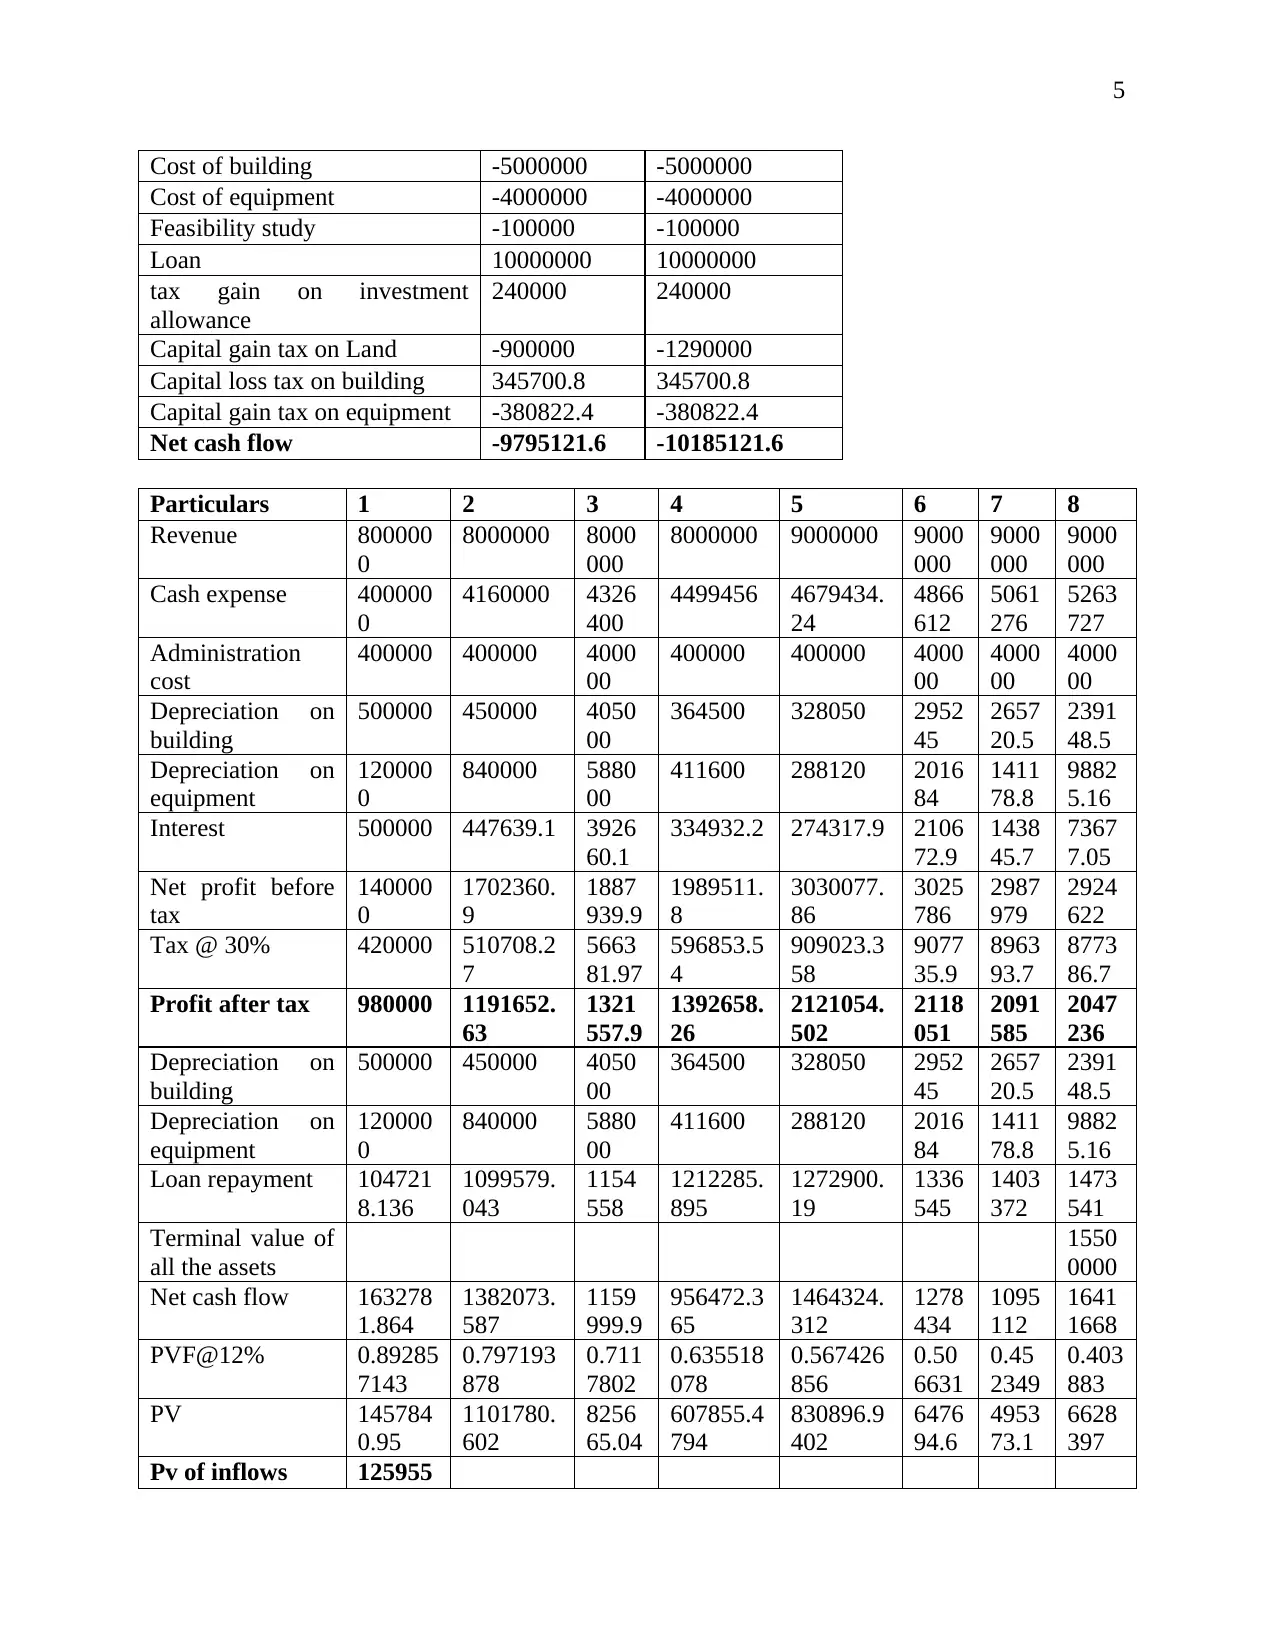
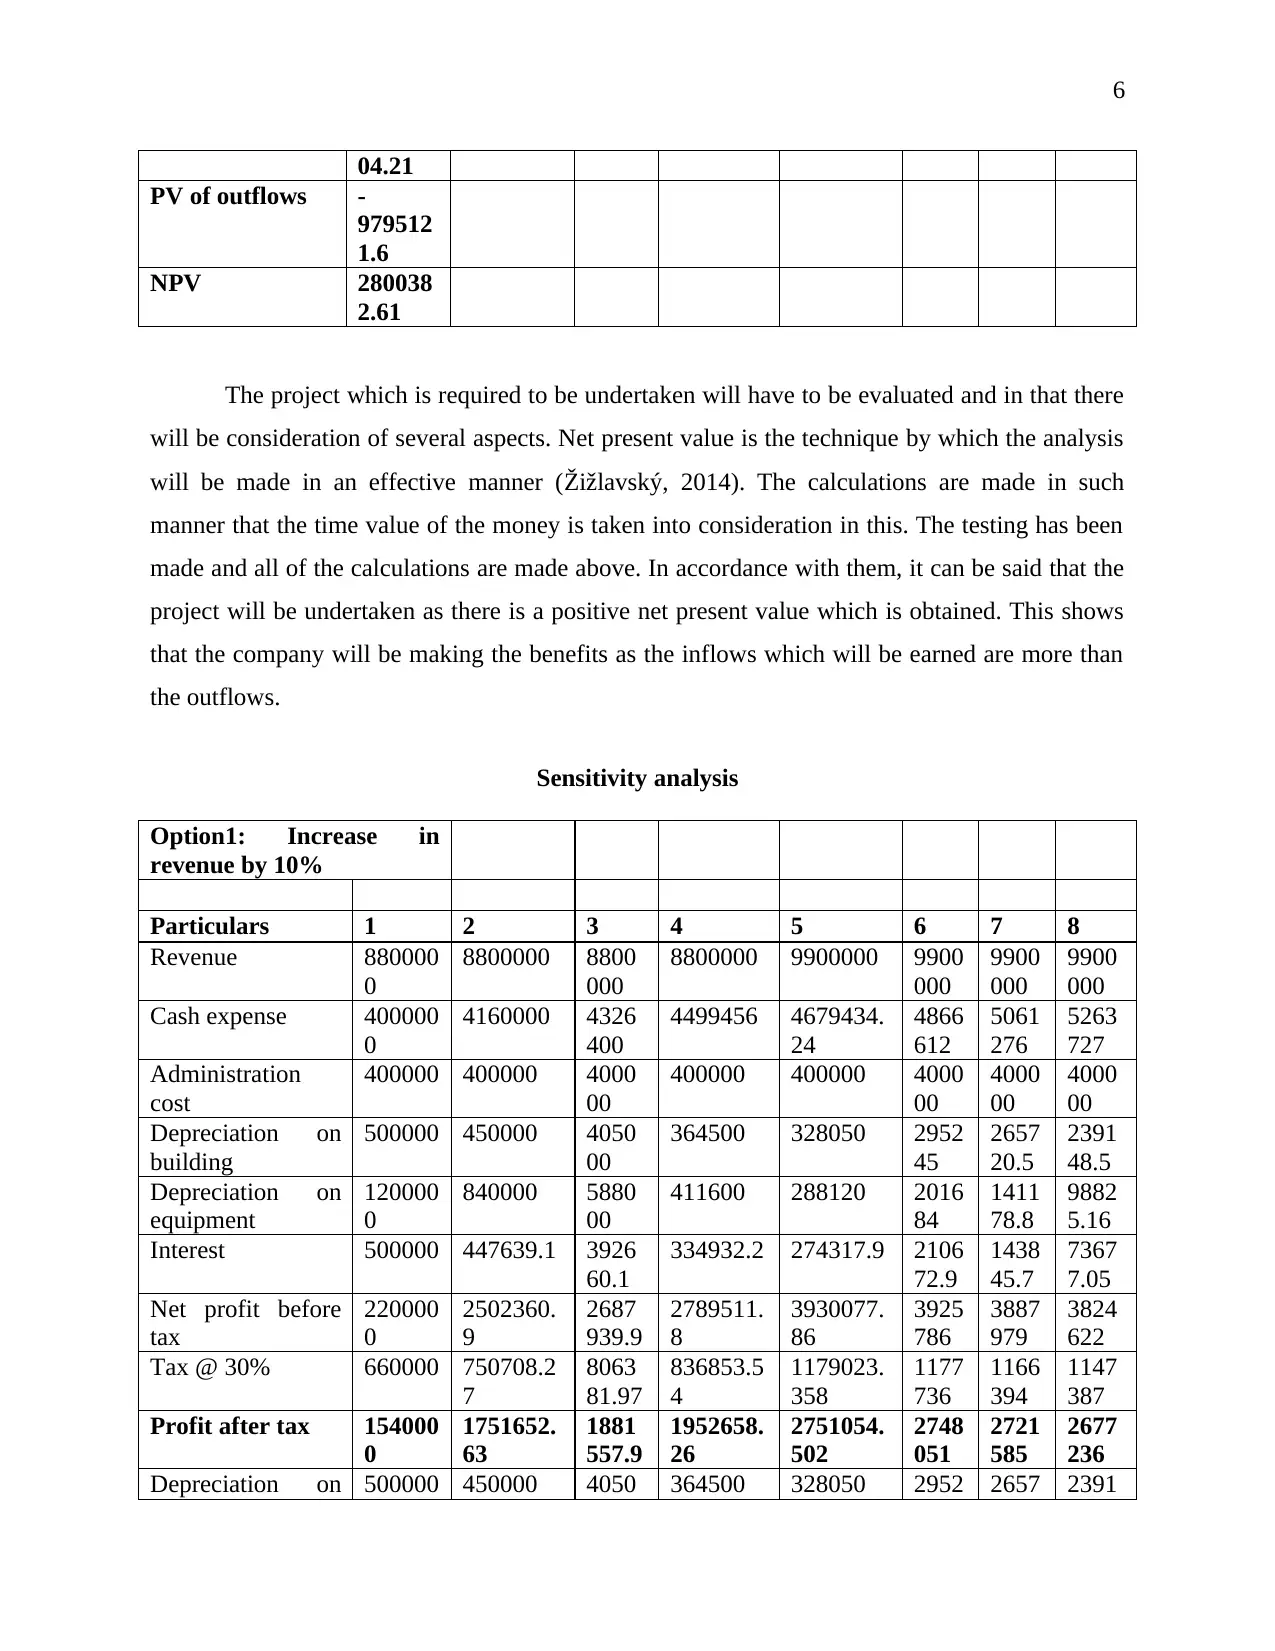
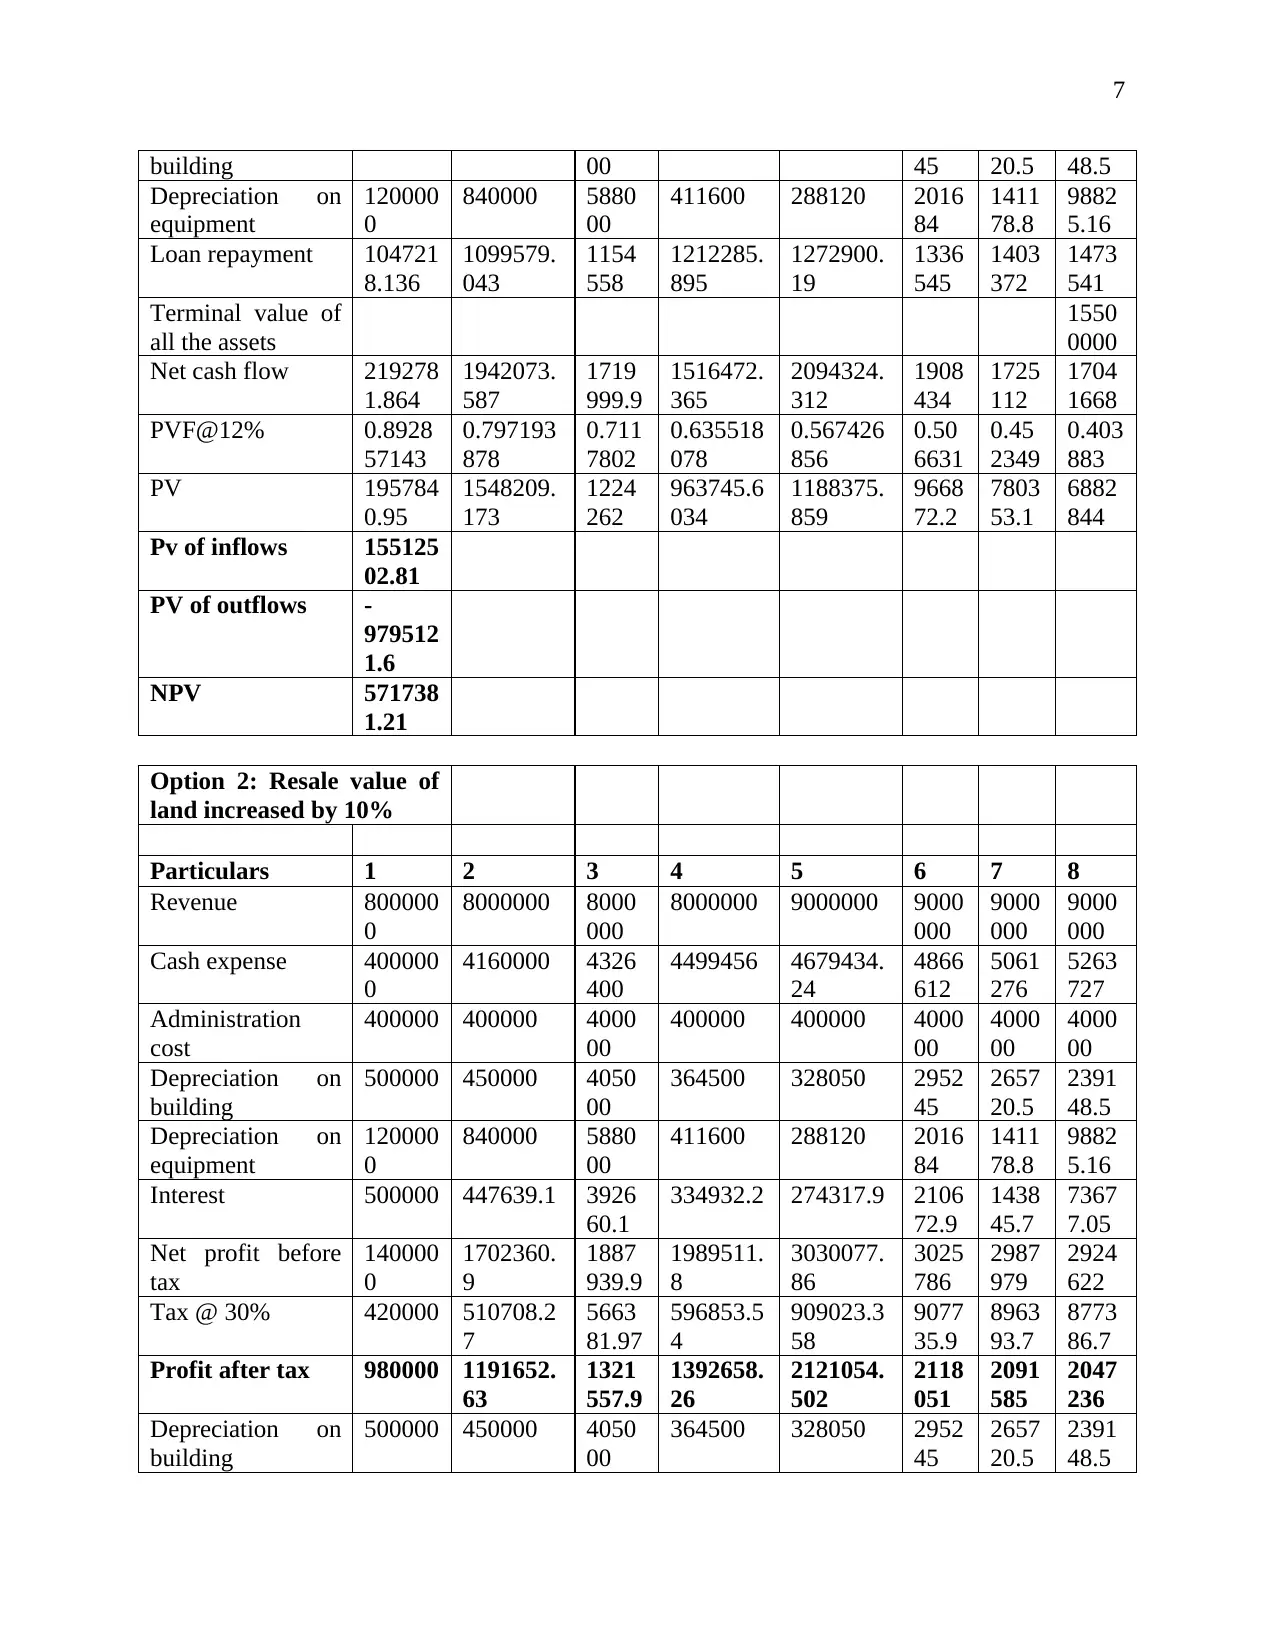
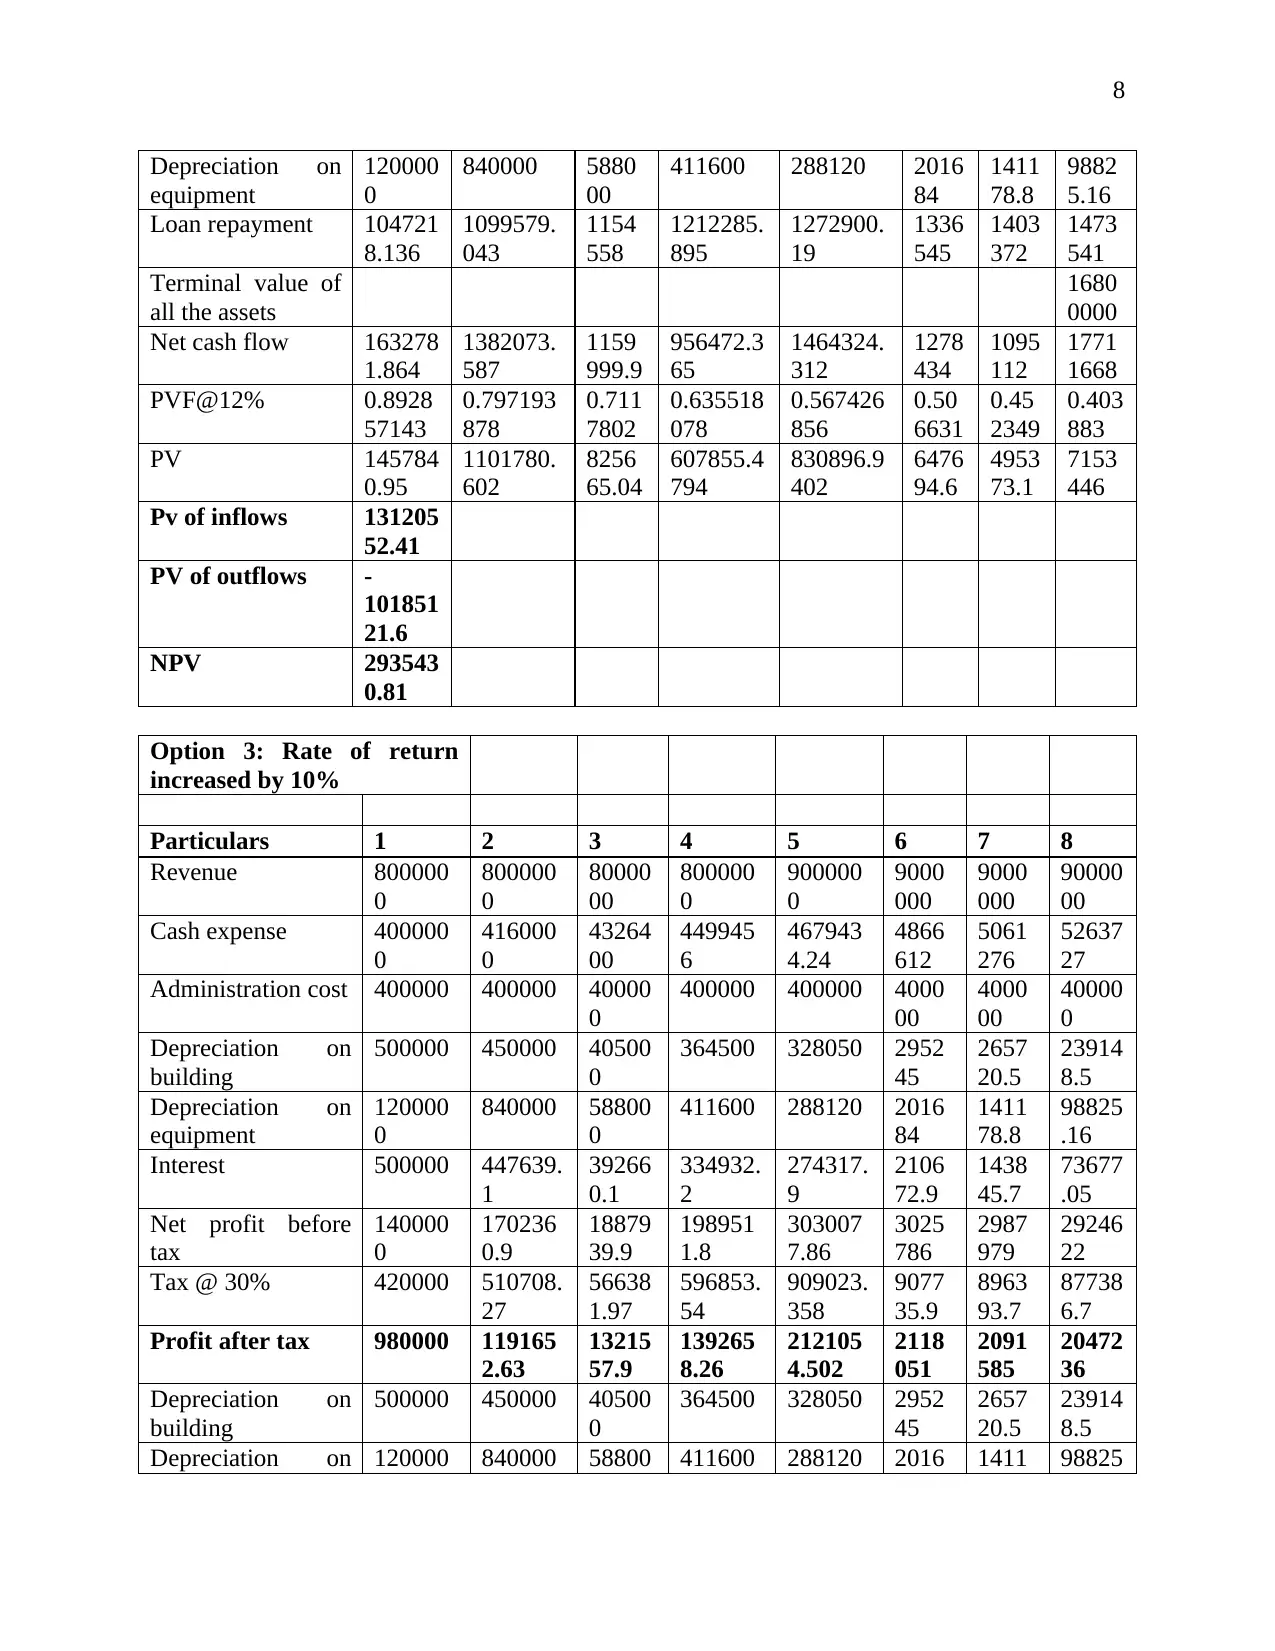
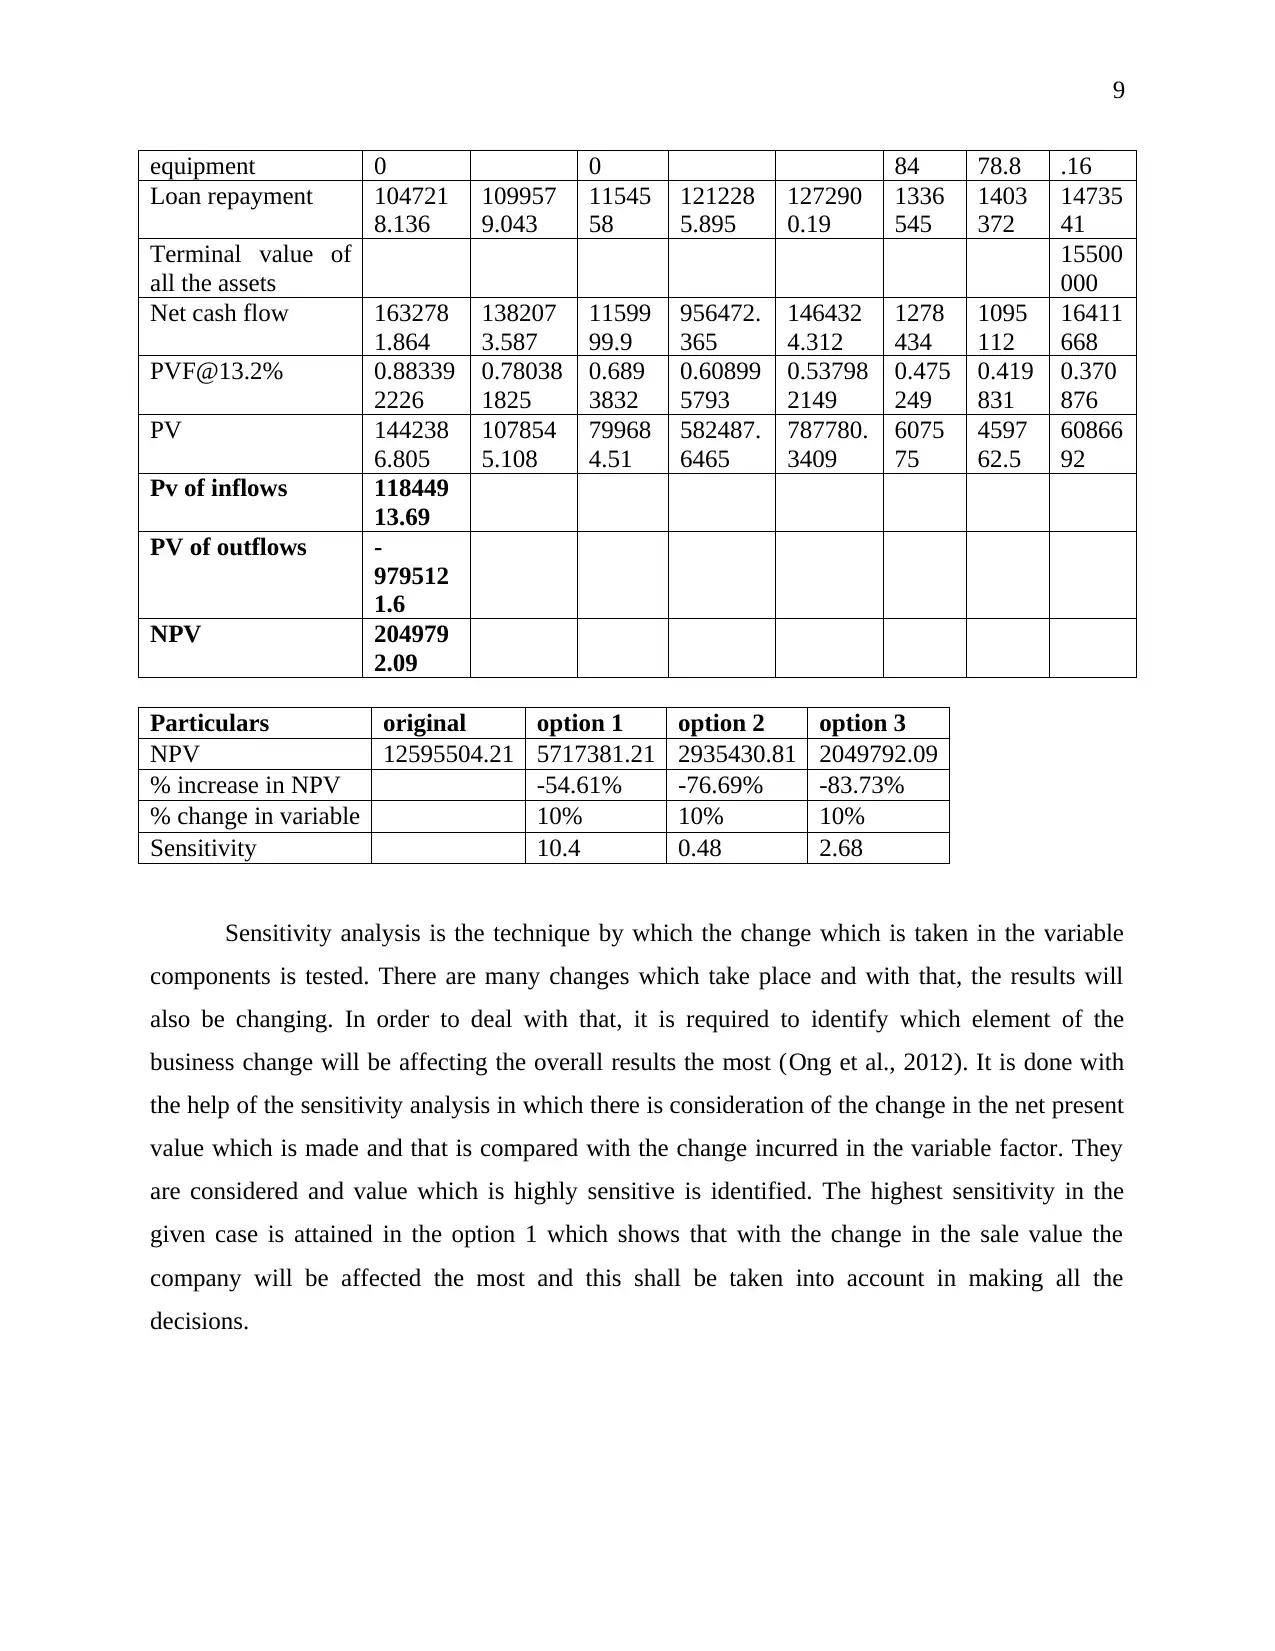
This managerial finance assignment focuses on capital budgeting, evaluating two investment projects using financial analysis techniques. The solution begins with a car replacement decision, calculating cash flows, depreciation, and opportunity costs to determine the optimal replacement year based on present value. The second part analyzes a real estate development project, calculating initial cash outlays, revenues, expenses, depreciation, and loan repayments over eight years. The net present value (NPV) is computed, and a positive NPV supports project acceptance. The assignment also includes a sensitivity analysis, testing how changes in revenue, resale value, and rate of return impact the NPV. The analysis reveals the project's sensitivity to changes in sales values, highlighting the importance of accurate forecasting in financial decision-making. The solution provides a detailed breakdown of calculations and explanations, along with references to relevant academic literature.

1
MANAGERIAL FINANCE
MANAGERIAL FINANCE
Secure Best Marks with AI Grader
Need help grading? Try our AI Grader for instant feedback on your assignments.

2
Table of Contents
P 1....................................................................................................................................................3
P2.....................................................................................................................................................4
References......................................................................................................................................10

3
P 1
Particulars Year 1 Year 2 Year 3 Year 4 Year 5 Year 6
Car expense -20000 -20000 -30000 -40000 -50000 -60000
Book Value of car at the
Year-end
60000 40000 20000 0 0 0
Depreciation 20000 20000 20000 20000 0 0
salvage value 0 0 30000 25000 20000 10000
Gain/ loss -60000 -40000 10000 25000 20000 10000
Replacement at year
3
Particulars Year3 Year 4 Year 5 Year 6 Total
Car expense -30000
Saving of car expense 0 40000 50000 60000
Depreciation -20000 -20000
Opportunity cost 0 -25000 -20000 -10000
Capital Gain 10000
Total Profit or loss -40000 -5000 30000 50000
Tax @30% -12000 -1500 9000 15000
Profit after tax -28000 -3500 21000 35000
Depreciation 20000 20000
Cash flow -8000 16500 21000 35000
PVF@10% 0.751315 0.683013 0.620921 0.564474
PV -6010.52 11269.72 13039.35 19756.59 38055.14
Replacement at year
4
Particulars Year 4 Year 5 Year 6 Total
Car expense -40000
Saving of car expense 0 50000 60000
Depreciation -20000
Opportunity cost -20000 -10000
Capital Gain 25000
Total Profit or loss -35000 30000 50000
Tax @30% -10500 9000 15000
Profit after tax -24500 21000 35000
Depreciation 20000
Cash flow -4500 21000 35000
PVF@10% 0.683013 0.62092 0.564474

4
1
PV -3073.56 13039.3
5
19756.59 29722.37
Replacement at year
5
Particulars Year 5 Year 6 Total
Car expense -50000
Capital Gain 20000
Saving of car expense 60000
Opportunity cost -10000
Total Profit or loss -30000 50000
Tax @30% -9000 15000
Profit after tax -21000 35000
PVF@10% 0.620921 0.564474
PV -13039.3 19756.59 6717.24
Replacement at year
6
Particulars Year 6
Car expense -60000
Capital Gain 10000
Total Profit or loss -50000
Tax @30% -15000
Profit after tax -35000
PVF@10% 0.564474
PV -19756.6
All of the options which are available have been evaluated and in that, all the costs and
savings which will be incurred are taken into account (Seif & Rabbani, 2014). By the
consideration of them and on the basis of the results which are obtained it can be said that the
replacement will be undertaken in year 3. This is because of the reason that the company will be
making the highest amount of the benefit in such a situation.
P2
Initial cash outlay
Particulars Amount option 2
Cost of land -10000000 -10000000
Secure Best Marks with AI Grader
Need help grading? Try our AI Grader for instant feedback on your assignments.

5
Cost of building -5000000 -5000000
Cost of equipment -4000000 -4000000
Feasibility study -100000 -100000
Loan 10000000 10000000
tax gain on investment
allowance
240000 240000
Capital gain tax on Land -900000 -1290000
Capital loss tax on building 345700.8 345700.8
Capital gain tax on equipment -380822.4 -380822.4
Net cash flow -9795121.6 -10185121.6
Particulars 1 2 3 4 5 6 7 8
Revenue 800000
0
8000000 8000
000
8000000 9000000 9000
000
9000
000
9000
000
Cash expense 400000
0
4160000 4326
400
4499456 4679434.
24
4866
612
5061
276
5263
727
Administration
cost
400000 400000 4000
00
400000 400000 4000
00
4000
00
4000
00
Depreciation on
building
500000 450000 4050
00
364500 328050 2952
45
2657
20.5
2391
48.5
Depreciation on
equipment
120000
0
840000 5880
00
411600 288120 2016
84
1411
78.8
9882
5.16
Interest 500000 447639.1 3926
60.1
334932.2 274317.9 2106
72.9
1438
45.7
7367
7.05
Net profit before
tax
140000
0
1702360.
9
1887
939.9
1989511.
8
3030077.
86
3025
786
2987
979
2924
622
Tax @ 30% 420000 510708.2
7
5663
81.97
596853.5
4
909023.3
58
9077
35.9
8963
93.7
8773
86.7
Profit after tax 980000 1191652.
63
1321
557.9
1392658.
26
2121054.
502
2118
051
2091
585
2047
236
Depreciation on
building
500000 450000 4050
00
364500 328050 2952
45
2657
20.5
2391
48.5
Depreciation on
equipment
120000
0
840000 5880
00
411600 288120 2016
84
1411
78.8
9882
5.16
Loan repayment 104721
8.136
1099579.
043
1154
558
1212285.
895
1272900.
19
1336
545
1403
372
1473
541
Terminal value of
all the assets
1550
0000
Net cash flow 163278
1.864
1382073.
587
1159
999.9
956472.3
65
1464324.
312
1278
434
1095
112
1641
1668
PVF@12% 0.89285
7143
0.797193
878
0.711
7802
0.635518
078
0.567426
856
0.50
6631
0.45
2349
0.403
883
PV 145784
0.95
1101780.
602
8256
65.04
607855.4
794
830896.9
402
6476
94.6
4953
73.1
6628
397
Pv of inflows 125955

6
04.21
PV of outflows -
979512
1.6
NPV 280038
2.61
The project which is required to be undertaken will have to be evaluated and in that there
will be consideration of several aspects. Net present value is the technique by which the analysis
will be made in an effective manner (Žižlavský, 2014). The calculations are made in such
manner that the time value of the money is taken into consideration in this. The testing has been
made and all of the calculations are made above. In accordance with them, it can be said that the
project will be undertaken as there is a positive net present value which is obtained. This shows
that the company will be making the benefits as the inflows which will be earned are more than
the outflows.
Sensitivity analysis
Option1: Increase in
revenue by 10%
Particulars 1 2 3 4 5 6 7 8
Revenue 880000
0
8800000 8800
000
8800000 9900000 9900
000
9900
000
9900
000
Cash expense 400000
0
4160000 4326
400
4499456 4679434.
24
4866
612
5061
276
5263
727
Administration
cost
400000 400000 4000
00
400000 400000 4000
00
4000
00
4000
00
Depreciation on
building
500000 450000 4050
00
364500 328050 2952
45
2657
20.5
2391
48.5
Depreciation on
equipment
120000
0
840000 5880
00
411600 288120 2016
84
1411
78.8
9882
5.16
Interest 500000 447639.1 3926
60.1
334932.2 274317.9 2106
72.9
1438
45.7
7367
7.05
Net profit before
tax
220000
0
2502360.
9
2687
939.9
2789511.
8
3930077.
86
3925
786
3887
979
3824
622
Tax @ 30% 660000 750708.2
7
8063
81.97
836853.5
4
1179023.
358
1177
736
1166
394
1147
387
Profit after tax 154000
0
1751652.
63
1881
557.9
1952658.
26
2751054.
502
2748
051
2721
585
2677
236
Depreciation on 500000 450000 4050 364500 328050 2952 2657 2391

7
building 00 45 20.5 48.5
Depreciation on
equipment
120000
0
840000 5880
00
411600 288120 2016
84
1411
78.8
9882
5.16
Loan repayment 104721
8.136
1099579.
043
1154
558
1212285.
895
1272900.
19
1336
545
1403
372
1473
541
Terminal value of
all the assets
1550
0000
Net cash flow 219278
1.864
1942073.
587
1719
999.9
1516472.
365
2094324.
312
1908
434
1725
112
1704
1668
PVF@12% 0.8928
57143
0.797193
878
0.711
7802
0.635518
078
0.567426
856
0.50
6631
0.45
2349
0.403
883
PV 195784
0.95
1548209.
173
1224
262
963745.6
034
1188375.
859
9668
72.2
7803
53.1
6882
844
Pv of inflows 155125
02.81
PV of outflows -
979512
1.6
NPV 571738
1.21
Option 2: Resale value of
land increased by 10%
Particulars 1 2 3 4 5 6 7 8
Revenue 800000
0
8000000 8000
000
8000000 9000000 9000
000
9000
000
9000
000
Cash expense 400000
0
4160000 4326
400
4499456 4679434.
24
4866
612
5061
276
5263
727
Administration
cost
400000 400000 4000
00
400000 400000 4000
00
4000
00
4000
00
Depreciation on
building
500000 450000 4050
00
364500 328050 2952
45
2657
20.5
2391
48.5
Depreciation on
equipment
120000
0
840000 5880
00
411600 288120 2016
84
1411
78.8
9882
5.16
Interest 500000 447639.1 3926
60.1
334932.2 274317.9 2106
72.9
1438
45.7
7367
7.05
Net profit before
tax
140000
0
1702360.
9
1887
939.9
1989511.
8
3030077.
86
3025
786
2987
979
2924
622
Tax @ 30% 420000 510708.2
7
5663
81.97
596853.5
4
909023.3
58
9077
35.9
8963
93.7
8773
86.7
Profit after tax 980000 1191652.
63
1321
557.9
1392658.
26
2121054.
502
2118
051
2091
585
2047
236
Depreciation on
building
500000 450000 4050
00
364500 328050 2952
45
2657
20.5
2391
48.5
Paraphrase This Document
Need a fresh take? Get an instant paraphrase of this document with our AI Paraphraser

8
Depreciation on
equipment
120000
0
840000 5880
00
411600 288120 2016
84
1411
78.8
9882
5.16
Loan repayment 104721
8.136
1099579.
043
1154
558
1212285.
895
1272900.
19
1336
545
1403
372
1473
541
Terminal value of
all the assets
1680
0000
Net cash flow 163278
1.864
1382073.
587
1159
999.9
956472.3
65
1464324.
312
1278
434
1095
112
1771
1668
PVF@12% 0.8928
57143
0.797193
878
0.711
7802
0.635518
078
0.567426
856
0.50
6631
0.45
2349
0.403
883
PV 145784
0.95
1101780.
602
8256
65.04
607855.4
794
830896.9
402
6476
94.6
4953
73.1
7153
446
Pv of inflows 131205
52.41
PV of outflows -
101851
21.6
NPV 293543
0.81
Option 3: Rate of return
increased by 10%
Particulars 1 2 3 4 5 6 7 8
Revenue 800000
0
800000
0
80000
00
800000
0
900000
0
9000
000
9000
000
90000
00
Cash expense 400000
0
416000
0
43264
00
449945
6
467943
4.24
4866
612
5061
276
52637
27
Administration cost 400000 400000 40000
0
400000 400000 4000
00
4000
00
40000
0
Depreciation on
building
500000 450000 40500
0
364500 328050 2952
45
2657
20.5
23914
8.5
Depreciation on
equipment
120000
0
840000 58800
0
411600 288120 2016
84
1411
78.8
98825
.16
Interest 500000 447639.
1
39266
0.1
334932.
2
274317.
9
2106
72.9
1438
45.7
73677
.05
Net profit before
tax
140000
0
170236
0.9
18879
39.9
198951
1.8
303007
7.86
3025
786
2987
979
29246
22
Tax @ 30% 420000 510708.
27
56638
1.97
596853.
54
909023.
358
9077
35.9
8963
93.7
87738
6.7
Profit after tax 980000 119165
2.63
13215
57.9
139265
8.26
212105
4.502
2118
051
2091
585
20472
36
Depreciation on
building
500000 450000 40500
0
364500 328050 2952
45
2657
20.5
23914
8.5
Depreciation on 120000 840000 58800 411600 288120 2016 1411 98825
Depreciation on
equipment
120000
0
840000 5880
00
411600 288120 2016
84
1411
78.8
9882
5.16
Loan repayment 104721
8.136
1099579.
043
1154
558
1212285.
895
1272900.
19
1336
545
1403
372
1473
541
Terminal value of
all the assets
1680
0000
Net cash flow 163278
1.864
1382073.
587
1159
999.9
956472.3
65
1464324.
312
1278
434
1095
112
1771
1668
PVF@12% 0.8928
57143
0.797193
878
0.711
7802
0.635518
078
0.567426
856
0.50
6631
0.45
2349
0.403
883
PV 145784
0.95
1101780.
602
8256
65.04
607855.4
794
830896.9
402
6476
94.6
4953
73.1
7153
446
Pv of inflows 131205
52.41
PV of outflows -
101851
21.6
NPV 293543
0.81
Option 3: Rate of return
increased by 10%
Particulars 1 2 3 4 5 6 7 8
Revenue 800000
0
800000
0
80000
00
800000
0
900000
0
9000
000
9000
000
90000
00
Cash expense 400000
0
416000
0
43264
00
449945
6
467943
4.24
4866
612
5061
276
52637
27
Administration cost 400000 400000 40000
0
400000 400000 4000
00
4000
00
40000
0
Depreciation on
building
500000 450000 40500
0
364500 328050 2952
45
2657
20.5
23914
8.5
Depreciation on
equipment
120000
0
840000 58800
0
411600 288120 2016
84
1411
78.8
98825
.16
Interest 500000 447639.
1
39266
0.1
334932.
2
274317.
9
2106
72.9
1438
45.7
73677
.05
Net profit before
tax
140000
0
170236
0.9
18879
39.9
198951
1.8
303007
7.86
3025
786
2987
979
29246
22
Tax @ 30% 420000 510708.
27
56638
1.97
596853.
54
909023.
358
9077
35.9
8963
93.7
87738
6.7
Profit after tax 980000 119165
2.63
13215
57.9
139265
8.26
212105
4.502
2118
051
2091
585
20472
36
Depreciation on
building
500000 450000 40500
0
364500 328050 2952
45
2657
20.5
23914
8.5
Depreciation on 120000 840000 58800 411600 288120 2016 1411 98825

9
equipment 0 0 84 78.8 .16
Loan repayment 104721
8.136
109957
9.043
11545
58
121228
5.895
127290
0.19
1336
545
1403
372
14735
41
Terminal value of
all the assets
15500
000
Net cash flow 163278
1.864
138207
3.587
11599
99.9
956472.
365
146432
4.312
1278
434
1095
112
16411
668
PVF@13.2% 0.88339
2226
0.78038
1825
0.689
3832
0.60899
5793
0.53798
2149
0.475
249
0.419
831
0.370
876
PV 144238
6.805
107854
5.108
79968
4.51
582487.
6465
787780.
3409
6075
75
4597
62.5
60866
92
Pv of inflows 118449
13.69
PV of outflows -
979512
1.6
NPV 204979
2.09
Particulars original option 1 option 2 option 3
NPV 12595504.21 5717381.21 2935430.81 2049792.09
% increase in NPV -54.61% -76.69% -83.73%
% change in variable 10% 10% 10%
Sensitivity 10.4 0.48 2.68
Sensitivity analysis is the technique by which the change which is taken in the variable
components is tested. There are many changes which take place and with that, the results will
also be changing. In order to deal with that, it is required to identify which element of the
business change will be affecting the overall results the most (Ong et al., 2012). It is done with
the help of the sensitivity analysis in which there is consideration of the change in the net present
value which is made and that is compared with the change incurred in the variable factor. They
are considered and value which is highly sensitive is identified. The highest sensitivity in the
given case is attained in the option 1 which shows that with the change in the sale value the
company will be affected the most and this shall be taken into account in making all the
decisions.

10
References
Ong, H. C., Mahlia, T. M. I., Masjuki, H. H., & Honnery, D. (2012). Life cycle cost and
sensitivity analysis of palm biodiesel production. Fuel, 98, 131-139.
Seif, J., & Rabbani, M. (2014). Component based life cycle costing in replacement
decisions. Journal of Quality in Maintenance Engineering, 20(4), 436-452.
Žižlavský, O. (2014). Net present value approach: method for economic assessment of
innovation projects. Procedia-Social and Behavioral Sciences, 156, 506-512.
1 out of 10
Related Documents

Your All-in-One AI-Powered Toolkit for Academic Success.
+13062052269
info@desklib.com
Available 24*7 on WhatsApp / Email
Unlock your academic potential
© 2024 | Zucol Services PVT LTD | All rights reserved.