A Comprehensive Report on Capital Budgeting Techniques and Analysis
VerifiedAdded on 2020/04/01
|14
|2489
|224
Report
AI Summary
This report delves into the core concepts of capital budgeting, focusing on Net Present Value (NPV) and Internal Rate of Return (IRR) as primary evaluation methods for project selection. It explores how these methods are influenced by various analytical techniques, including sensitivity analysis, scenario analysis, simulation analysis, and break-even analysis. The report explains each technique, providing examples to illustrate their application in assessing project profitability, risk, and uncertainty. Sensitivity analysis is examined through pessimistic, expected, and optimistic scenarios, showcasing the impact of changing variables on NPV. Scenario analysis is discussed in the context of competitive pressures, while simulation analysis, employing Monte-Carlo methods, addresses real-world uncertainties. Finally, the report provides a comprehensive overview of how these techniques contribute to effective managerial decision-making in the context of capital budgeting.

Capital Budgeting techniques
1
1
Paraphrase This Document
Need a fresh take? Get an instant paraphrase of this document with our AI Paraphraser
Contents
Introduction......................................................................................................................................3
Net Present Value and Internal rate of return..................................................................................3
Discussion of all the four analysis techniques that impacts the results under NPV and IRR..........5
Sensitivity Analysis.........................................................................................................................5
Scenario analysis...........................................................................................................................11
Simulation Analysis.......................................................................................................................13
Break Even analysis.......................................................................................................................13
Conclusion.....................................................................................................................................14
References......................................................................................................................................15
2
Introduction
Management decision making is the most complex process that involves project selection
in order to accomplish the organization goals. Project selection means selecting the best option
from the available choice of projects. Capital budgeting is the process that helps the managers to
analyze the projects on the various grounds such as their profitability, risk and uncertainty.
Capital budgeting decisions can be taken to accomplish the requirement of working capital and
also to acquire the fixed assets. Other than project selection can also be done using the
techniques provided in the capital budgeting. The process of capital budgeting is truly based on
cost benefit analysis and cash flow generated by the project. So it can be said that there is no
arbitrary method of selection under capital budgeting decisions. There are various methods
available to analyze the projects but net present value (NPV) and internal rate of return (IRR) are
widely used due to their precise decision making capacity (Otley and Emmanuel, 2013).
The net present value and internal rate of return can further be analyzed using the
methods such as sensitivity analysis, scenario analysis, breakeven analysis and simulation
analysis. The purpose of report is to check role that capital budgeting decisions play while
performing the managerial process. So, NPV and IRR method will be analyzed in detail on the
ground of all the four analysis techniques.
Net Present Value and Internal rate of return
In order to better understand the techniques of capital budgeting it is essential to
understand the concept of NPV and IRR. Both these methods are impacted by all four techniques
namely sensitivity analysis, scenario analysis, breakeven analysis and simulation analysis.
3
⊘ This is a preview!⊘
Do you want full access?
Subscribe today to unlock all pages.
Trusted by 1+ million students worldwide
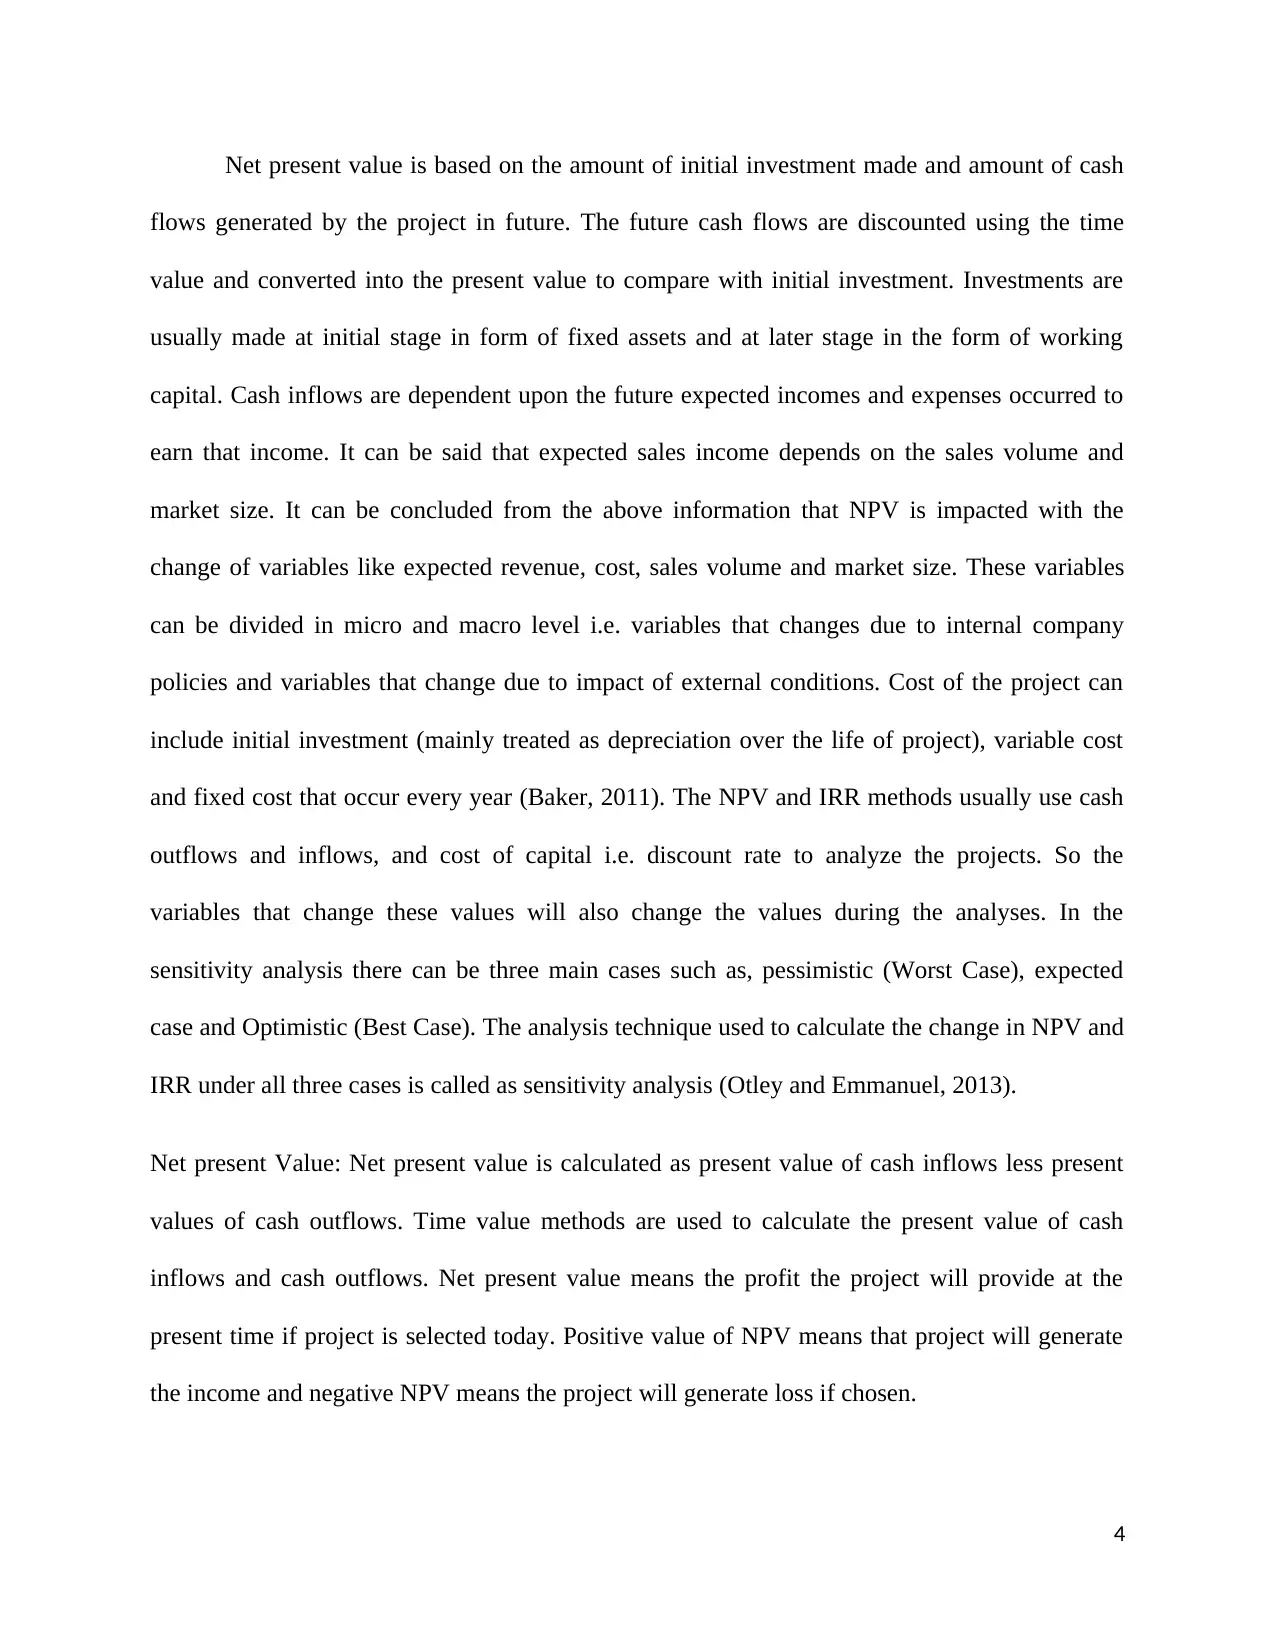
Net present value is based on the amount of initial investment made and amount of cash
flows generated by the project in future. The future cash flows are discounted using the time
value and converted into the present value to compare with initial investment. Investments are
usually made at initial stage in form of fixed assets and at later stage in the form of working
capital. Cash inflows are dependent upon the future expected incomes and expenses occurred to
earn that income. It can be said that expected sales income depends on the sales volume and
market size. It can be concluded from the above information that NPV is impacted with the
change of variables like expected revenue, cost, sales volume and market size. These variables
can be divided in micro and macro level i.e. variables that changes due to internal company
policies and variables that change due to impact of external conditions. Cost of the project can
include initial investment (mainly treated as depreciation over the life of project), variable cost
and fixed cost that occur every year (Baker, 2011). The NPV and IRR methods usually use cash
outflows and inflows, and cost of capital i.e. discount rate to analyze the projects. So the
variables that change these values will also change the values during the analyses. In the
sensitivity analysis there can be three main cases such as, pessimistic (Worst Case), expected
case and Optimistic (Best Case). The analysis technique used to calculate the change in NPV and
IRR under all three cases is called as sensitivity analysis (Otley and Emmanuel, 2013).
Net present Value: Net present value is calculated as present value of cash inflows less present
values of cash outflows. Time value methods are used to calculate the present value of cash
inflows and cash outflows. Net present value means the profit the project will provide at the
present time if project is selected today. Positive value of NPV means that project will generate
the income and negative NPV means the project will generate loss if chosen.
4
Paraphrase This Document
Need a fresh take? Get an instant paraphrase of this document with our AI Paraphraser
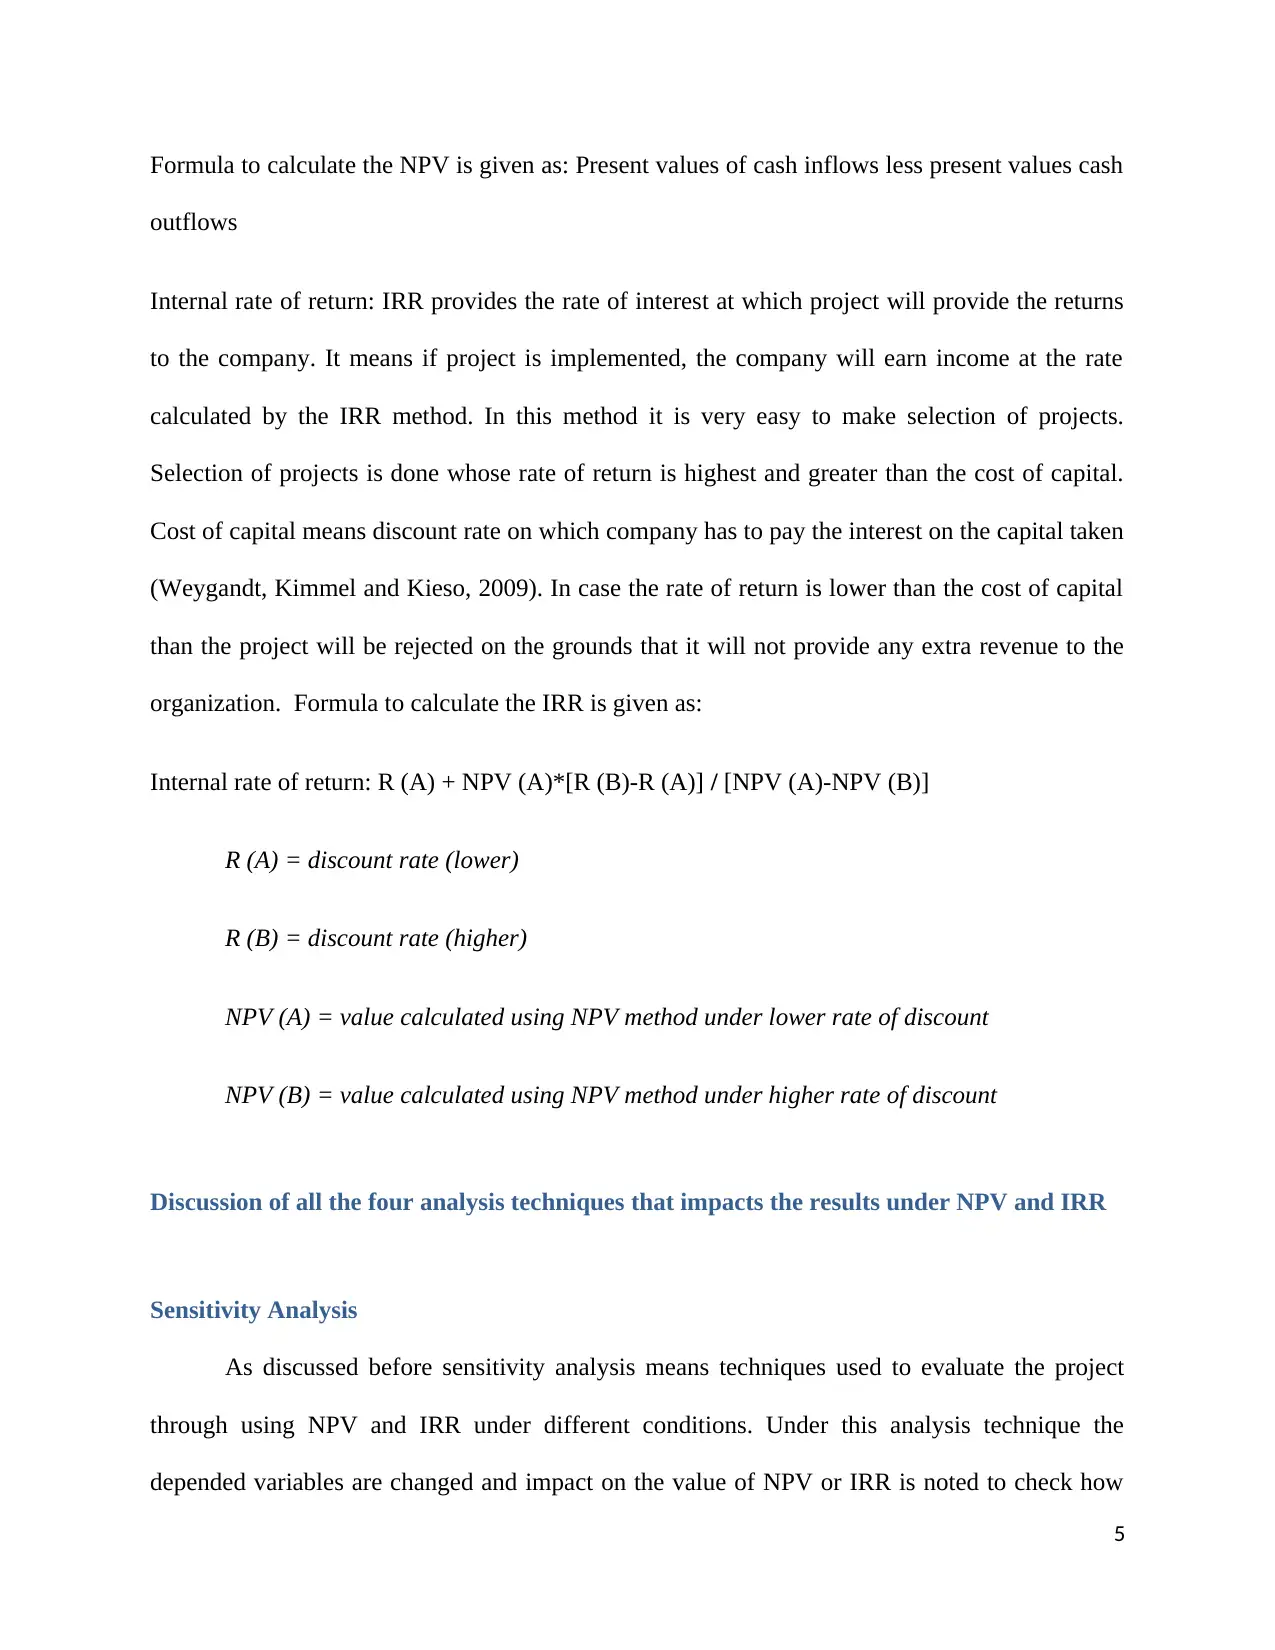
Formula to calculate the NPV is given as: Present values of cash inflows less present values cash
outflows
Internal rate of return: IRR provides the rate of interest at which project will provide the returns
to the company. It means if project is implemented, the company will earn income at the rate
calculated by the IRR method. In this method it is very easy to make selection of projects.
Selection of projects is done whose rate of return is highest and greater than the cost of capital.
Cost of capital means discount rate on which company has to pay the interest on the capital taken
(Weygandt, Kimmel and Kieso, 2009). In case the rate of return is lower than the cost of capital
than the project will be rejected on the grounds that it will not provide any extra revenue to the
organization. Formula to calculate the IRR is given as:
Internal rate of return: R (A) + NPV (A)*[R (B)-R (A)] / [NPV (A)-NPV (B)]
R (A) = discount rate (lower)
R (B) = discount rate (higher)
NPV (A) = value calculated using NPV method under lower rate of discount
NPV (B) = value calculated using NPV method under higher rate of discount
Discussion of all the four analysis techniques that impacts the results under NPV and IRR
Sensitivity Analysis
As discussed before sensitivity analysis means techniques used to evaluate the project
through using NPV and IRR under different conditions. Under this analysis technique the
depended variables are changed and impact on the value of NPV or IRR is noted to check how
5
much project is influenced to that change. So it can be said that this technique is used to check
how the various values of independent variable react to the underline dependent variable within
the given set of assumptions. With the help of this analysis technique management can decide
how project will response under various situations. Every organization is prone to various
circumstances that can be good, normal or worst depending upon the situation. So it is important
to analyze the projects under every situation so that management will be aware of pro and cons
of that particular project. Under sensitivity analysis dependent variables that are used to calculate
NPV and IRR are changed and change in other value are noted to check how much the NPV and
IRR are affected due to change in one dependent variable (Otley and Emmanuel, 2013). The
sensitivity analysis has series of steps that have to be followed while carrying out the process:
In first step, all the dependent variables are identified that impact the value of NPV and
IRR
In second step, relation between the different dependent or independent variables are
framed in order to calculate the values of NPV and IRR under different situation.
In the last step, evaluation table is prepared to check the impact of change in value of
NPV or IRR due to change in dependent variables
Now, to have the better understanding of the sensitivity analysis method it is important to
understand this through use of example. In this example three situations have been taken as
discussed above, pessimistic, expected and optimistic situation. It is decided to change the value
of cash inflows, initial cash flows and fixed cost to check the change in all three situation (Baker,
2011).
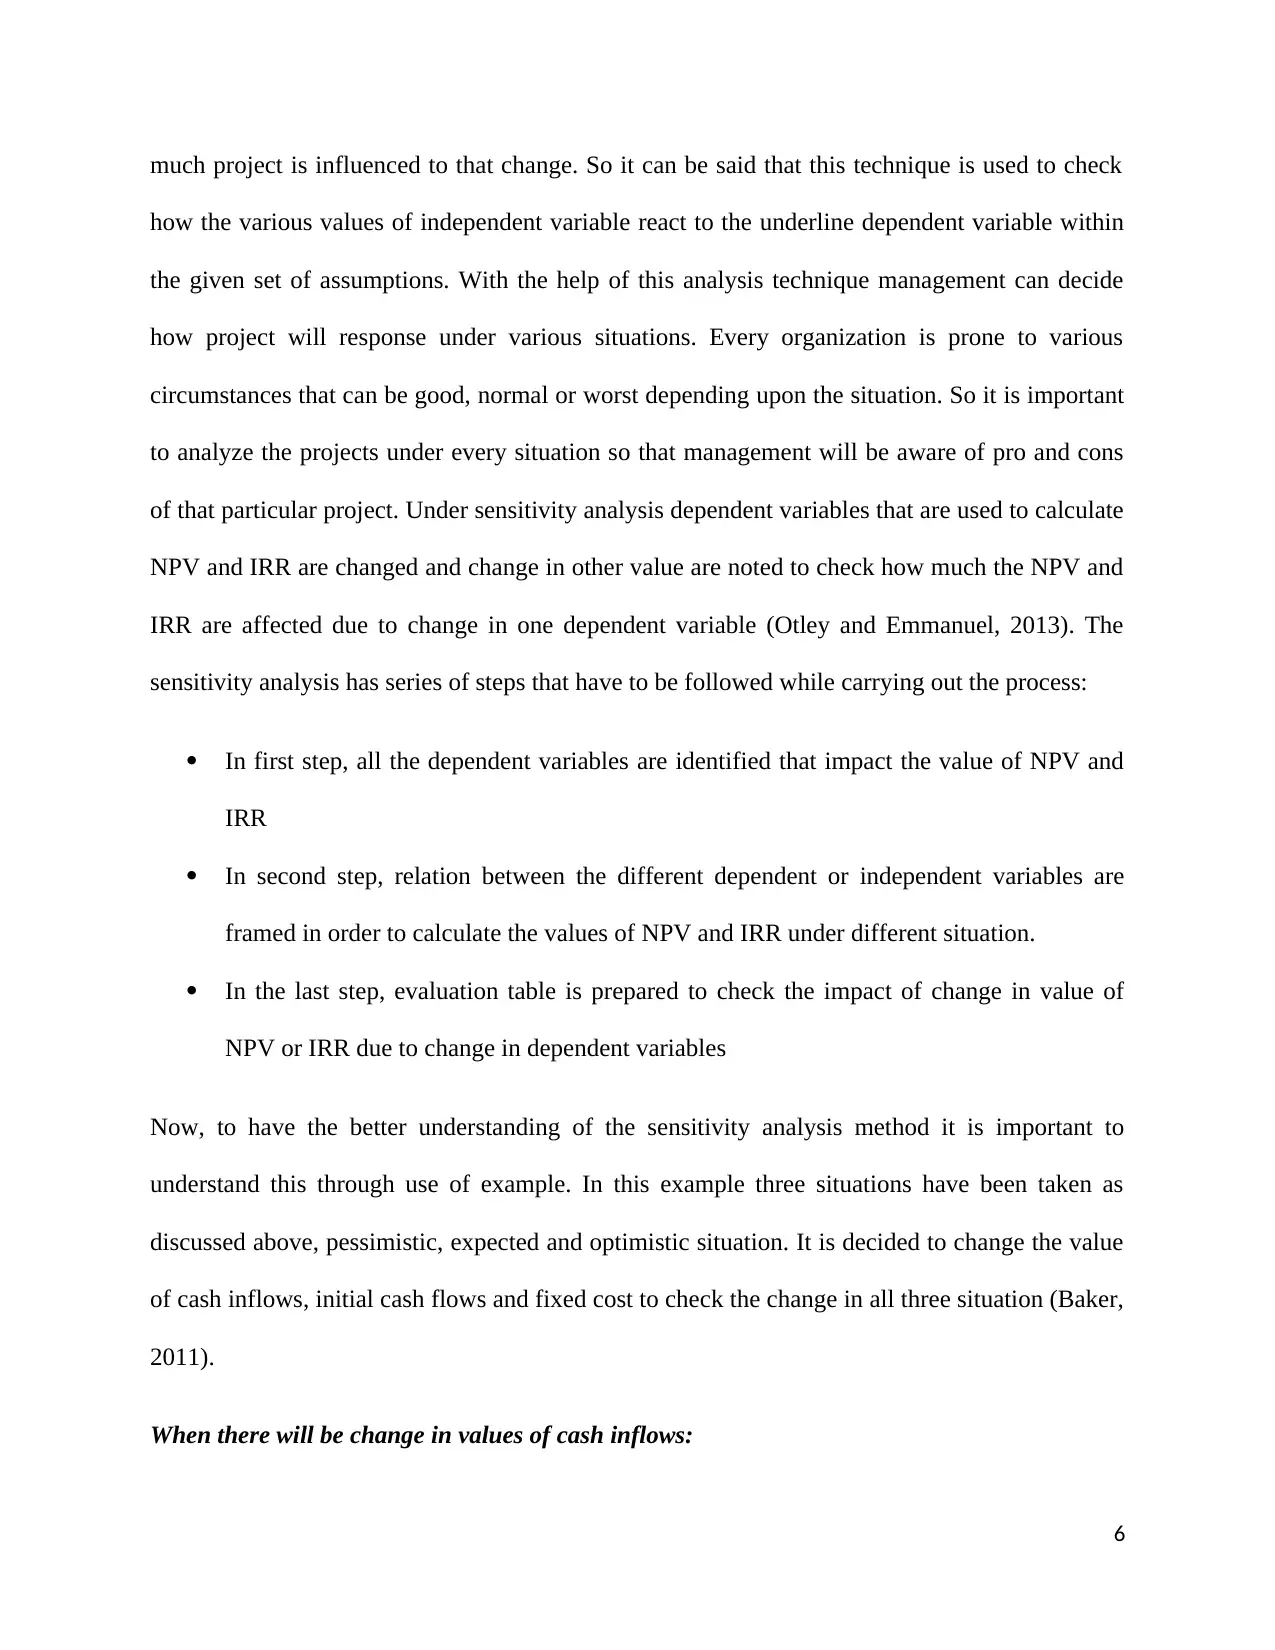
When there will be change in values of cash inflows:
6
how the various values of independent variable react to the underline dependent variable within
the given set of assumptions. With the help of this analysis technique management can decide
how project will response under various situations. Every organization is prone to various
circumstances that can be good, normal or worst depending upon the situation. So it is important
to analyze the projects under every situation so that management will be aware of pro and cons
of that particular project. Under sensitivity analysis dependent variables that are used to calculate
NPV and IRR are changed and change in other value are noted to check how much the NPV and
IRR are affected due to change in one dependent variable (Otley and Emmanuel, 2013). The
sensitivity analysis has series of steps that have to be followed while carrying out the process:
In first step, all the dependent variables are identified that impact the value of NPV and
IRR
In second step, relation between the different dependent or independent variables are
framed in order to calculate the values of NPV and IRR under different situation.
In the last step, evaluation table is prepared to check the impact of change in value of
NPV or IRR due to change in dependent variables
Now, to have the better understanding of the sensitivity analysis method it is important to
understand this through use of example. In this example three situations have been taken as
discussed above, pessimistic, expected and optimistic situation. It is decided to change the value
of cash inflows, initial cash flows and fixed cost to check the change in all three situation (Baker,
2011).
When there will be change in values of cash inflows:
6
⊘ This is a preview!⊘
Do you want full access?
Subscribe today to unlock all pages.
Trusted by 1+ million students worldwide
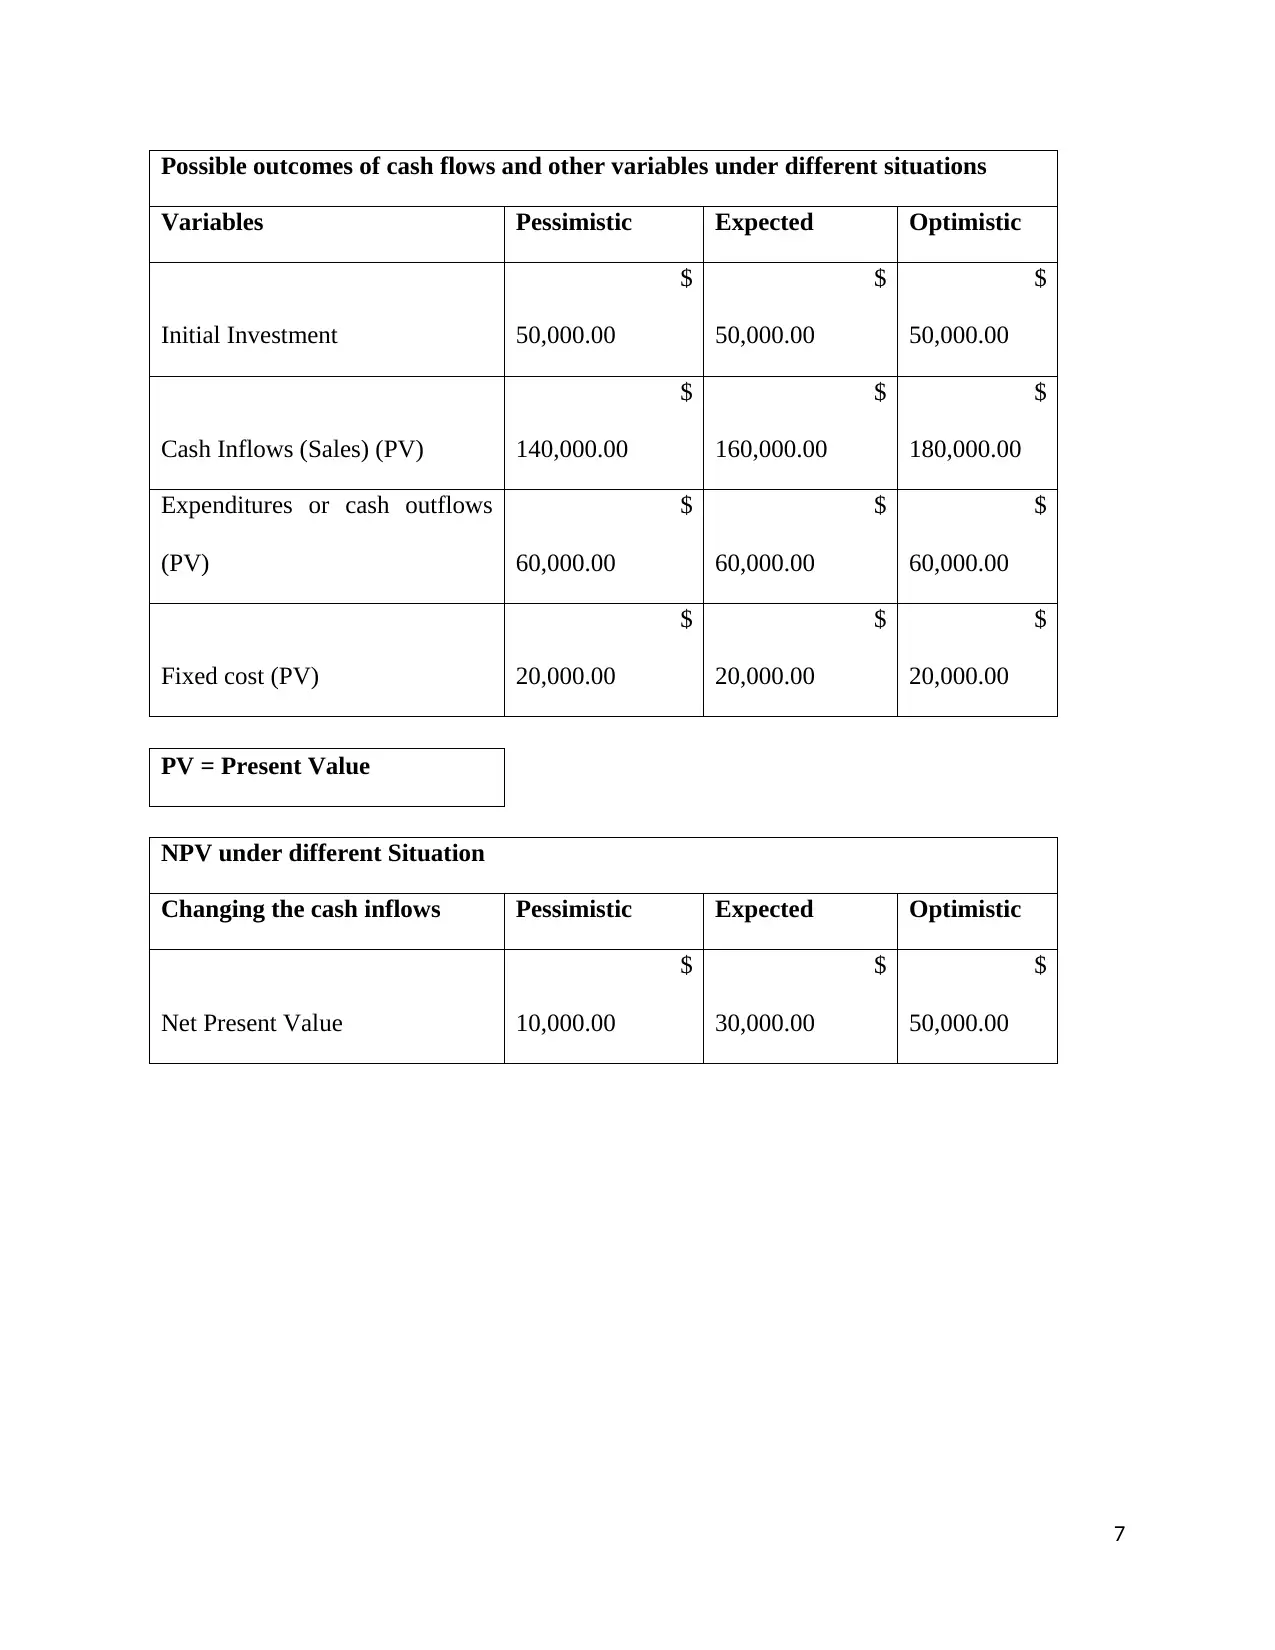
Possible outcomes of cash flows and other variables under different situations
Variables Pessimistic Expected Optimistic
Initial Investment
$
50,000.00
$
50,000.00
$
50,000.00
Cash Inflows (Sales) (PV)
$
140,000.00
$
160,000.00
$
180,000.00
Expenditures or cash outflows
(PV)
$
60,000.00
$
60,000.00
$
60,000.00
Fixed cost (PV)
$
20,000.00
$
20,000.00
$
20,000.00
PV = Present Value
NPV under different Situation
Changing the cash inflows Pessimistic Expected Optimistic
Net Present Value
$
10,000.00
$
30,000.00
$
50,000.00
7
Paraphrase This Document
Need a fresh take? Get an instant paraphrase of this document with our AI Paraphraser
Pessimistic Expected Optimistic
$-
$5,000.00
$10,000.00
$15,000.00
$20,000.00
$25,000.00
$30,000.00
$35,000.00
$40,000.00
$45,000.00
$50,000.00
Sensitivity Analysis (Change in Cash
Inflows)
Net Present Value
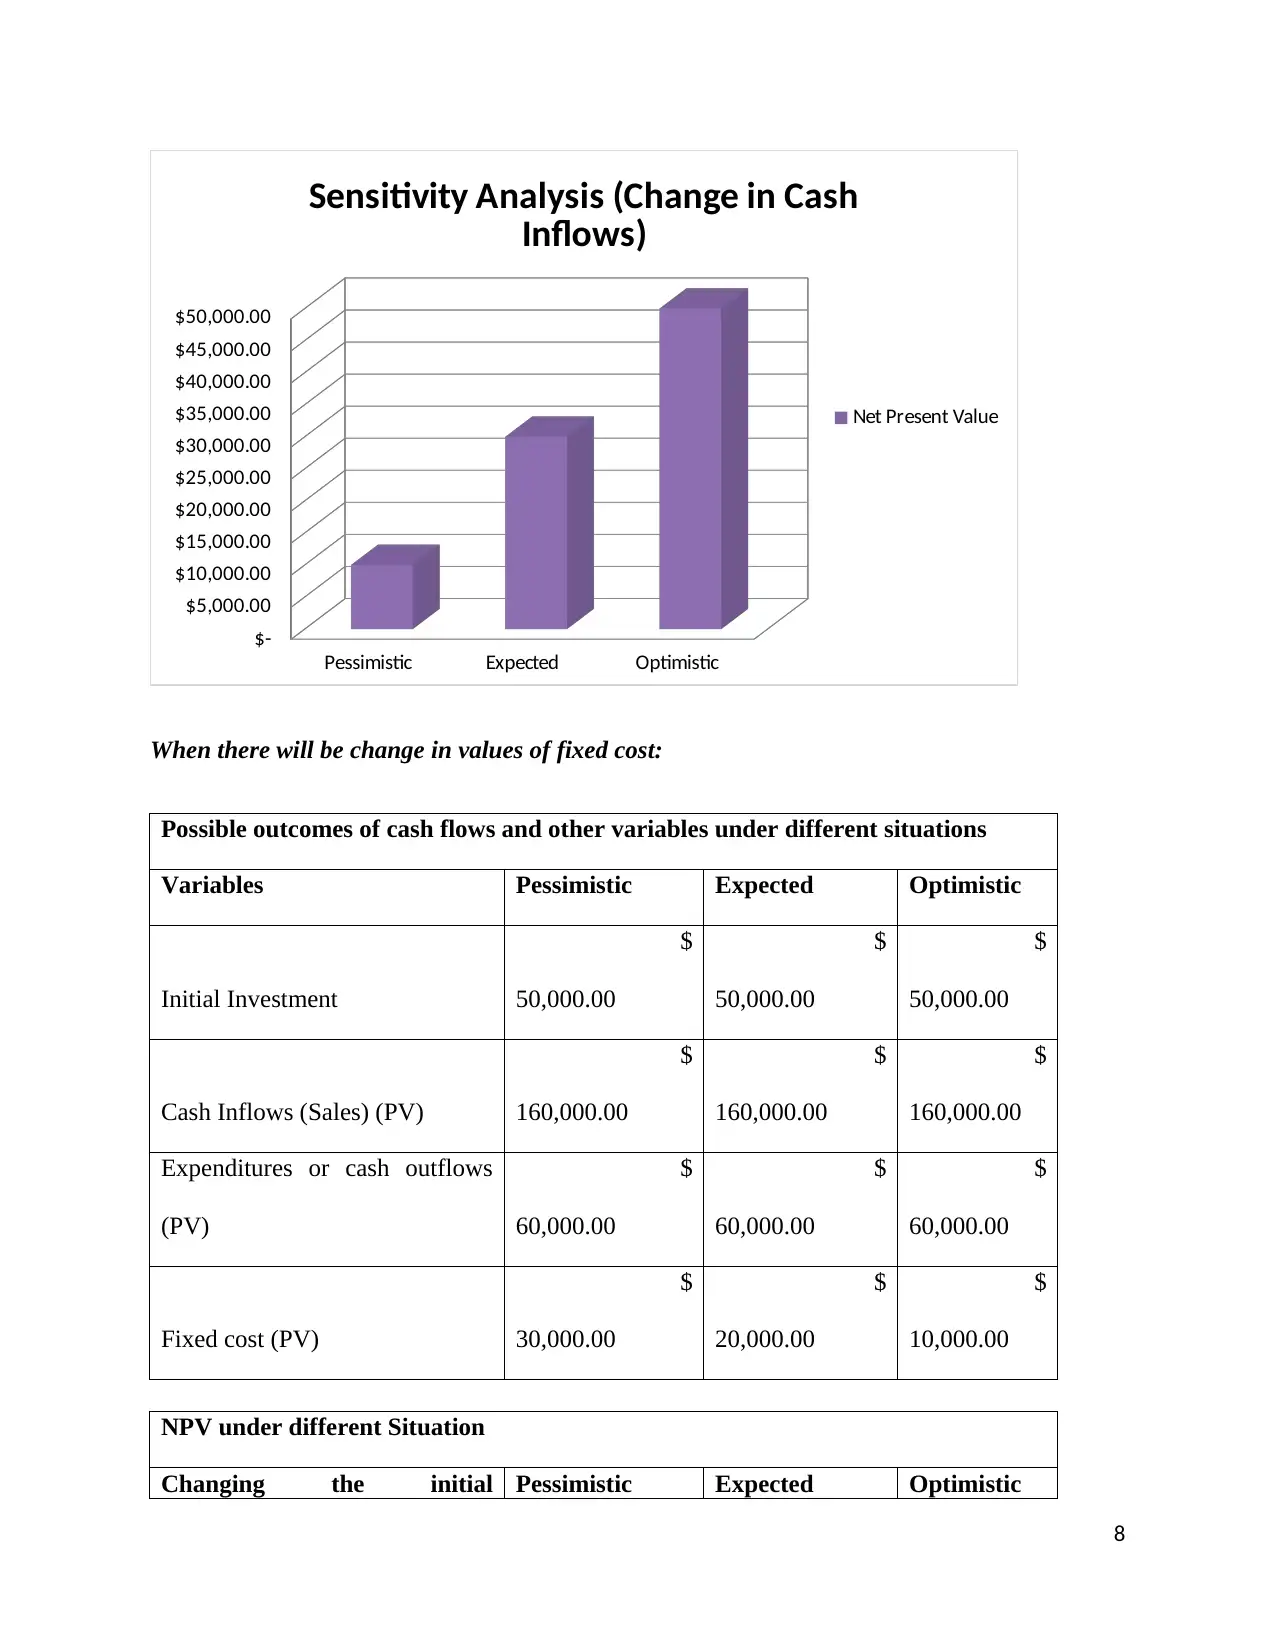
When there will be change in values of fixed cost:
Possible outcomes of cash flows and other variables under different situations
Variables Pessimistic Expected Optimistic
Initial Investment
$
50,000.00
$
50,000.00
$
50,000.00
Cash Inflows (Sales) (PV)
$
160,000.00
$
160,000.00
$
160,000.00
Expenditures or cash outflows
(PV)
$
60,000.00
$
60,000.00
$
60,000.00
Fixed cost (PV)
$
30,000.00
$
20,000.00
$
10,000.00
NPV under different Situation
Changing the initial Pessimistic Expected Optimistic
8
$-
$5,000.00
$10,000.00
$15,000.00
$20,000.00
$25,000.00
$30,000.00
$35,000.00
$40,000.00
$45,000.00
$50,000.00
Sensitivity Analysis (Change in Cash
Inflows)
Net Present Value
When there will be change in values of fixed cost:
Possible outcomes of cash flows and other variables under different situations
Variables Pessimistic Expected Optimistic
Initial Investment
$
50,000.00
$
50,000.00
$
50,000.00
Cash Inflows (Sales) (PV)
$
160,000.00
$
160,000.00
$
160,000.00
Expenditures or cash outflows
(PV)
$
60,000.00
$
60,000.00
$
60,000.00
Fixed cost (PV)
$
30,000.00
$
20,000.00
$
10,000.00
NPV under different Situation
Changing the initial Pessimistic Expected Optimistic
8
investment
Net Present Value
$
20,000.00
$
30,000.00
$
40,000.00
Pessimistic Expected Optimistic
$-
$5,000.00
$10,000.00
$15,000.00
$20,000.00
$25,000.00
$30,000.00
$35,000.00
$40,000.00
Sensitivity Analysis (Change in Fixed Cost)
Net Present Value
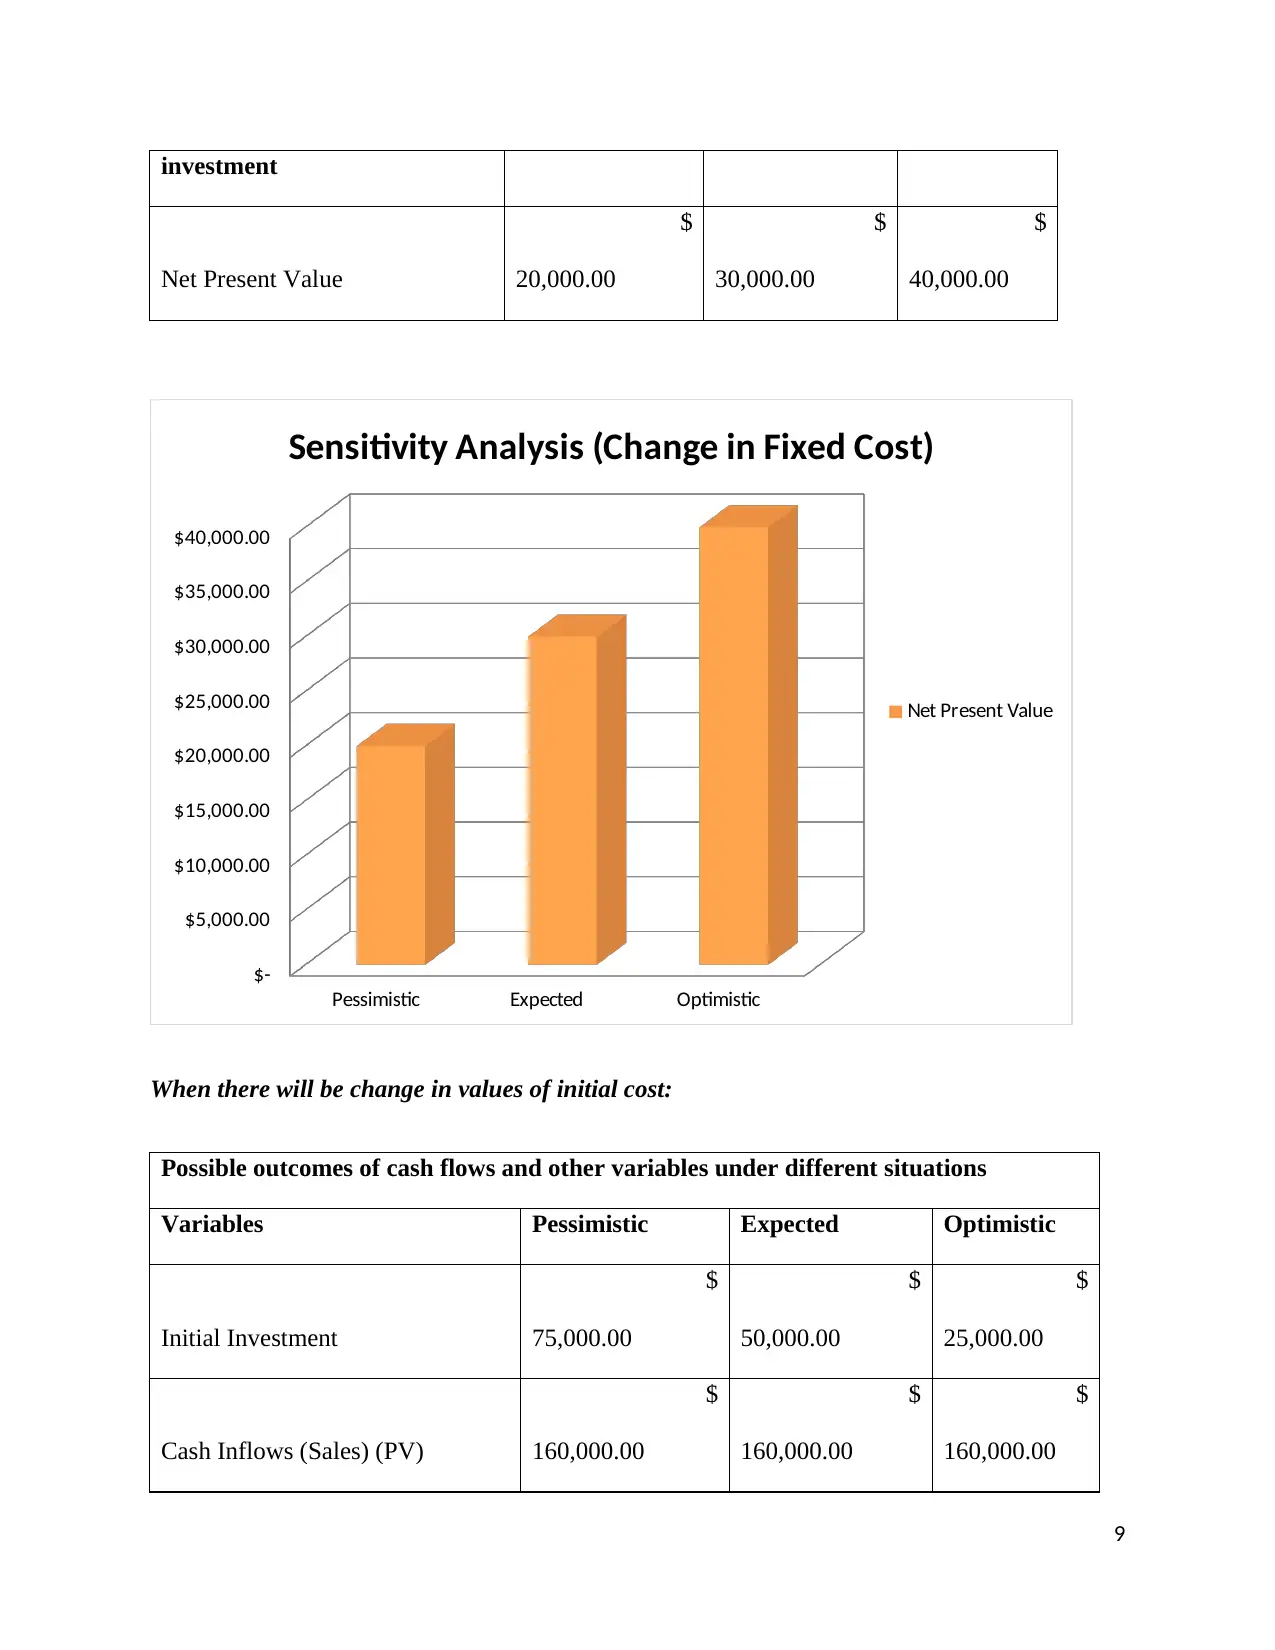
When there will be change in values of initial cost:
Possible outcomes of cash flows and other variables under different situations
Variables Pessimistic Expected Optimistic
Initial Investment
$
75,000.00
$
50,000.00
$
25,000.00
Cash Inflows (Sales) (PV)
$
160,000.00
$
160,000.00
$
160,000.00
9
Net Present Value
$
20,000.00
$
30,000.00
$
40,000.00
Pessimistic Expected Optimistic
$-
$5,000.00
$10,000.00
$15,000.00
$20,000.00
$25,000.00
$30,000.00
$35,000.00
$40,000.00
Sensitivity Analysis (Change in Fixed Cost)
Net Present Value
When there will be change in values of initial cost:
Possible outcomes of cash flows and other variables under different situations
Variables Pessimistic Expected Optimistic
Initial Investment
$
75,000.00
$
50,000.00
$
25,000.00
Cash Inflows (Sales) (PV)
$
160,000.00
$
160,000.00
$
160,000.00
9
⊘ This is a preview!⊘
Do you want full access?
Subscribe today to unlock all pages.
Trusted by 1+ million students worldwide
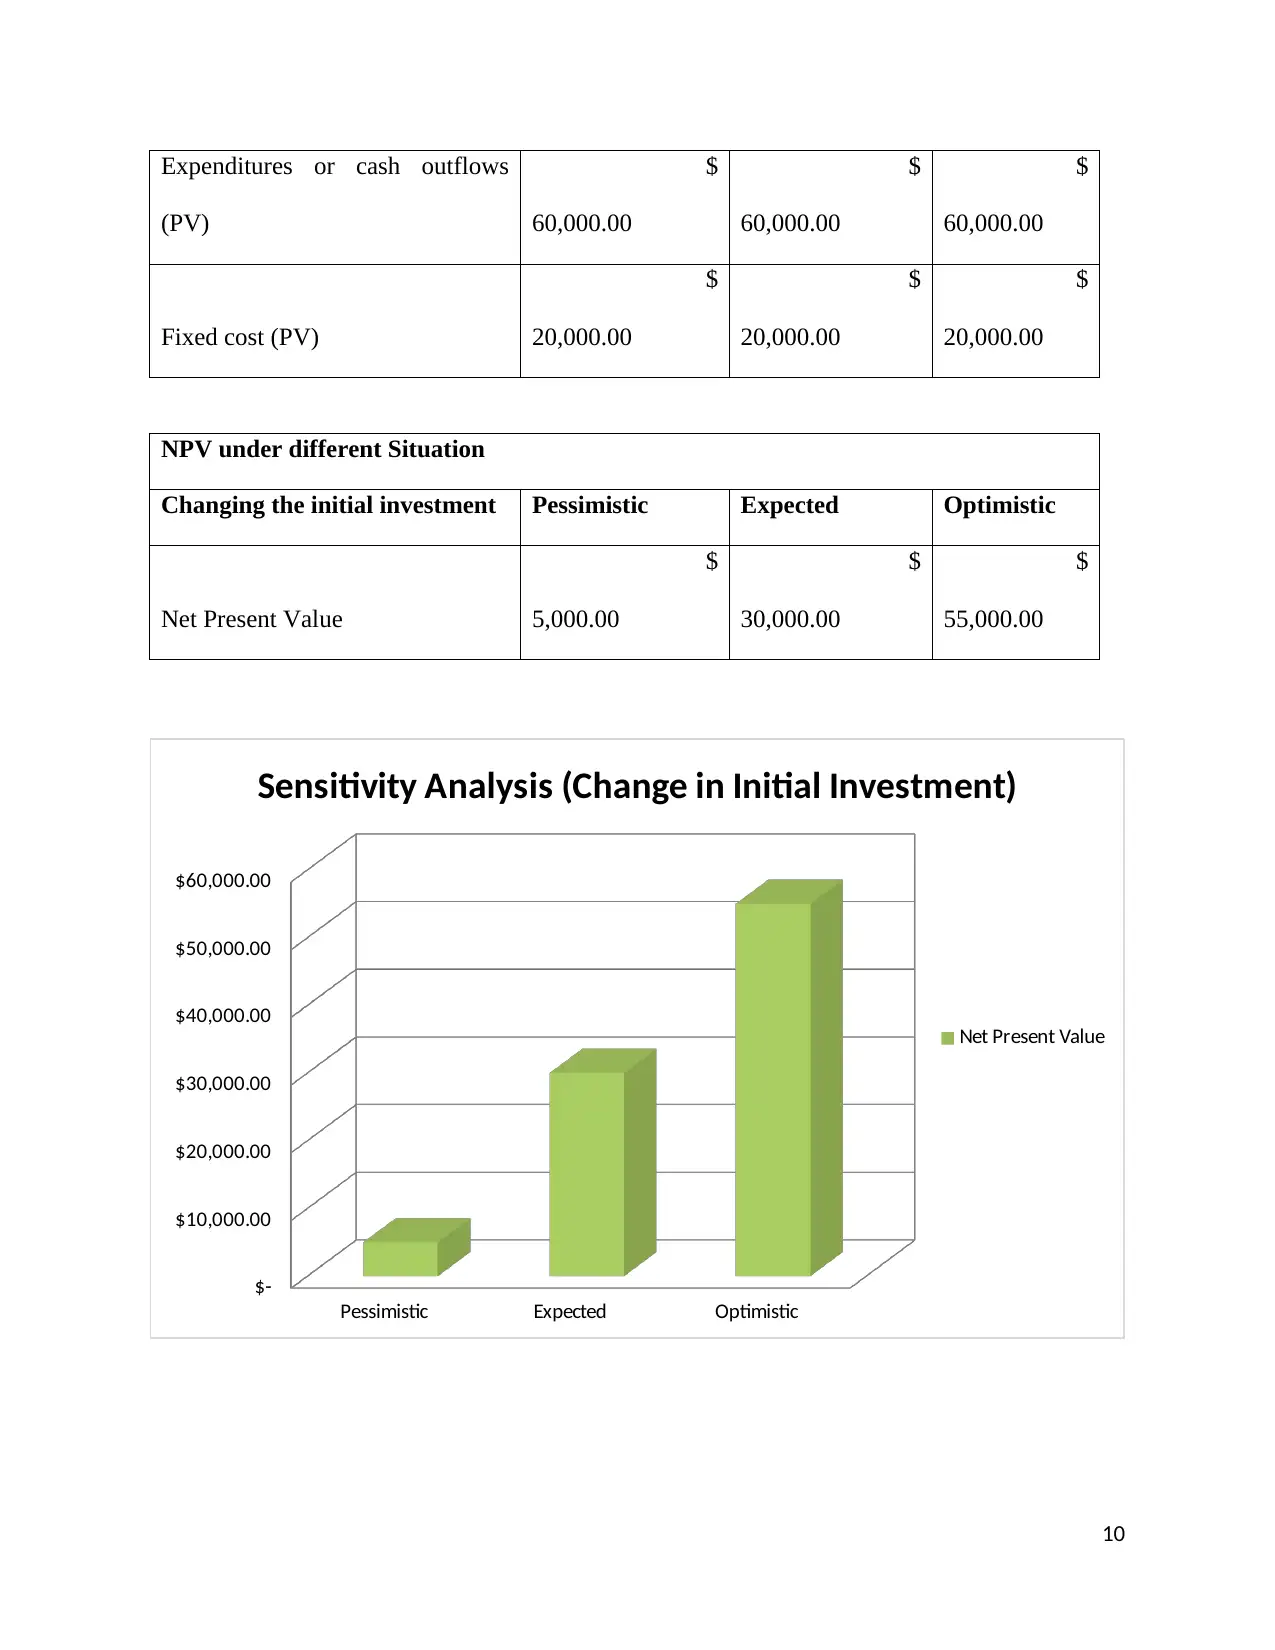
Expenditures or cash outflows
(PV)
$
60,000.00
$
60,000.00
$
60,000.00
Fixed cost (PV)
$
20,000.00
$
20,000.00
$
20,000.00
NPV under different Situation
Changing the initial investment Pessimistic Expected Optimistic
Net Present Value
$
5,000.00
$
30,000.00
$
55,000.00
Pessimistic Expected Optimistic
$-
$10,000.00
$20,000.00
$30,000.00
$40,000.00
$50,000.00
$60,000.00
Sensitivity Analysis (Change in Initial Investment)
Net Present Value
10
Paraphrase This Document
Need a fresh take? Get an instant paraphrase of this document with our AI Paraphraser
As seen above that even a small change in the dependent variable has changed the values
of NPV. So it is concluded that NPV is prone to sensitivity analysis and it is very important to
carry out the sensitivity analysis before selecting the project (Moyer, McGuigan and Rao, 2014).
Scenario analysis
This method of analysis is almost similar to the sensitivity analysis but in this techniques
multiple changes are made together to come with the particular situation. Under this analysis
technique NPV and IRR are put to test under the various situations so that results can be noted in
each and every scenario. The conditions of the organization are not always the same and it
changes according to time or due to any mis-happening with the management. So it is essential
to carry out the scenario analysis of the project so that management prepares them for every
condition. Change in any dependent variable can be decided on the bases of probability of
occurrence of any event. So under this analysis method various situations are created that are
supposed to be occur and they are combined together through their probability of occurrence.
Probability means percentage of most likely occurrence of the particular situation. Estimating the
probability is truly based on the risk bearing capacity of the organization. So it can be said that
estimating the values NPV and IRR under different situation with comparing it estimated risk
and return is referred to as the scenario analysis. Scenario and sensitivity are almost same but
scenario analysis is better estimation of the project as it combines probability of occurrence of
different situation. Cost manager can estimate exact situation under the different types of
scenario and makes the decisions accordingly (Smit, 2007).
Scenario analysis can be easily understood through the example:
11
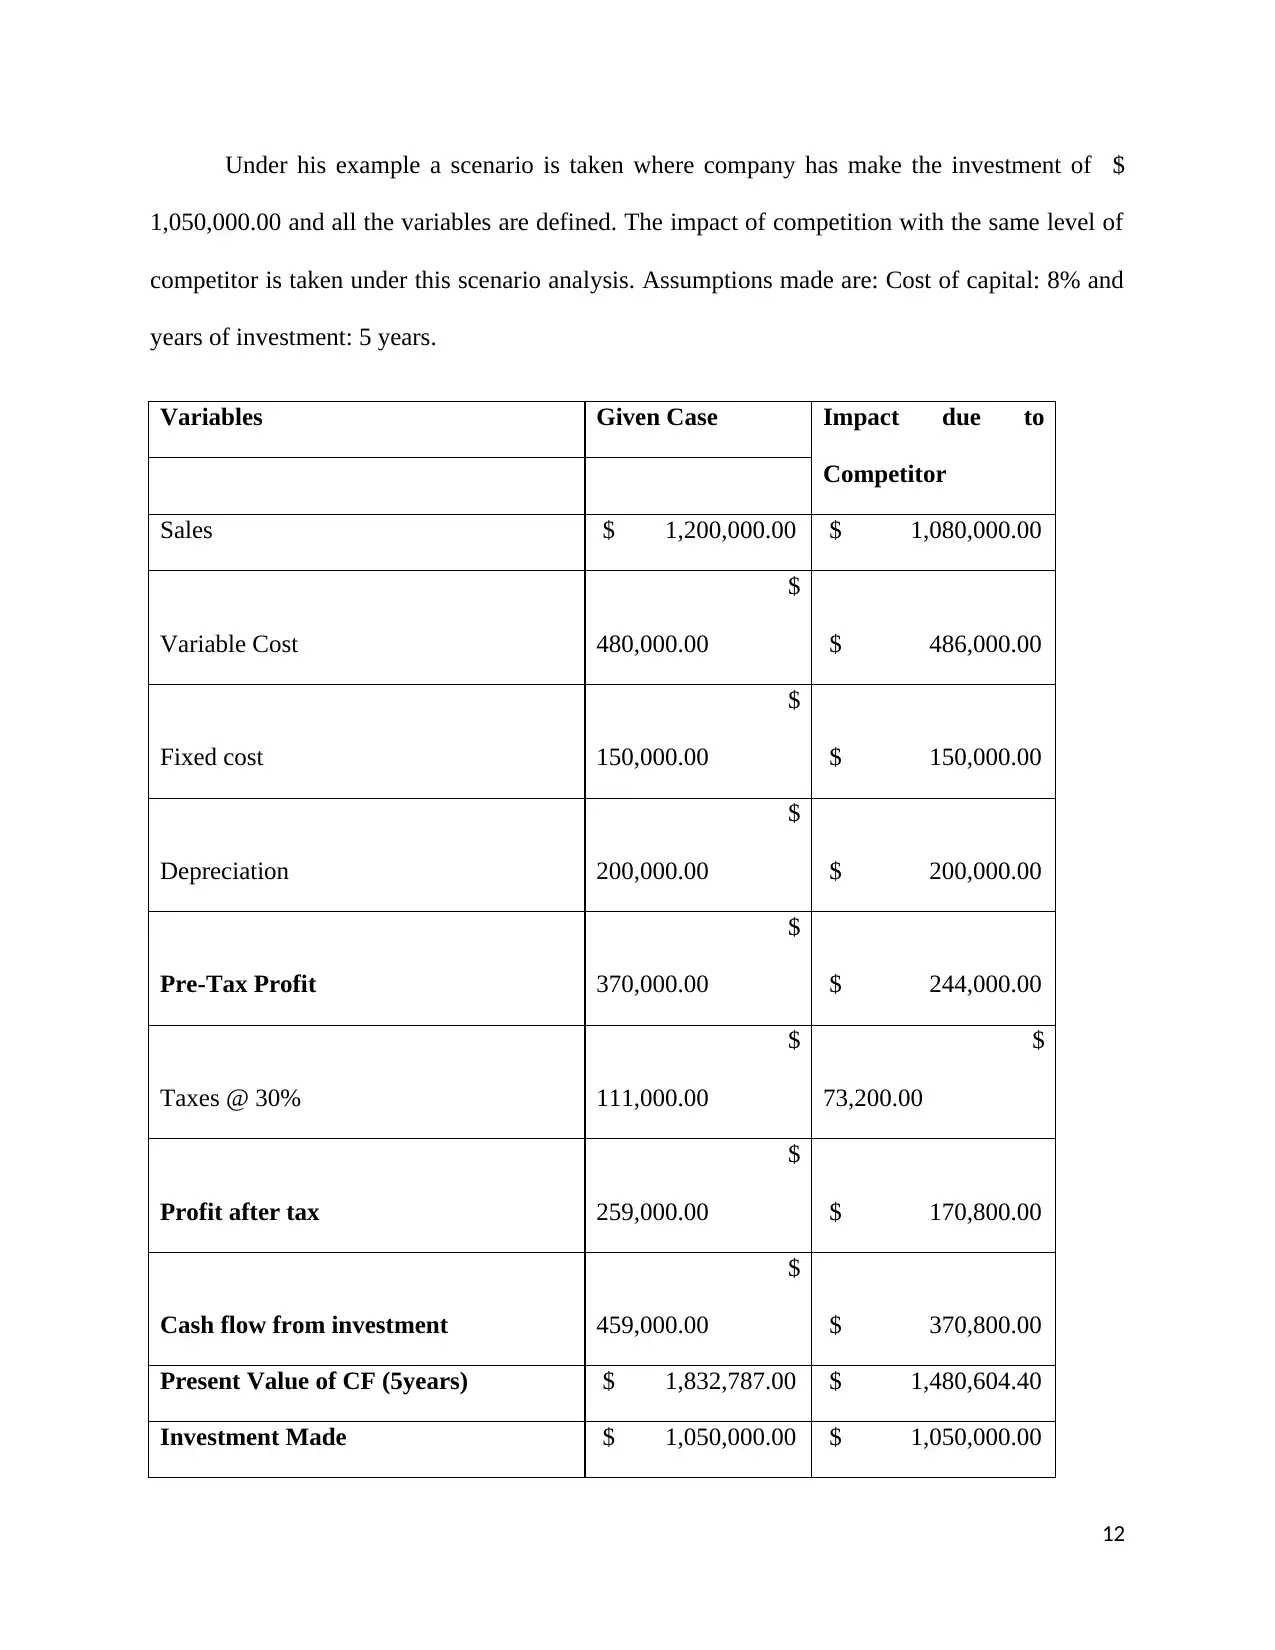
Under his example a scenario is taken where company has make the investment of $
1,050,000.00 and all the variables are defined. The impact of competition with the same level of
competitor is taken under this scenario analysis. Assumptions made are: Cost of capital: 8% and
years of investment: 5 years.
Variables Given Case Impact due to
Competitor
Sales $ 1,200,000.00 $ 1,080,000.00
Variable Cost
$
480,000.00 $ 486,000.00
Fixed cost
$
150,000.00 $ 150,000.00
Depreciation
$
200,000.00 $ 200,000.00
Pre-Tax Profit
$
370,000.00 $ 244,000.00
Taxes @ 30%
$
111,000.00
$
73,200.00
Profit after tax
$
259,000.00 $ 170,800.00
Cash flow from investment
$
459,000.00 $ 370,800.00
Present Value of CF (5years) $ 1,832,787.00 $ 1,480,604.40
Investment Made $ 1,050,000.00 $ 1,050,000.00
12
⊘ This is a preview!⊘
Do you want full access?
Subscribe today to unlock all pages.
Trusted by 1+ million students worldwide
1 out of 14
Related Documents


Your All-in-One AI-Powered Toolkit for Academic Success.
+13062052269
info@desklib.com
Available 24*7 on WhatsApp / Email
![[object Object]](/_next/static/media/star-bottom.7253800d.svg)
Unlock your academic potential
Copyright © 2020–2026 A2Z Services. All Rights Reserved. Developed and managed by ZUCOL.