Capital Budgeting: Techniques for Investment Decision-Making
VerifiedAdded on 2020/02/19
|8
|2342
|629
Report
AI Summary
This report provides a comprehensive overview of capital budgeting, a crucial financial planning technique used to evaluate expenditures and investments. It delves into the significance of capital budgeting in financial decision-making, risk evaluation, and long-term company existence. The report explains the importance of capital budgeting and its methods, including Net Present Value (NPV) and Internal Rate of Return (IRR), with illustrative examples. Furthermore, it explores various techniques like Sensitivity Analysis, Scenario Analysis, Breakeven Analysis, and Simulation Analysis, offering insights into their applications and benefits. The report also highlights the limitations of capital budgeting, emphasizing the dynamic nature of markets and the potential for inaccurate investment decisions. Overall, it serves as a valuable resource for understanding and applying capital budgeting principles in investment appraisal and financial management.

CAPITAL BUDGETING
Paraphrase This Document
Need a fresh take? Get an instant paraphrase of this document with our AI Paraphraser
CAPITAL BUDGETING-
The power of decision making lies in the hand of the management. Any decision whether
related to a petty thing or a major thing has its own significance. The management of the
company is held responsible for the wrong decisions as it has a direct impact on the
performance of the company. Apart from the financial performance it may also harm the
reputation of the company making it difficult to survive in the long run. There are huge
number of alternatives available for a set of actions but is is important for the company to
choose the best action in order to get the best result.
Decisions are to be taken at every level of the organisation i.e. at the top level and even at the
bottom level. Decision making is considered a very complex task but it is equally important
to bring into action the decision taken by the management. The decision taken by the
management can be implemented only when there is a cordial relation between the
employees of the company. In order to take decisions relating to the financial planning of the
company, the capital budgeting is adopted by the management.
Capital budgeting is a wide term which helps in evaluating the expenditures and investment
of the company that are huge in amount. The example that can be used to explain expenditure
and investment are manufacturing a new plant and machinery or investing funds in some kind
of long term instrument. This techniques takes into consideration the cash outflow at present
along with the future cash inflows and to check whether the company would be able to earn
the required rate of return. This can be also known as the investment appraisal method.
There is a huge importance of Capital budgeting. Few of them are-
Risk evaluation- Making any type of investment whether long term or short term
involve different types of risk, so before investing the funds the risk should be
identified and evaluated which can be done through capital budgeting.
Decision making- A company should not keep the funds idle, it should invest it in a
proper place where it is safe and also helps in earning a good return. However, the
funds available with the company are limited and hence it should be invested
intelligently after proper analysis. Capital budgeting helps to take decision whether it
is prudent to invest at that place or not.
Long existence- A company can exist in the longrun when the company is able to
control cost and maximise its profits. A proper analysis and planning is required by
the company in order to let the company exist in the long run.
The limitations of capital budgeting are-
Markets are dynamic so there is a possibility that the decision of investment may
sometimes be wrong which may affect the budget and the capital of the company.
A decision that is taken may earn huge interest but there is also a chance of the
investment defaulting.
Decision through capital budgeting is taken for long term. However, if short term
decisions are taken through capital budgeting it my have negative impacts on the
company.
As we said that Capital budgeting is a wide term there are various methods that are involved
in it. Few of them are Discounted cash flows analysis, Net present value, Internal rate of
return and discounted payback period. However, the two most important are the net present
values and IRR method which has been explained with examples below:
1. NPV- Net present value is calculated by deducting the amount of cash outflows from
the amount of cash inflows. It is easier to understand through this formula that this
method is used in capital budgeting to know if there will be profits or not and if there
are profits then how much. A positive NPV is considered favourable whereas the
negative cash flows is considered unfavourable.
2. IRR- The internal rate of return is used to determine whether the investment in
which the company is thinking of investing is attractive enough or not. The case when
the net present values of all the cash flows is zero, then the interest rate is known as
IRR. It is favourable when the IRR is greater to the required rate of return and it is
considered unfavourable when the IRR is less when compared to the required rate of
return.
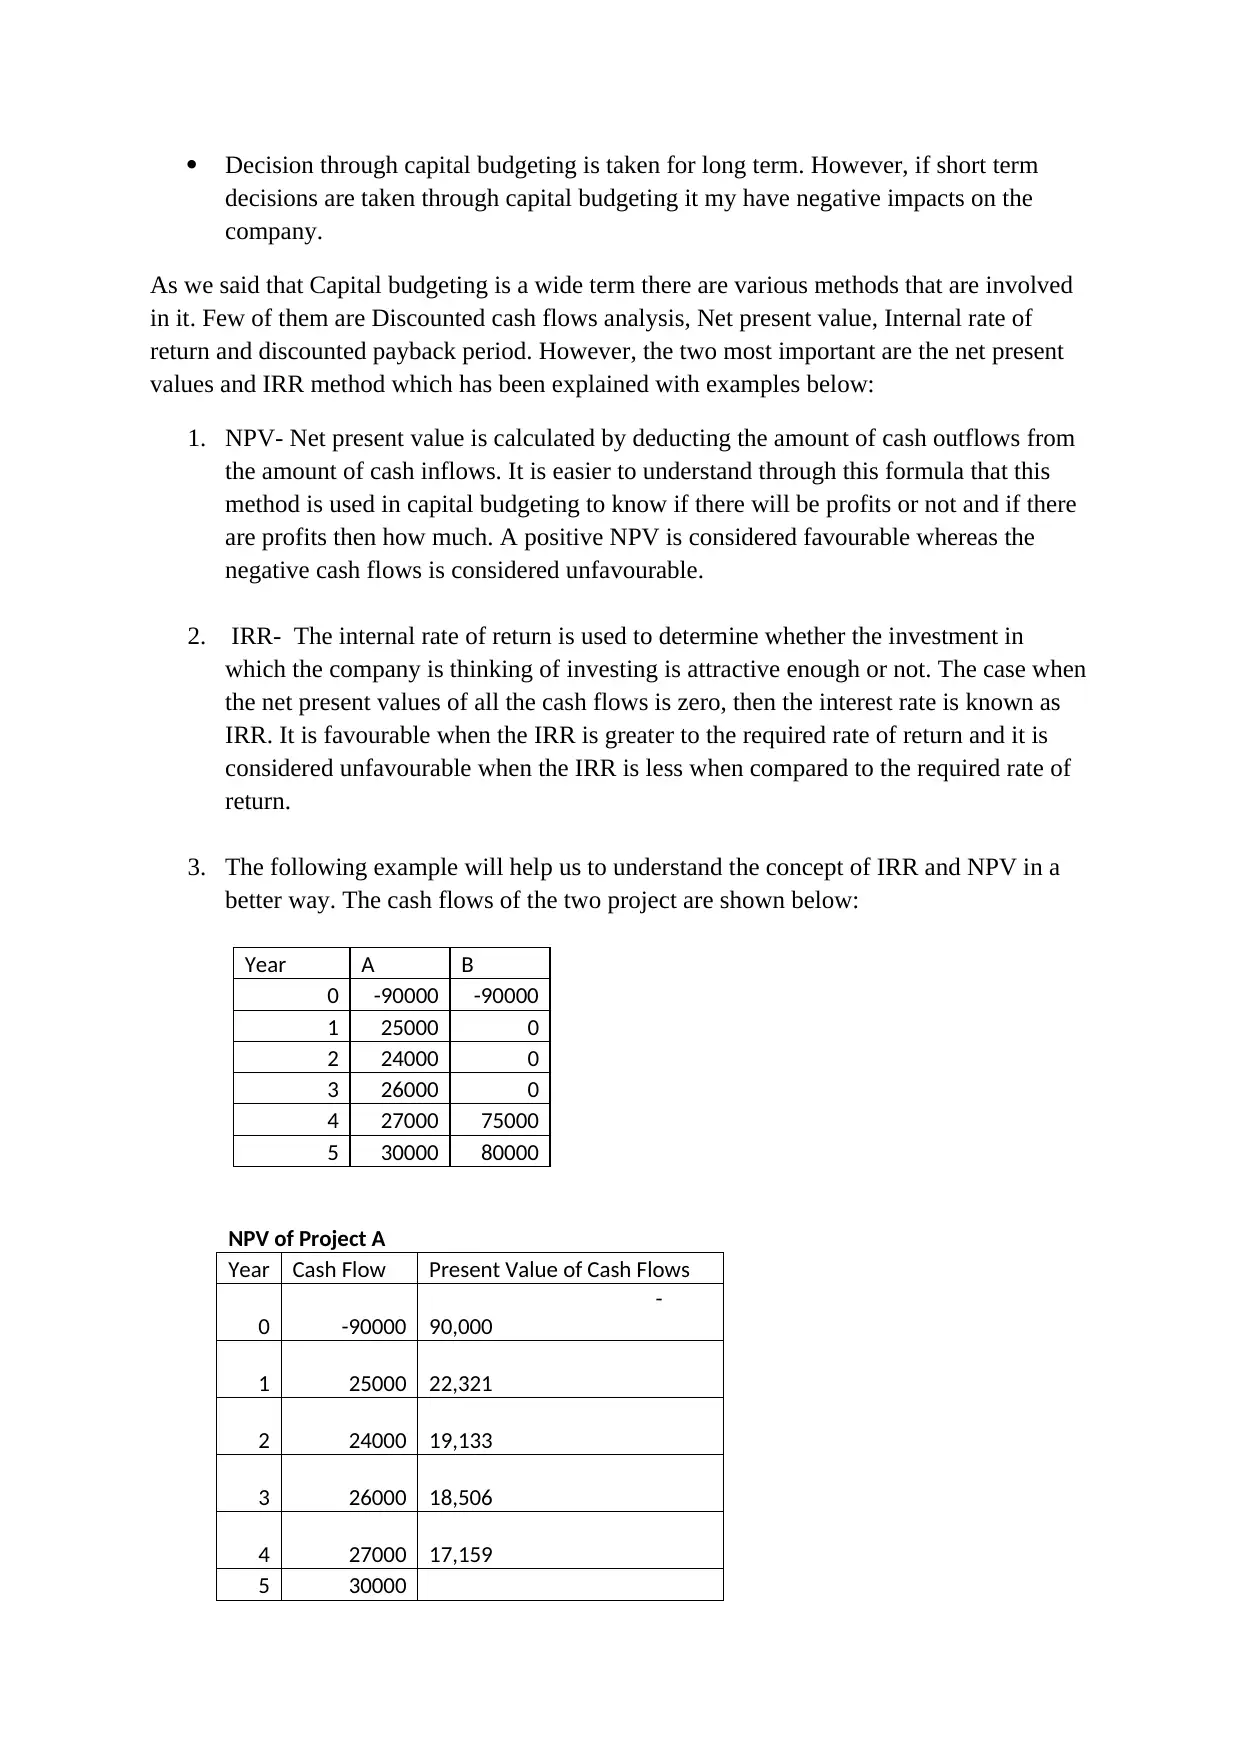
3. The following example will help us to understand the concept of IRR and NPV in a
better way. The cash flows of the two project are shown below:
NPV of Project A
Year Cash Flow Present Value of Cash Flows
0 -90000
-
90,000
1 25000 22,321
2 24000 19,133
3 26000 18,506
4 27000 17,159
5 30000
Year A B
0 -90000 -90000
1 25000 0
2 24000 0
3 26000 0
4 27000 75000
5 30000 80000
decisions are taken through capital budgeting it my have negative impacts on the
company.
As we said that Capital budgeting is a wide term there are various methods that are involved
in it. Few of them are Discounted cash flows analysis, Net present value, Internal rate of
return and discounted payback period. However, the two most important are the net present
values and IRR method which has been explained with examples below:
1. NPV- Net present value is calculated by deducting the amount of cash outflows from
the amount of cash inflows. It is easier to understand through this formula that this
method is used in capital budgeting to know if there will be profits or not and if there
are profits then how much. A positive NPV is considered favourable whereas the
negative cash flows is considered unfavourable.
2. IRR- The internal rate of return is used to determine whether the investment in
which the company is thinking of investing is attractive enough or not. The case when
the net present values of all the cash flows is zero, then the interest rate is known as
IRR. It is favourable when the IRR is greater to the required rate of return and it is
considered unfavourable when the IRR is less when compared to the required rate of
return.
3. The following example will help us to understand the concept of IRR and NPV in a
better way. The cash flows of the two project are shown below:
NPV of Project A
Year Cash Flow Present Value of Cash Flows
0 -90000
-
90,000
1 25000 22,321
2 24000 19,133
3 26000 18,506
4 27000 17,159
5 30000
Year A B
0 -90000 -90000
1 25000 0
2 24000 0
3 26000 0
4 27000 75000
5 30000 80000
⊘ This is a preview!⊘
Do you want full access?
Subscribe today to unlock all pages.
Trusted by 1+ million students worldwide
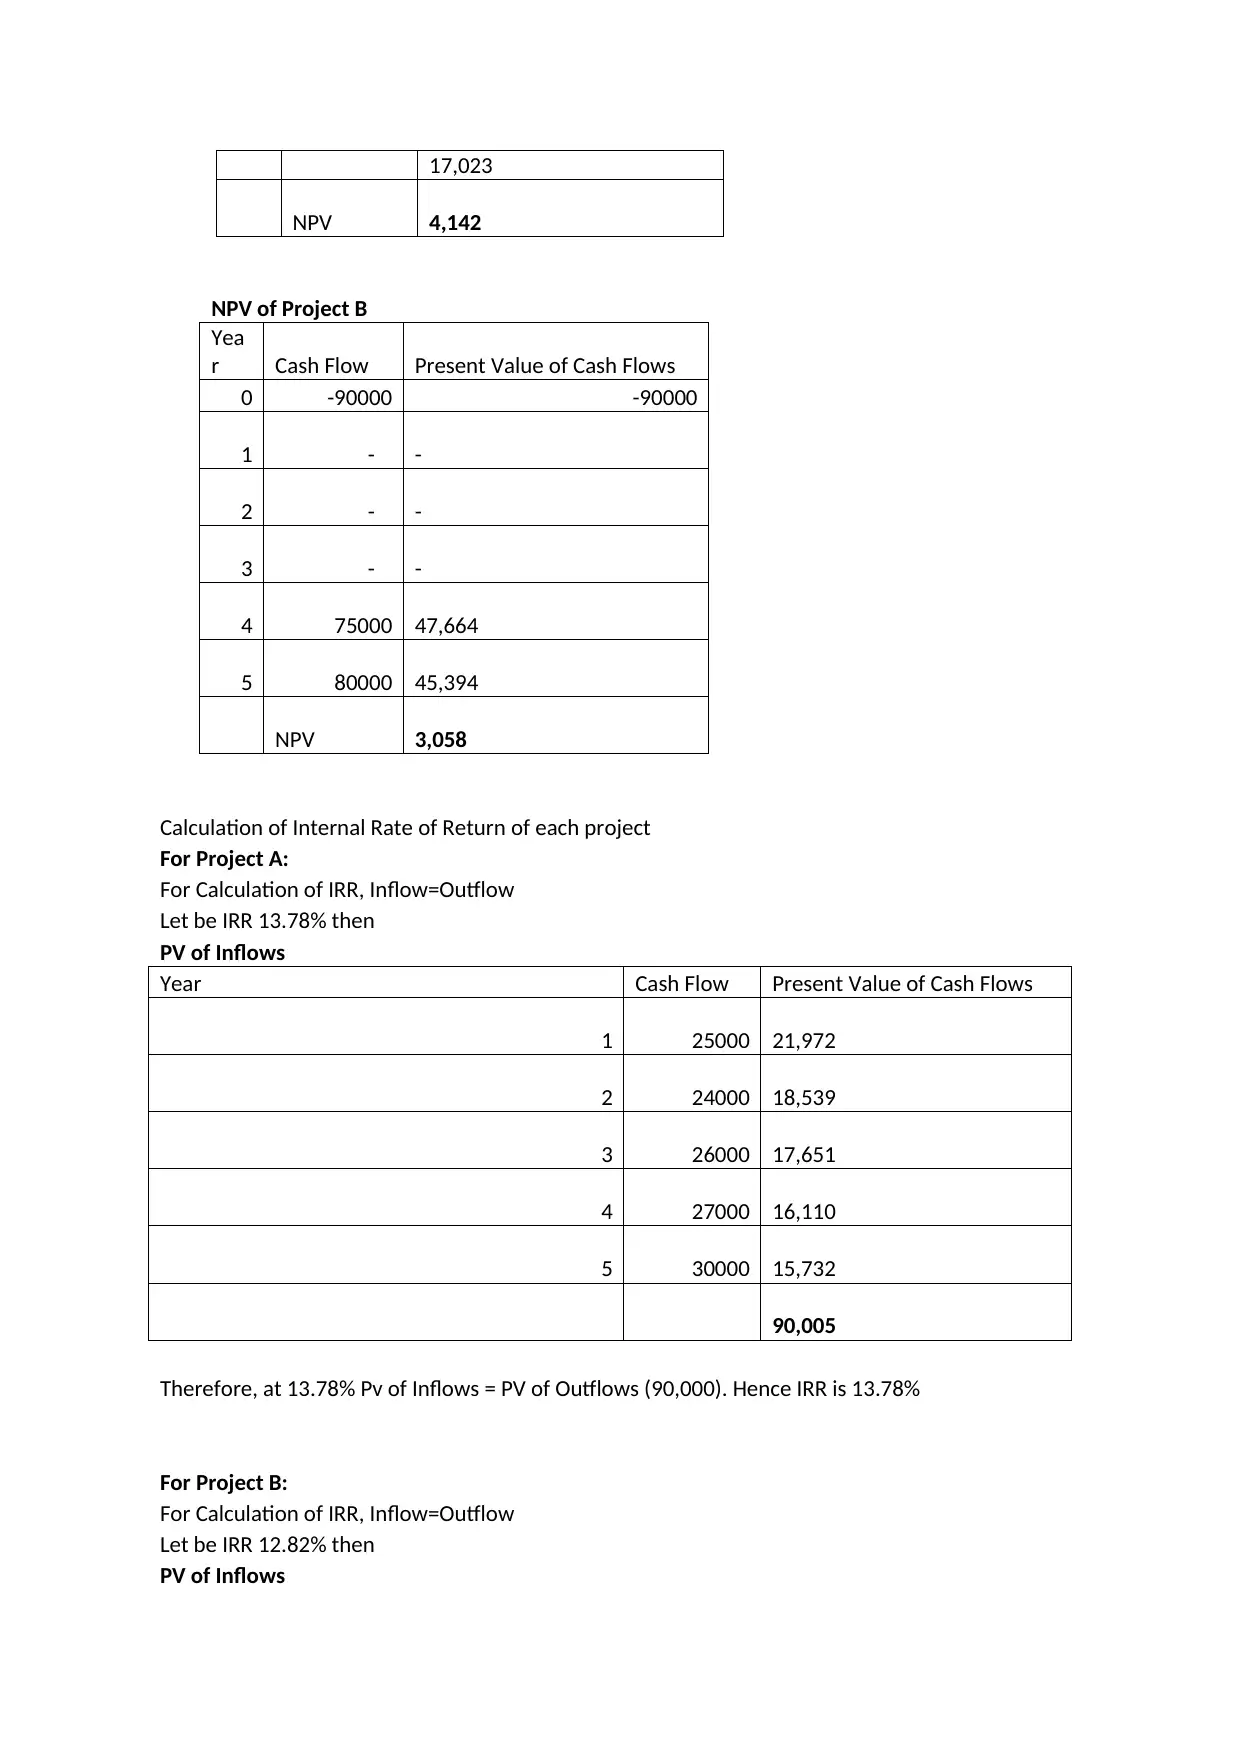
17,023
NPV 4,142
NPV of Project B
Yea
r Cash Flow Present Value of Cash Flows
0 -90000 -90000
1 - -
2 - -
3 - -
4 75000 47,664
5 80000 45,394
NPV 3,058
Calculation of Internal Rate of Return of each project
For Project A:
For Calculation of IRR, Inflow=Outflow
Let be IRR 13.78% then
PV of Inflows
Year Cash Flow Present Value of Cash Flows
1 25000 21,972
2 24000 18,539
3 26000 17,651
4 27000 16,110
5 30000 15,732
90,005
Therefore, at 13.78% Pv of Inflows = PV of Outflows (90,000). Hence IRR is 13.78%
For Project B:
For Calculation of IRR, Inflow=Outflow
Let be IRR 12.82% then
PV of Inflows
Paraphrase This Document
Need a fresh take? Get an instant paraphrase of this document with our AI Paraphraser
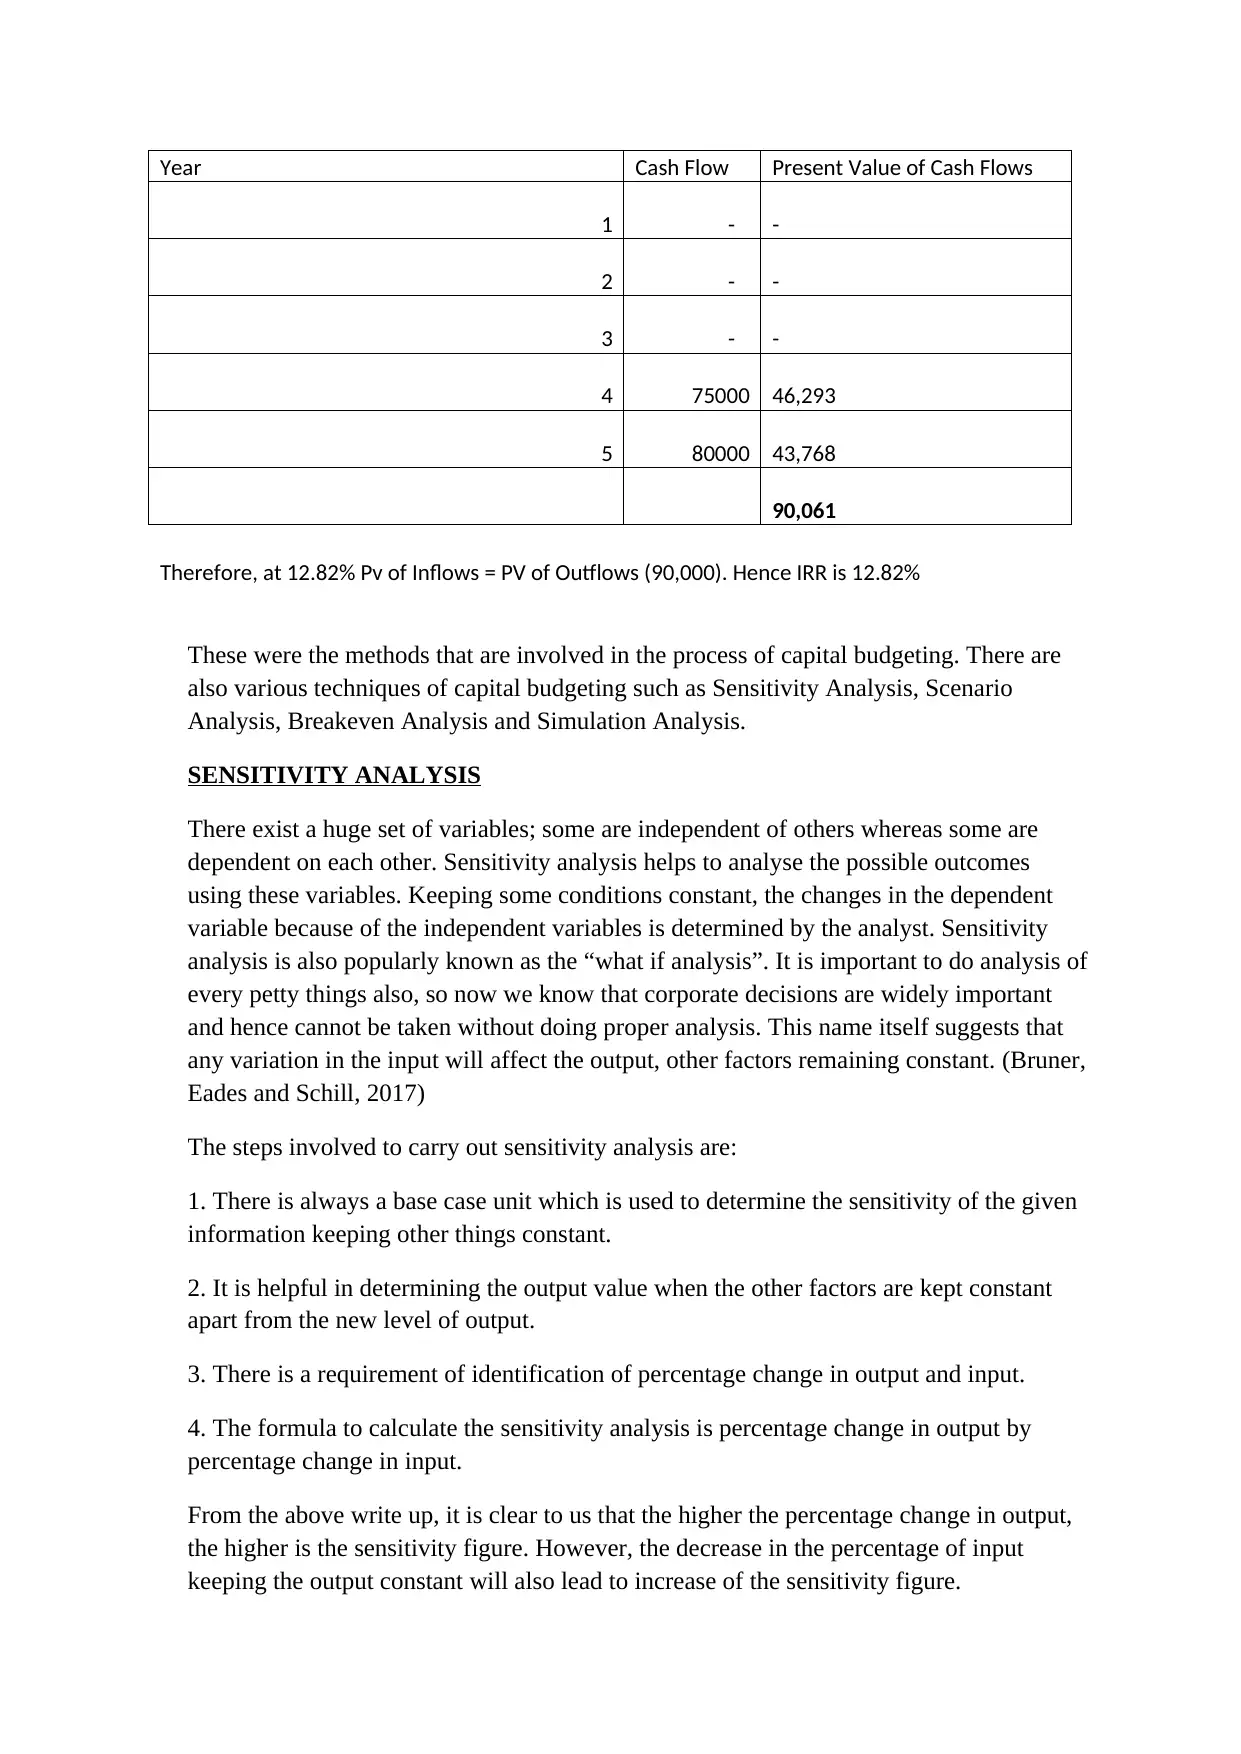
Year Cash Flow Present Value of Cash Flows
1 - -
2 - -
3 - -
4 75000 46,293
5 80000 43,768
90,061
Therefore, at 12.82% Pv of Inflows = PV of Outflows (90,000). Hence IRR is 12.82%
These were the methods that are involved in the process of capital budgeting. There are
also various techniques of capital budgeting such as Sensitivity Analysis, Scenario
Analysis, Breakeven Analysis and Simulation Analysis.
SENSITIVITY ANALYSIS
There exist a huge set of variables; some are independent of others whereas some are
dependent on each other. Sensitivity analysis helps to analyse the possible outcomes
using these variables. Keeping some conditions constant, the changes in the dependent
variable because of the independent variables is determined by the analyst. Sensitivity
analysis is also popularly known as the “what if analysis”. It is important to do analysis of
every petty things also, so now we know that corporate decisions are widely important
and hence cannot be taken without doing proper analysis. This name itself suggests that
any variation in the input will affect the output, other factors remaining constant. (Bruner,
Eades and Schill, 2017)
The steps involved to carry out sensitivity analysis are:
1. There is always a base case unit which is used to determine the sensitivity of the given
information keeping other things constant.
2. It is helpful in determining the output value when the other factors are kept constant
apart from the new level of output.
3. There is a requirement of identification of percentage change in output and input.
4. The formula to calculate the sensitivity analysis is percentage change in output by
percentage change in input.
From the above write up, it is clear to us that the higher the percentage change in output,
the higher is the sensitivity figure. However, the decrease in the percentage of input
keeping the output constant will also lead to increase of the sensitivity figure.
SCENARIO ANALYSIS
Scenario analysis helps to determine the “expected value” that an investment is going to
give after a fixed period of time when there are certain factors that may change such as
the interest rate. It is the work of an analyst to determine the expected values of various
investments at different rates and suggest his client the best investment alternative.
Market is dynamic in nature and therefore the return on the portfolio keeps on changing
from time to time so this analysis helps to determine the extent of the changes. The
investment may be volatile in nature I.e. there may be high risk or low risk. This analysis
is helpful in determining the level of risk a person or a company is ready to undertake.
The level of risk is determined by calculating the standard deviation as it is considered the
variable used to determine risk. However, the expected returns are calculated using the
mean of the variables. The certainty of the changes related to the portfolio may be
calculated using this analysis. There may be confusion between the sensitivity analysis
and the scenario analysis, it is important to know that they are different from each other.
The example that can be used to understand the difference is – Suppose there is analyst
who wants to analyse his client’s portfolio through both the techniques in order to know
the effect it would have on the earning per share of the company by using the profit
earning ratio. As we know that, the variables affect the valuation in the case of sensitivity
analysis. It helps the analyst to know all the possible outcomes that can possibly occur.
But in the case of scenario analysis the outcomes are dependent on various factors of the
market. There may be any change in the laws of the country or poor performance of the
economy that may have an adverse effect on the portfolio. Therefore, we can say that in
scenario analysis the external factors come into play. Both the techniques together gives
the view of all range of results in the presence of various factors when there are different
units of input (Phillips, 2014).
BREAKEVEN ANALYSIS
It is the priority of every company to recover its cost first and then to earn profits. The
situation when the company has no profit or loss is said to be the breakeven point for the
company. The lower the breakeven point the better it is for the company as the company
can earn profits earlier. In the financial terms, the net income of the company will be
zero. There is sometimes confusion between the payback point and the breakeven point
but these two are completely different concepts. Payback period is the duration which is
required to pay back the initial investment whereas breakeven point is not considered for
time but for volume of sales or units (Fairhurst, 2015).
The breakeven analysis can be subdivided into two categories:
1. Accounting breakeven analysis. - The accounting equation for the breakeven point is,
Total Revenue= Total cost. It can be calculated in terms of volume of sales or in terms
of units. The formula for breakeven point is-
BEP = (Fixed Cost + Depreciation) /Contribution Margin Ratio.
⊘ This is a preview!⊘
Do you want full access?
Subscribe today to unlock all pages.
Trusted by 1+ million students worldwide
If the depreciation is excluded from the breakeven point then it is known as cash
breakeven point. We can observe that only the investment value is recovered from the
project and there will be zero returns (Hassani, 2016).
2. Financial breakeven analysis. – Financial breakeven analysis is the point when the
NPV is Zero, in such a case the cash flow is equal to the initial investment.
SIMULATION ANALYSIS
Simulation analysis means imitating of some actions or pretending something. This analysis
is carried out to find out the probability and interaction between the different variables of the
group. This analysis is considered as a part of capital budgeting as it is a part that is important
to take investment decisions (Khan and Jain, 2014). There are also various limitations of this
analysis as ignoring the relationship between various variables can provide us with wrong
information.
The steps involved in the simulation analysis are:
1. Identification of certain variables that directly or indirectly affect the cash flows.
2. Formula for th simulation analysis is stated along with the probability distribution of the
variables (Palepu, Healy and Peek, 2016).
3. The distribution is considered as a sample and any one variable is selected randomly by the
computer programme, the NPV of the project can be determined in this step.
4. It is observed that there is not a single value as an outcome but there is a probability
distribution as a result that shows various possible expected returns.
Paraphrase This Document
Need a fresh take? Get an instant paraphrase of this document with our AI Paraphraser

References:
Bruner, R., Eades, K. and Schill, M. (2017). Case studies in finance. Dubuque, IA: McGraw-
Hill Education.
Fairhurst, D. (2015). Using Excel for Business Analysis A Guide to Financial Modelling
Fundamenta. John Wiley & Sons.
Hassani, B. (2016). Scenario analysis in risk management. Cham: Springer International
Publishing.
Khan, M. and Jain, P. (2014). Financial management. New Delhi: McGraw Hill Education.
Palepu, K., Healy, P. and Peek, E. (2016). Business analysis and valuation. Andover,
Hampshire, United Kingdom: Cengage Learning EMEA.
Phillips, J. (2014). Capm / pmp. New York: McGraw Hill.
1 out of 8
Related Documents


Your All-in-One AI-Powered Toolkit for Academic Success.
+13062052269
info@desklib.com
Available 24*7 on WhatsApp / Email
![[object Object]](/_next/static/media/star-bottom.7253800d.svg)
Unlock your academic potential
Copyright © 2020–2026 A2Z Services. All Rights Reserved. Developed and managed by ZUCOL.