Capital Budgeting Analysis: Finance Report, Methods and Analysis

Verified

Added on  2022/10/19

|9
|2195
|40
Report
AI Summary
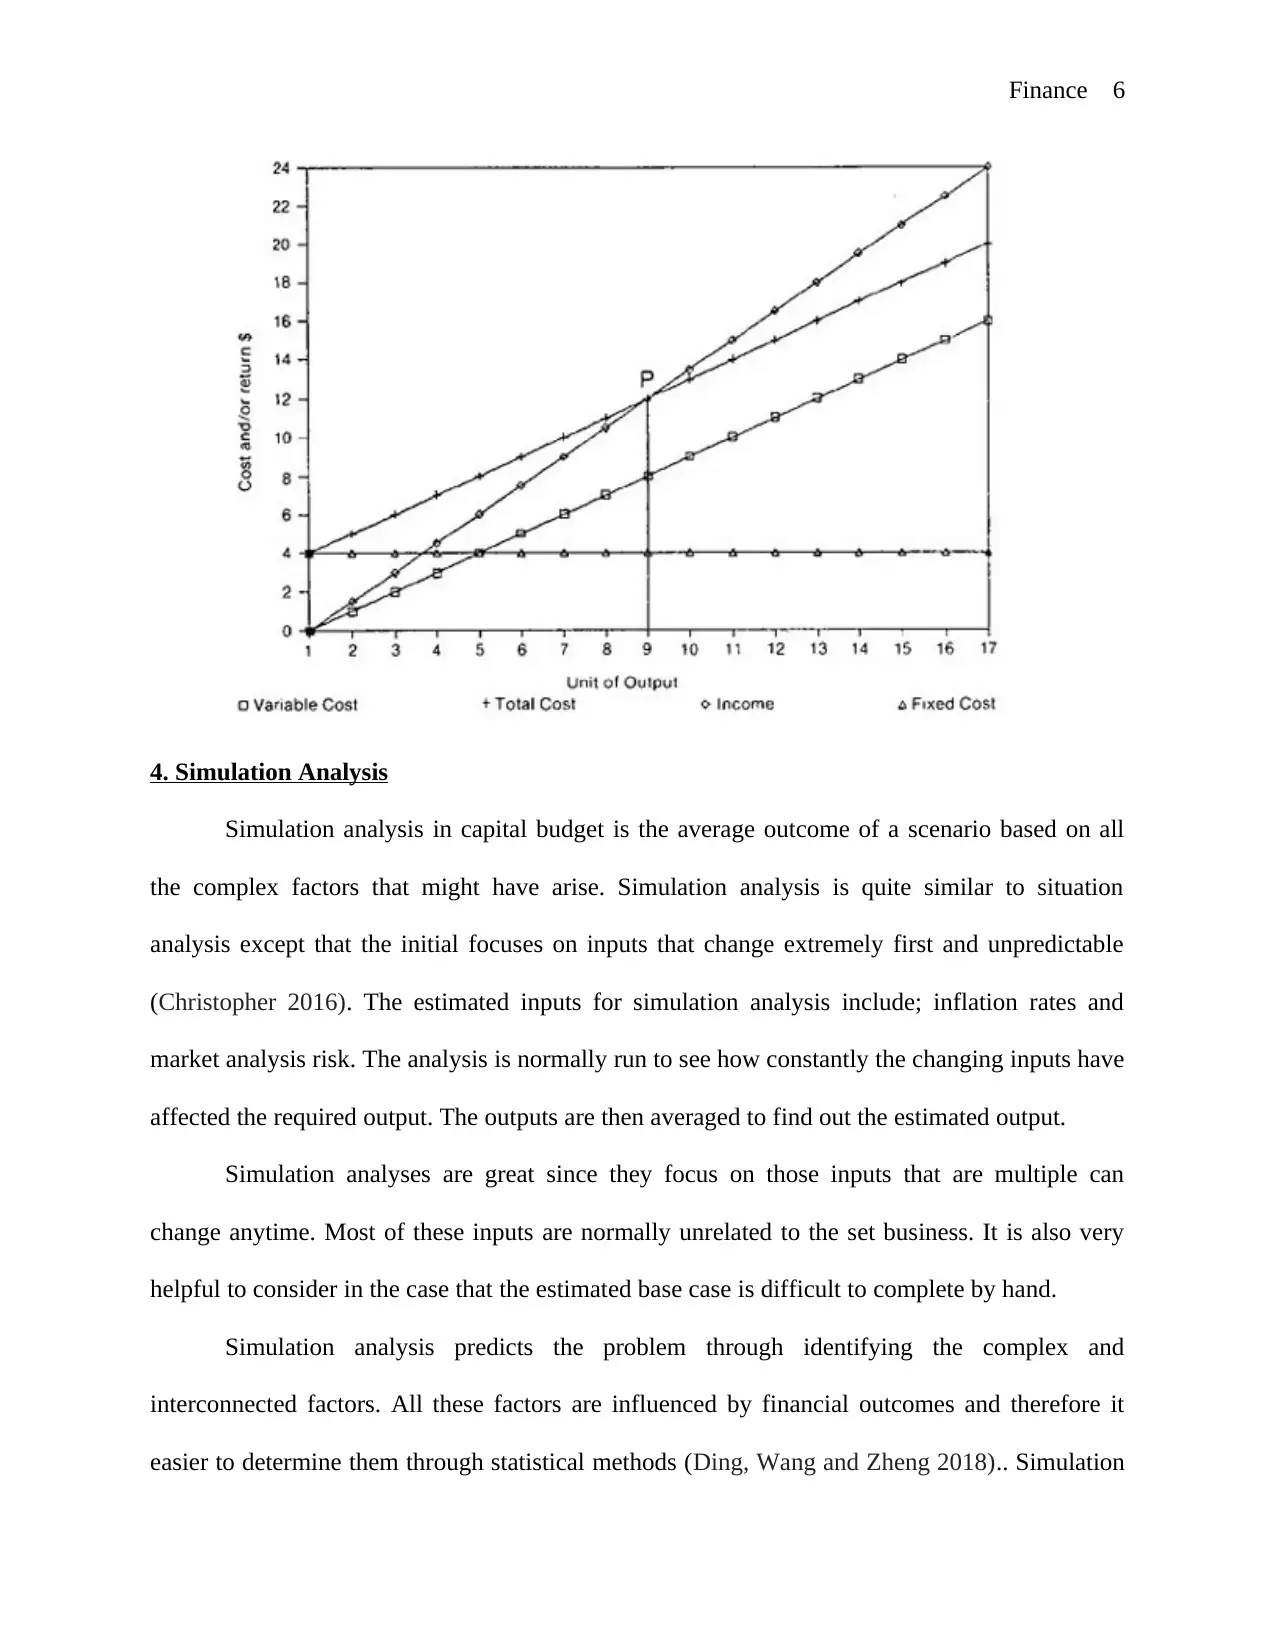
This finance report provides a comprehensive analysis of capital budgeting techniques. It begins by defining and explaining sensitivity analysis, detailing how it's used to predict share and bond prices and determine investor returns. The report then explores scenario analysis, contrasting it with sensitivity analysis and explaining how it's used to create base, best-case, and worst-case scenarios for investment decisions. Next, the report delves into breakeven point analysis, explaining its role in determining when an investment yields a positive return, including graphical representations. Finally, it examines simulation analysis, detailing its use in predicting outcomes based on complex and changing factors, including inflation rates and market risks. The report highlights the importance of these methods in predicting commercial occurrences and making informed financial decisions, emphasizing the uncertainties inherent in capital budgeting.
Document Page
Finance 1
FINANCE
By (Student’s Name)
Professor’s Name
College
Course
Date
tabler-icon-diamond-filled.svg

Paraphrase This Document

Need a fresh take? Get an instant paraphrase of this document with our AI Paraphraser
Document Page
Finance 2
FINANCE
1. Sensitivity Analysis
Sensitivity analysis, by definition, establishes how various values of a predictor variable
influences another explained variable within a specific circumstances over a range of
assumptions (Iooss and Lemaître 2015). Normally, this technique is utilized within definite limits
that hinge on a single or many inputs as factors. Sensitivity analysis has been used in many fields
including economics, finance and auditing. However, in this paper we shall focus on how
sensitivity analysis is used within a capital budget by an organization.
To begin with, sensitivity analysis in capital budgeting can also be used to make
predictions about share prices in the future and this is why it is the most preferred method
(Pianosi and Wagener 2015). Additionally, since share prices affect bond prices most public
trade companies prefer the use of sensitivity analysis in capital budgeting to help in predicting
the future.
Sensitivity analysis works in the following manner as per the capital budget. The target
input in this case is usually the share prices of the public company. The analysis is, therefore,
supposed to determine how the affected changes in the input variables are determined. It is more
of predicting an outcome of a budget decision when the company has been given a certain range
of variables. With the creation of variable the capital budget analyst can create the different
affected outcomes.
In capital budget the main variable are share prices as mentioned earlier. Some of the
variables that are used to conduct sensitivity analysis include; company earnings, the number of
outstanding shares, the debt to equity ratios and the total number of competitor in the industry
(Vu-Bac et al. 2016). The analysis will involve making different assumptions about the future
Document Page
Finance 3
stock prices. Different variables can be added based on the assumptions made by the analyst. The
model can also be used in determining the effect that change has had on bond prices. In such a
case, the interest rates are considered independent variables. The bond prices are the dependent
variable. Capital budget can also use sensitivity analysis to determine investors’ returns on the
factors that will affect their returns.
During capital budget the core methodology used to conduct sensitivity analysis is
quantification. The ranges and probability distributions that might elicit change are quantified.
The probable return after the subjection of the input variable is also quantified. The result is then
measured against the initial figure. The subjective data produced can then be used to make key
decisions regarding the financial future of the company or organization. Another method that can
be used for capital budget using sensitivity analysis is factorial analysis. A selected number of
samples can be compared to specific number of parameters that form a running combination. The
outcome of the analysis can be used to make financial decisions. As mentioned, sensitivity
analysis used by most companies help them make financial decision regarding the future, part of
which includes making a capital budget.
2. Scenario Analysis
Scenario analysis on capital budget is very different from sensitivity one and it is a
process of decisions analysis based on the predictable outcomes. The outcomes are normally
called the alternative world. It doesn’t focus more on the prediction but rather focuses more on
the analytic tool used to manage data uncertainty for today and for the future.
A perfect example of scenario analysis is when a firm needs to establish NPV of a
prospective investment under high or low rates of inflation (Lee, Cho, Hong and Yoon 2016).
While conducting a capital budget using scenario analysis, the analyst is supposed to create three
Document Page
Finance 4
different set of scenarios. These set of scenarios include; base case scenario, worst-and best-case
scenarios. The latter is normally the expected scenario. It is normally determined but what if
things proceed normally like they are supposed to. The worst scenario is a prediction of what
could happen that is least favorable (Pinngarm et al. 2017). An exact opposite of worse scenario
is best scenario, where a more favorable outcome is predicted. Both of the scenarios do not exist
in a vacuum; both of them are confined by a sense of feasibility. Feasibility, means the likelihood
of a scenario happening. For example an investor would not list one of the worst scenarios as a
meteorite striking and destroying the company. Worse scenarios should be realistic enough to be
helpful to the company.
It is important to note that, accuracy is quite difficult to achieve with scenario analysis.
The analysts cannot be sure of what might exactly take place in the future. However, the major
aim of scenario analysis remains to identify approximated conditions (Wu, Xu, Zhou and Qin
2016). Since we cannot determine exact conditions, approximated conditions is relevant in
providing a plausible idea of what might happen in the future. Once the company has plausible
ideas on what might happen, they can begin making plans regarding finances, human resource
and other important factors.
3. Breakeven Point Analysis
It is another important tool of analysis which significantly help in capital budgeting. A
break-even point defines the particular moment an investment shall yield a positive return. The
positive return is supposed to be determined through analysis of the variable costs (VC) and
fixed costs (FC). During capital budget using break even analysis method total fixed cost is not
used (Park, Lee, Doo and Yoon 2016). Total fixed costs are not used since it doesn’t in anyway
change the level of production of the increased analysis.
tabler-icon-diamond-filled.svg

Paraphrase This Document

Need a fresh take? Get an instant paraphrase of this document with our AI Paraphraser
Document Page
Finance 5
Break even analysis is used in studying useful relationship between the fixed and variable
costs. It also determines the returns and the breakeven point that is defined by the automatic
investment generated through the positive idea. Normally, it is determined graphically by simple
mathematics. For purpose of a capital budget, a breakeven point defines the point at which the
analyzed investment shall start generating a positive return (Kresta and Lisztwanová 2017). It is
usually computed by the value of production that is produced at a given time.
TFC remain unchanged with changes in production levels. TVC fluctuates with
fluctuating production levels and normally determined by a broken sloppy line that moves
upwards in a graphical representation (Elgendi, Munasinghe and Jamalipour, 2018). The slope
upwards is a determinant that, TVC surges with increasing production.
In a graphical representation, the total cost is represented with a parallel line that levels
up at the TFC line. Predicted income remains denoted by parallel line which is corresponding to
the amount of produced units per unit price. The line starts from the left and adjust to the top left
corner of the graph. At the point where total income (TI) line equals amount of produced units,
the line multiplies by the unit price. The important breaking point defines the node that is formed
between the lines of TC and TI. At the breaking point when production is almost the same as the
revenue generated, the company has their best outcome in the investment that they chose. Losses
are shown by all the lines that run at the lower level of the production line. This is an indication
of the worst scenario that the company has undergone through the investment undertaken.
The figure below has been used for illustration
Document Page
Finance 6
4. Simulation Analysis
Simulation analysis in capital budget is the average outcome of a scenario based on all
the complex factors that might have arise. Simulation analysis is quite similar to situation
analysis except that the initial focuses on inputs that change extremely first and unpredictable
(Christopher 2016). The estimated inputs for simulation analysis include; inflation rates and
market analysis risk. The analysis is normally run to see how constantly the changing inputs have
affected the required output. The outputs are then averaged to find out the estimated output.
Simulation analyses are great since they focus on those inputs that are multiple can
change anytime. Most of these inputs are normally unrelated to the set business. It is also very
helpful to consider in the case that the estimated base case is difficult to complete by hand.
Simulation analysis predicts the problem through identifying the complex and
interconnected factors. All these factors are influenced by financial outcomes and therefore it
easier to determine them through statistical methods (Ding, Wang and Zheng 2018).. Simulation
Document Page
Finance 7
method solves a problem through directly accumulating all the underlying processes and then
calculating the average risk result of the process. Through simulation all the unmentioned risks
and sources of uncertainty are represented by a possible value. The representatives’ values are
then calculated with the underlying inputs (Thomas 2017). Essentially, the role of simulation
analysis is to determine what will happen if all the changes and the inputs are all put together as
one. By running many simulations based on probability of an input (x) the analyst can formulate
the output (y). The average is done by multiple inputs in order to predict the general output.
Capital budgeting is in definition the expected demands in the dealings of a company. It
is difficult to predict the future of a company due to uncertainties (Thomas 2017). It is for the
purpose of uncertainties that the four methods of analysis have been developed to help analyst
predict commercial occurrences in the future. The discussed methods include scenario analysis,
breakeven point, simulation analysis and sensitivity analysis.
tabler-icon-diamond-filled.svg

Paraphrase This Document

Need a fresh take? Get an instant paraphrase of this document with our AI Paraphraser
Document Page
Finance 8
References
Christopher, M., 2016. Logistics & supply chain management. Pearson UK. Pp.42-49.
Ding, H., Wang, L. and Zheng, L., 2018. Collaborative mechanism on profit allotment and
public health for a sustainable supply chain. European Journal of Operational Research, 267(2),
pp.478-495
Elgendi, I., Munasinghe, K.S. and Jamalipour, A., 2018, May. Break-Even Point-Based Radio
Resource Management for Fair Coexistence between U-LTE and Wi-Fi. In 2018 IEEE
International Conference on Communications (ICC) (pp. 1-6). IEEE.
Iooss, B. and Lemaître, P., 2015. A review on global sensitivity analysis methods.
In Uncertainty management in simulation-optimization of complex systems (pp. 101-122).
Springer, Boston, MA.
Kresta, A. and Lisztwanová, K., 2017. Break-even analysis under randomness with heavy-tailed
distribution.
Lee, S., Cho, C., Hong, E.K. and Yoon, B., 2016. Forecasting mobile broadband traffic:
Application of scenario analysis and Delphi method. Expert Systems with Applications, 44,
pp.126-137.
Park, W., Lee, K., Doo, S. and Yoon, S.S., 2016. Investments for new product development: A
break-even time analysis. Engineering Management Journal, 28(3), pp.158-167.
Document Page
Finance 9
Pianosi, F. and Wagener, T., 2015. A simple and efficient method for global sensitivity analysis
based on cumulative distribution functions. Environmental Modelling & Software, 67, pp.1-11.
Pinngarm, P., Ninsonti, H., Pavasant, P., Jesdapipat, S. and Setthapun, W., 2017. Scenario
analysis for Green City model: Case study of Chiang Mai World Green City Model,
Thailand. Journal of Renewable Energy and Smart Grid Technology, 12(1), pp.23-36.
Thomas, K., 2017. Intellectual property law in comparative perspective: the case of trademark
“piracy” in Guatemala. In Comparative Law and Anthropology. Edward Elgar Publishing.
Vu-Bac, N., Lahmer, T., Zhuang, X., Nguyen-Thoi, T. and Rabczuk, T., 2016. A software
framework for probabilistic sensitivity analysis for computationally expensive models. Advances
in Engineering Software, 100, pp.19-31.
Wu, J., Xu, S., Zhou, R. and Qin, Y., 2016. Scenario analysis of mine water inrush hazard using
Bayesian networks. Safety science, 89, pp.231-239.
chevron_up_icon
1 out of 9
circle_padding
hide_on_mobile
zoom_out_icon
[object Object]