Capital Budgeting and Cost of Capital Analysis Homework, University
VerifiedAdded on 2022/09/01
|12
|1855
|16
Homework Assignment
AI Summary
This assignment is a comprehensive analysis of capital budgeting techniques, focusing on a project's financial viability. It begins with calculating after-tax cash flows, including initial investment, salvage value, and working capital. Key financial metrics such as Net Present Value (NPV), Internal Rate of Return (IRR), payback period, and profitability index are calculated and evaluated. The analysis explores the impact of revenue and cost fluctuations on project acceptance, followed by a discussion on capital budgeting decisions for mutually exclusive projects with unequal lifespans. The assignment then delves into the cost of capital, including the value and cost of debt, preference shares, and ordinary shares, culminating in the calculation of the Weighted Average Cost of Capital (WACC). Finally, it examines how a change in the cost of capital affects the company's valuation.
Running head: MASTERS OF PROFESSIONAL ACCOUNTING
Masters of Professional Accounting
Name of the Student:
Name of the University:
Author’s Note:
Masters of Professional Accounting
Name of the Student:
Name of the University:
Author’s Note:
Paraphrase This Document
Need a fresh take? Get an instant paraphrase of this document with our AI Paraphraser
1MASTERS OF PROFESSIONAL ACCOUNTING
Table of Contents
Question 1........................................................................................................................................2
Question 2........................................................................................................................................3
Question 3........................................................................................................................................4
Question 4........................................................................................................................................5
Question 5........................................................................................................................................6
Question 6........................................................................................................................................6
Question 7........................................................................................................................................7
Question 8........................................................................................................................................8
Question 9........................................................................................................................................8
References......................................................................................................................................10
2MASTERS OF PROFESSIONAL ACCOUNTING
Question 1
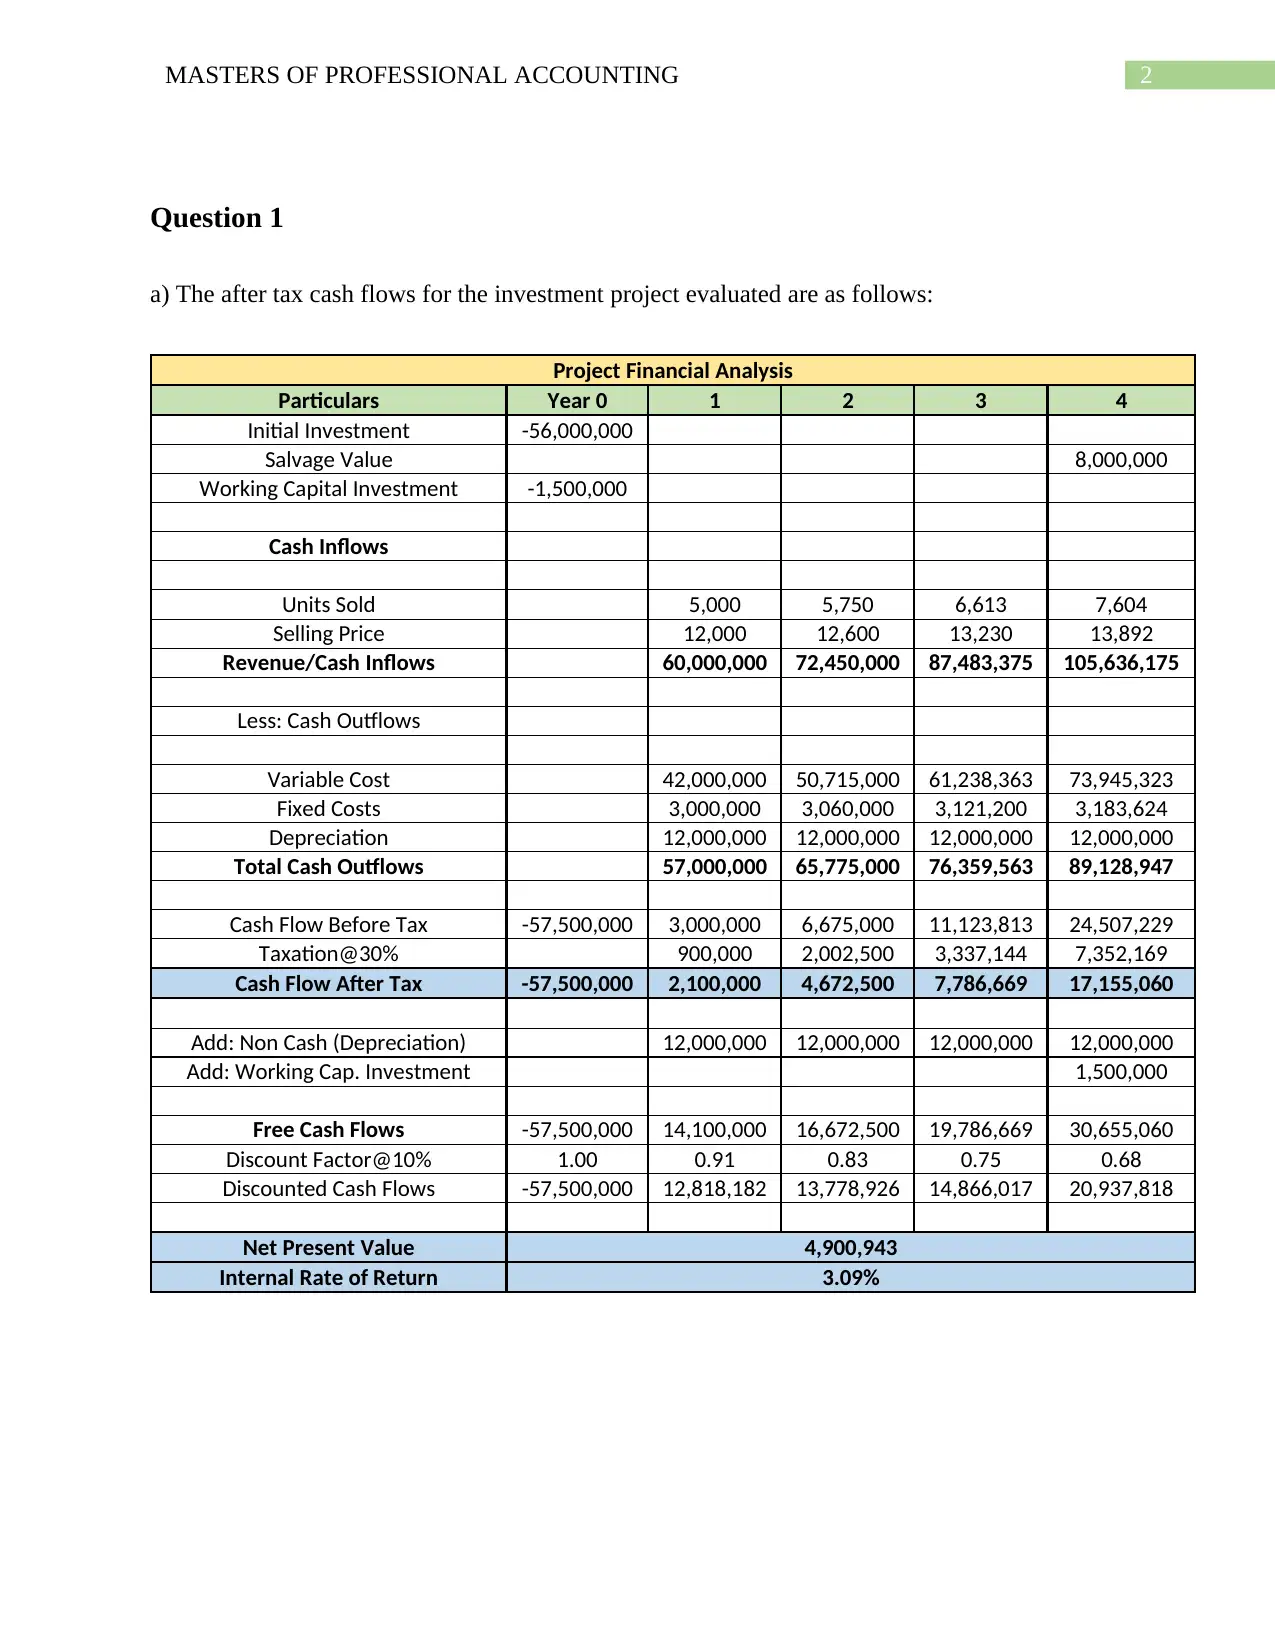
a) The after tax cash flows for the investment project evaluated are as follows:
Project Financial Analysis
Particulars Year 0 1 2 3 4
Initial Investment -56,000,000
Salvage Value 8,000,000
Working Capital Investment -1,500,000
Cash Inflows
Units Sold 5,000 5,750 6,613 7,604
Selling Price 12,000 12,600 13,230 13,892
Revenue/Cash Inflows 60,000,000 72,450,000 87,483,375 105,636,175
Less: Cash Outflows
Variable Cost 42,000,000 50,715,000 61,238,363 73,945,323
Fixed Costs 3,000,000 3,060,000 3,121,200 3,183,624
Depreciation 12,000,000 12,000,000 12,000,000 12,000,000
Total Cash Outflows 57,000,000 65,775,000 76,359,563 89,128,947
Cash Flow Before Tax -57,500,000 3,000,000 6,675,000 11,123,813 24,507,229
Taxation@30% 900,000 2,002,500 3,337,144 7,352,169
Cash Flow After Tax -57,500,000 2,100,000 4,672,500 7,786,669 17,155,060
Add: Non Cash (Depreciation) 12,000,000 12,000,000 12,000,000 12,000,000
Add: Working Cap. Investment 1,500,000
Free Cash Flows -57,500,000 14,100,000 16,672,500 19,786,669 30,655,060
Discount Factor@10% 1.00 0.91 0.83 0.75 0.68
Discounted Cash Flows -57,500,000 12,818,182 13,778,926 14,866,017 20,937,818
Net Present Value 4,900,943
Internal Rate of Return 3.09%
Question 1
a) The after tax cash flows for the investment project evaluated are as follows:
Project Financial Analysis
Particulars Year 0 1 2 3 4
Initial Investment -56,000,000
Salvage Value 8,000,000
Working Capital Investment -1,500,000
Cash Inflows
Units Sold 5,000 5,750 6,613 7,604
Selling Price 12,000 12,600 13,230 13,892
Revenue/Cash Inflows 60,000,000 72,450,000 87,483,375 105,636,175
Less: Cash Outflows
Variable Cost 42,000,000 50,715,000 61,238,363 73,945,323
Fixed Costs 3,000,000 3,060,000 3,121,200 3,183,624
Depreciation 12,000,000 12,000,000 12,000,000 12,000,000
Total Cash Outflows 57,000,000 65,775,000 76,359,563 89,128,947
Cash Flow Before Tax -57,500,000 3,000,000 6,675,000 11,123,813 24,507,229
Taxation@30% 900,000 2,002,500 3,337,144 7,352,169
Cash Flow After Tax -57,500,000 2,100,000 4,672,500 7,786,669 17,155,060
Add: Non Cash (Depreciation) 12,000,000 12,000,000 12,000,000 12,000,000
Add: Working Cap. Investment 1,500,000
Free Cash Flows -57,500,000 14,100,000 16,672,500 19,786,669 30,655,060
Discount Factor@10% 1.00 0.91 0.83 0.75 0.68
Discounted Cash Flows -57,500,000 12,818,182 13,778,926 14,866,017 20,937,818
Net Present Value 4,900,943
Internal Rate of Return 3.09%
⊘ This is a preview!⊘
Do you want full access?
Subscribe today to unlock all pages.
Trusted by 1+ million students worldwide
3MASTERS OF PROFESSIONAL ACCOUNTING
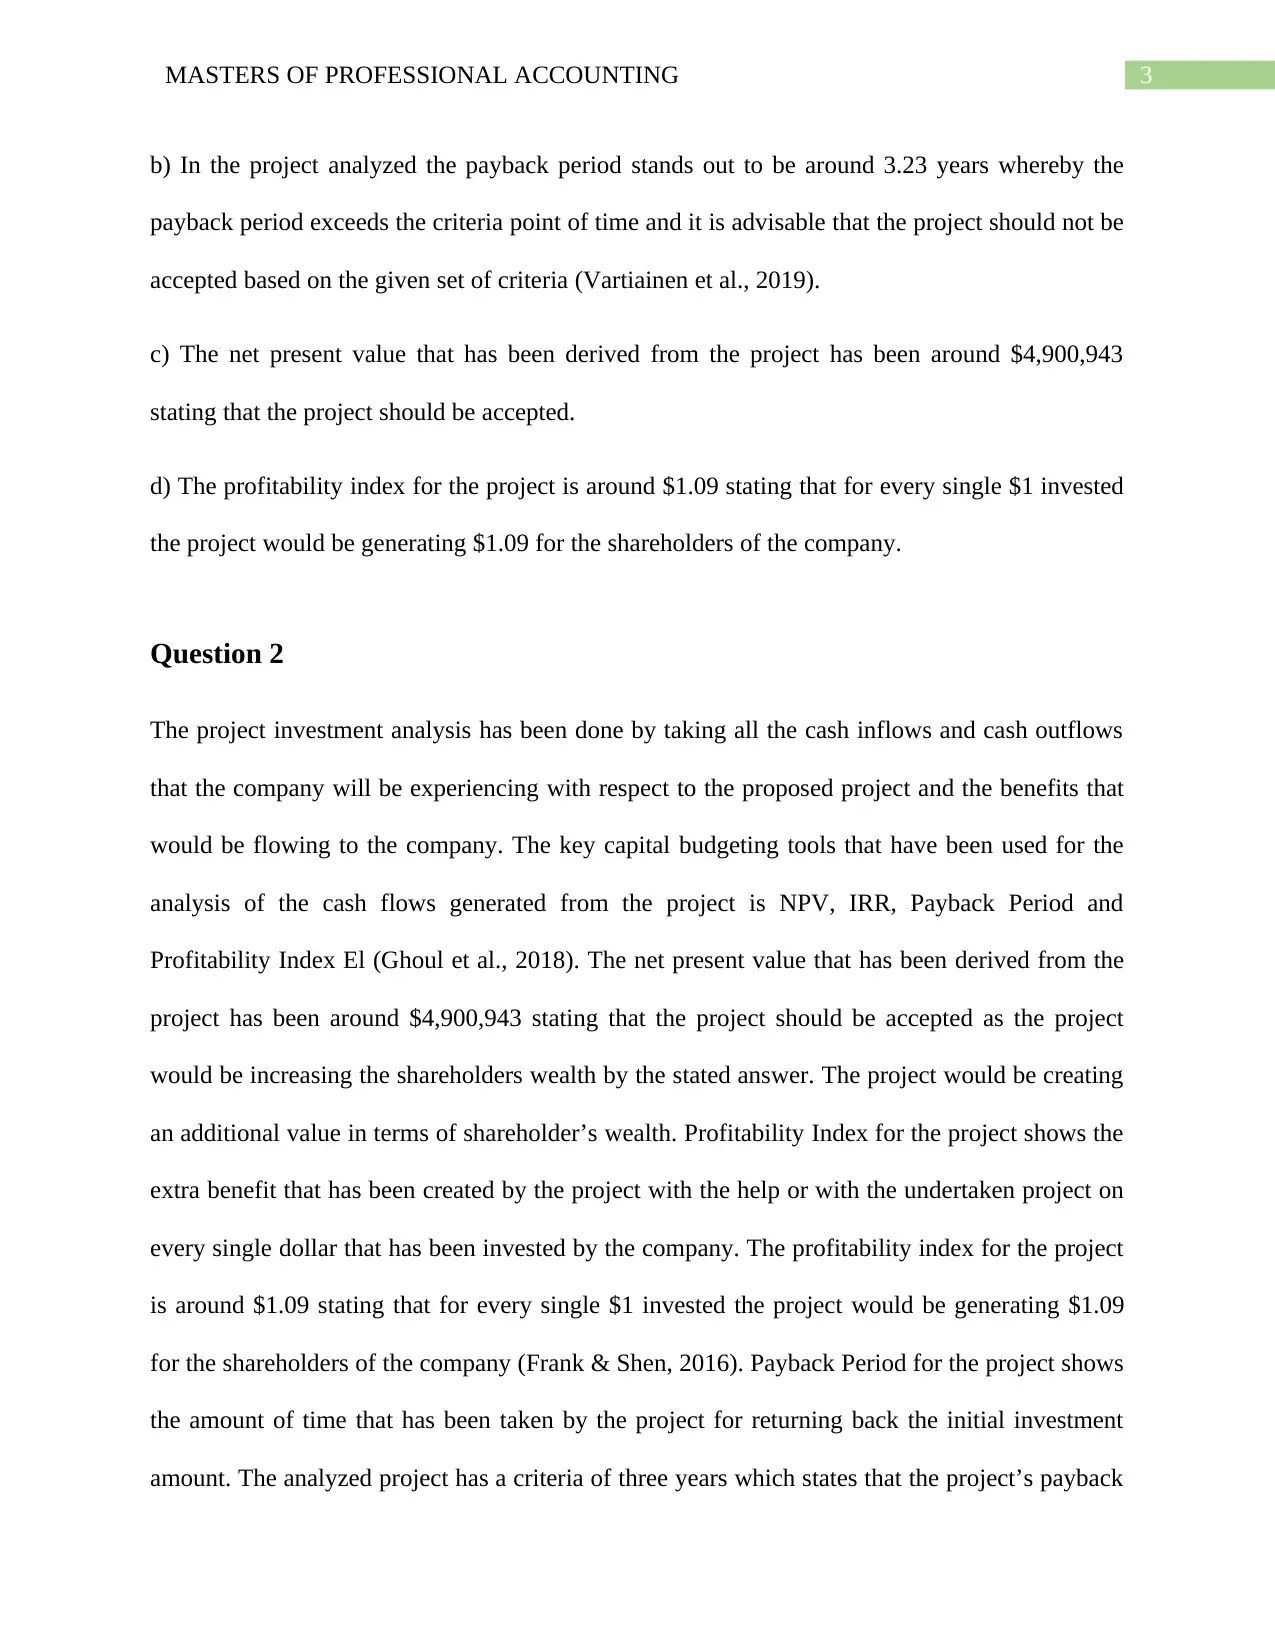
b) In the project analyzed the payback period stands out to be around 3.23 years whereby the
payback period exceeds the criteria point of time and it is advisable that the project should not be
accepted based on the given set of criteria (Vartiainen et al., 2019).
c) The net present value that has been derived from the project has been around $4,900,943
stating that the project should be accepted.
d) The profitability index for the project is around $1.09 stating that for every single $1 invested
the project would be generating $1.09 for the shareholders of the company.
Question 2
The project investment analysis has been done by taking all the cash inflows and cash outflows
that the company will be experiencing with respect to the proposed project and the benefits that
would be flowing to the company. The key capital budgeting tools that have been used for the
analysis of the cash flows generated from the project is NPV, IRR, Payback Period and
Profitability Index El (Ghoul et al., 2018). The net present value that has been derived from the
project has been around $4,900,943 stating that the project should be accepted as the project
would be increasing the shareholders wealth by the stated answer. The project would be creating
an additional value in terms of shareholder’s wealth. Profitability Index for the project shows the
extra benefit that has been created by the project with the help or with the undertaken project on
every single dollar that has been invested by the company. The profitability index for the project
is around $1.09 stating that for every single $1 invested the project would be generating $1.09
for the shareholders of the company (Frank & Shen, 2016). Payback Period for the project shows
the amount of time that has been taken by the project for returning back the initial investment
amount. The analyzed project has a criteria of three years which states that the project’s payback
Paraphrase This Document
Need a fresh take? Get an instant paraphrase of this document with our AI Paraphraser
4MASTERS OF PROFESSIONAL ACCOUNTING
period got to be equal to or less than three years of time frame so that the project is accepted. In
the project analyzed the payback period stands out to be around 3.23 years whereby the payback
period exceeds the criteria point of time and it is advisable that the project should not be
accepted based on the given set of criteria (Liu & Wysocki, 2017).
Question 3
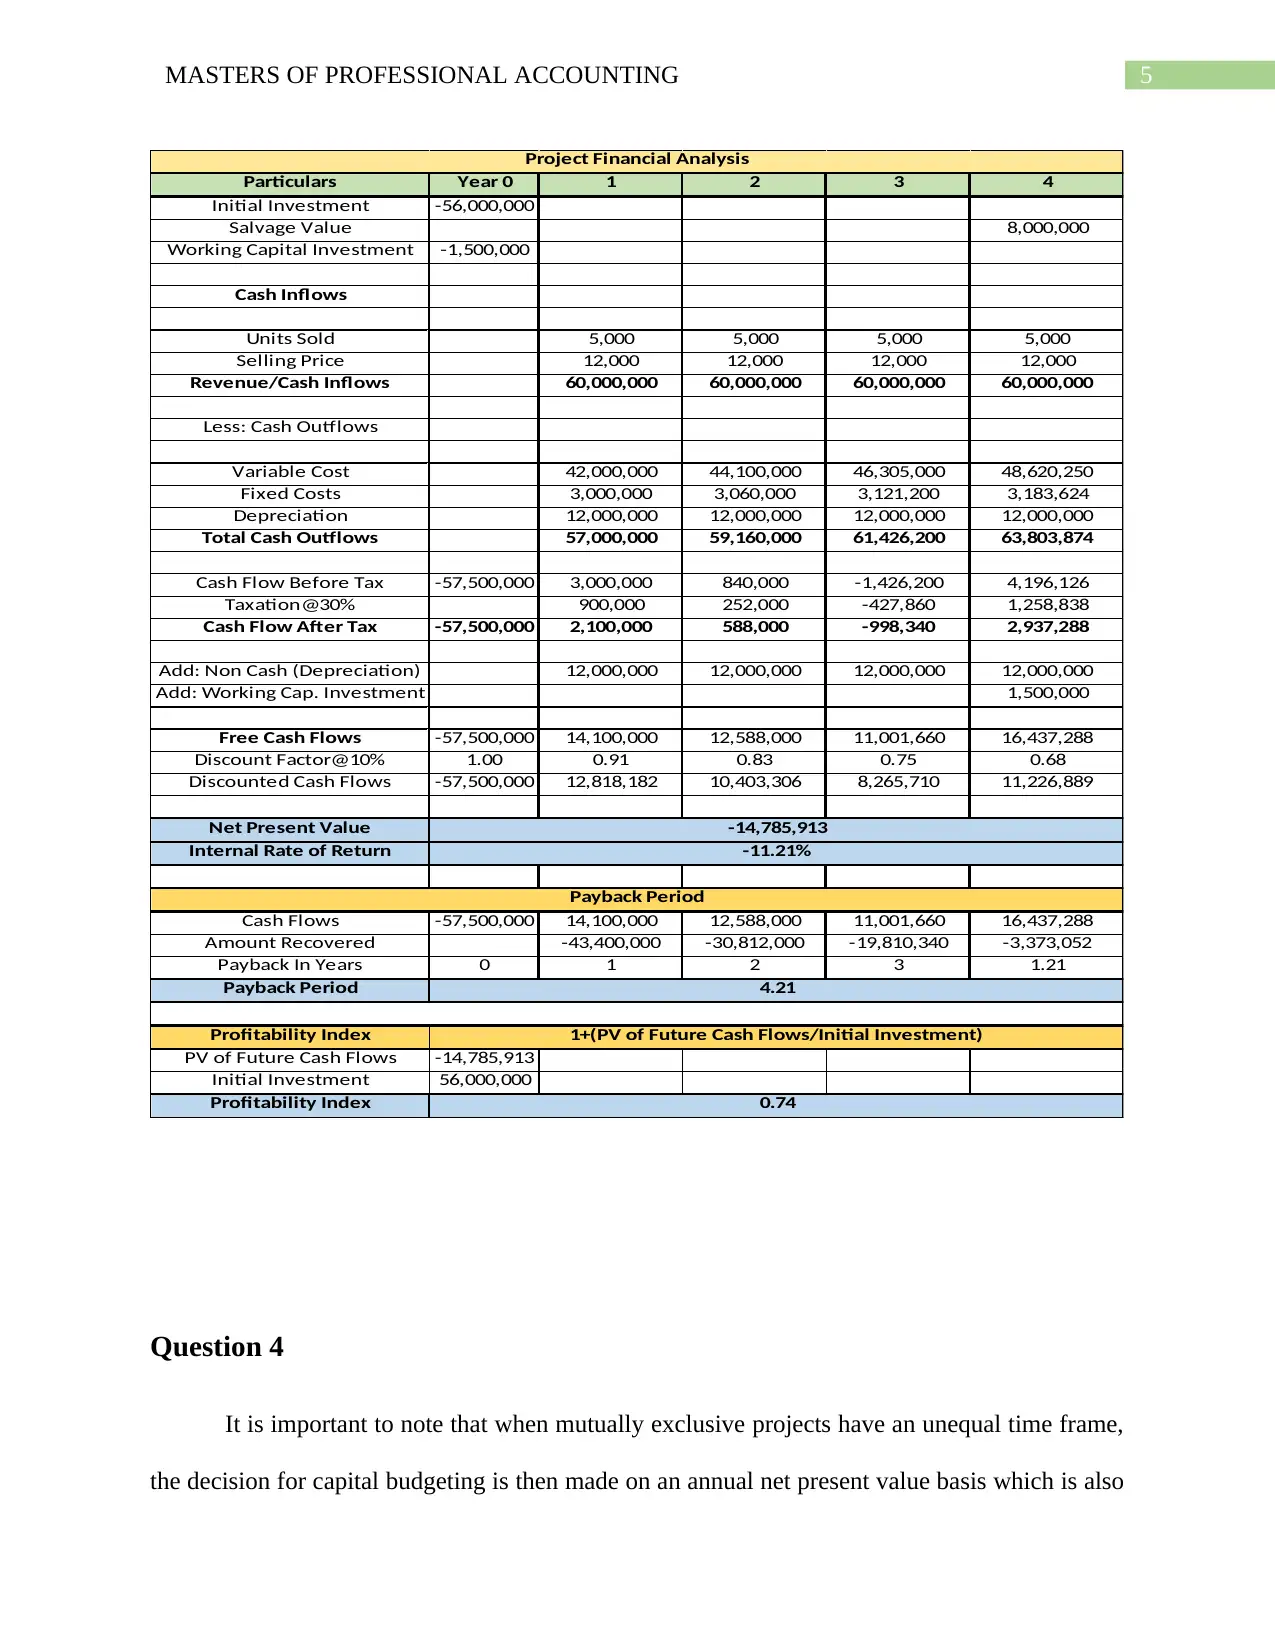
If the revenue grows at 0% and increase in variable cost occurs by 5% then the project
might not be accepted as the same would be a negative NPV, the projects payback at the same
time increases and the profitability index for the project comes to around 0.74 times as shown
below:
period got to be equal to or less than three years of time frame so that the project is accepted. In
the project analyzed the payback period stands out to be around 3.23 years whereby the payback
period exceeds the criteria point of time and it is advisable that the project should not be
accepted based on the given set of criteria (Liu & Wysocki, 2017).
Question 3
If the revenue grows at 0% and increase in variable cost occurs by 5% then the project
might not be accepted as the same would be a negative NPV, the projects payback at the same
time increases and the profitability index for the project comes to around 0.74 times as shown
below:
5MASTERS OF PROFESSIONAL ACCOUNTING
Question 4
It is important to note that when mutually exclusive projects have an unequal time frame,
the decision for capital budgeting is then made on an annual net present value basis which is also
Particulars Year 0 1 2 3 4
Initial Investment -56,000,000
Salvage Value 8,000,000
Working Capital Investment -1,500,000
Cash Inflows
Units Sold 5,000 5,000 5,000 5,000
Selling Price 12,000 12,000 12,000 12,000
Revenue/Cash Inflows 60,000,000 60,000,000 60,000,000 60,000,000
Less: Cash Outflows
Variable Cost 42,000,000 44,100,000 46,305,000 48,620,250
Fixed Costs 3,000,000 3,060,000 3,121,200 3,183,624
Depreciation 12,000,000 12,000,000 12,000,000 12,000,000
Total Cash Outflows 57,000,000 59,160,000 61,426,200 63,803,874
Cash Flow Before Tax -57,500,000 3,000,000 840,000 -1,426,200 4,196,126
Taxation@30% 900,000 252,000 -427,860 1,258,838
Cash Flow After Tax -57,500,000 2,100,000 588,000 -998,340 2,937,288
Add: Non Cash (Depreciation) 12,000,000 12,000,000 12,000,000 12,000,000
Add: Working Cap. Investment 1,500,000
Free Cash Flows -57,500,000 14,100,000 12,588,000 11,001,660 16,437,288
Discount Factor@10% 1.00 0.91 0.83 0.75 0.68
Discounted Cash Flows -57,500,000 12,818,182 10,403,306 8,265,710 11,226,889
Net Present Value
Internal Rate of Return
Cash Flows -57,500,000 14,100,000 12,588,000 11,001,660 16,437,288
Amount Recovered -43,400,000 -30,812,000 -19,810,340 -3,373,052
Payback In Years 0 1 2 3 1.21
Payback Period
Profitability Index
PV of Future Cash Flows -14,785,913
Initial Investment 56,000,000
Profitability Index
1+(PV of Future Cash Flows/Initial Investment)
0.74
Project Financial Analysis
-14,785,913
-11.21%
Payback Period
4.21
⊘ This is a preview!⊘
Do you want full access?
Subscribe today to unlock all pages.
Trusted by 1+ million students worldwide
6MASTERS OF PROFESSIONAL ACCOUNTING
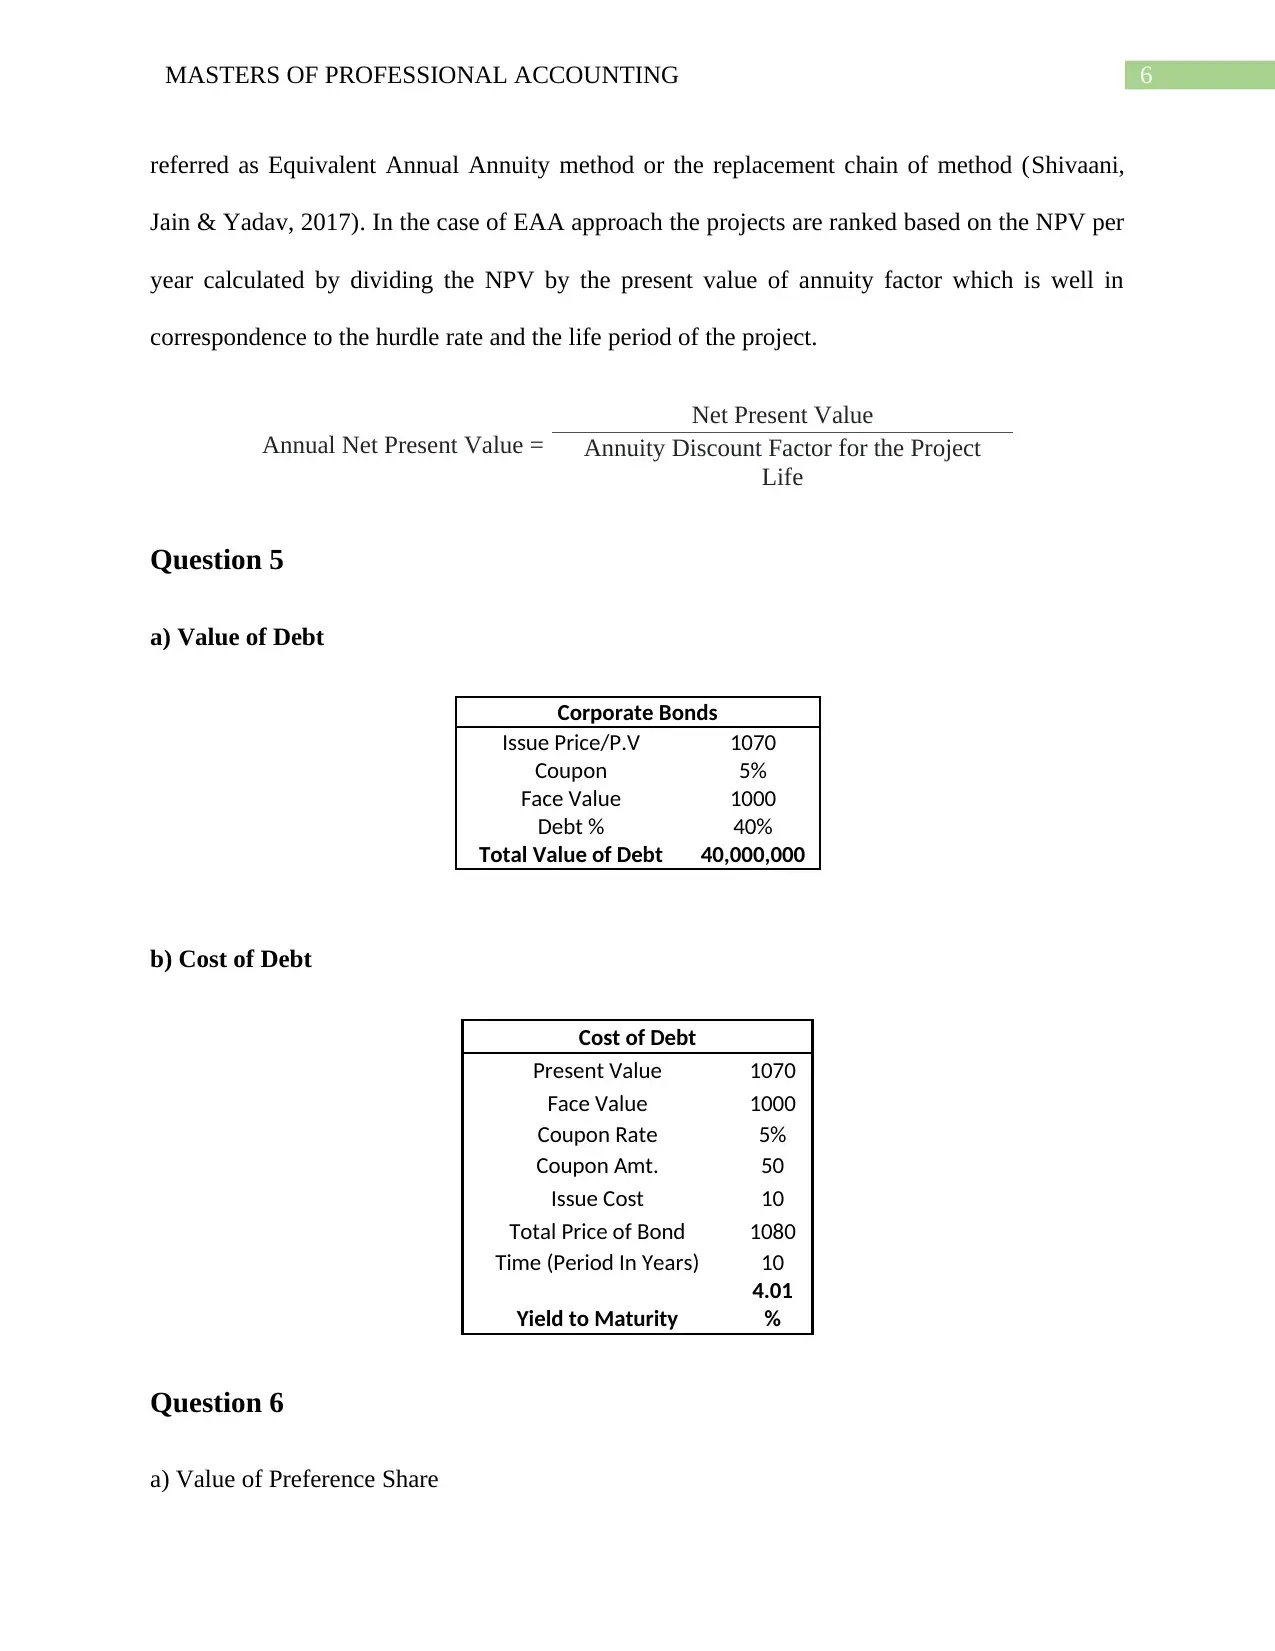
referred as Equivalent Annual Annuity method or the replacement chain of method (Shivaani,
Jain & Yadav, 2017). In the case of EAA approach the projects are ranked based on the NPV per
year calculated by dividing the NPV by the present value of annuity factor which is well in
correspondence to the hurdle rate and the life period of the project.
Annual Net Present Value =
Net Present Value
Annuity Discount Factor for the Project
Life
Question 5
a) Value of Debt
Corporate Bonds
Issue Price/P.V 1070
Coupon 5%
Face Value 1000
Debt % 40%
Total Value of Debt 40,000,000
b) Cost of Debt
Cost of Debt
Present Value 1070
Face Value 1000
Coupon Rate 5%
Coupon Amt. 50
Issue Cost 10
Total Price of Bond 1080
Time (Period In Years) 10
Yield to Maturity
4.01
%
Question 6
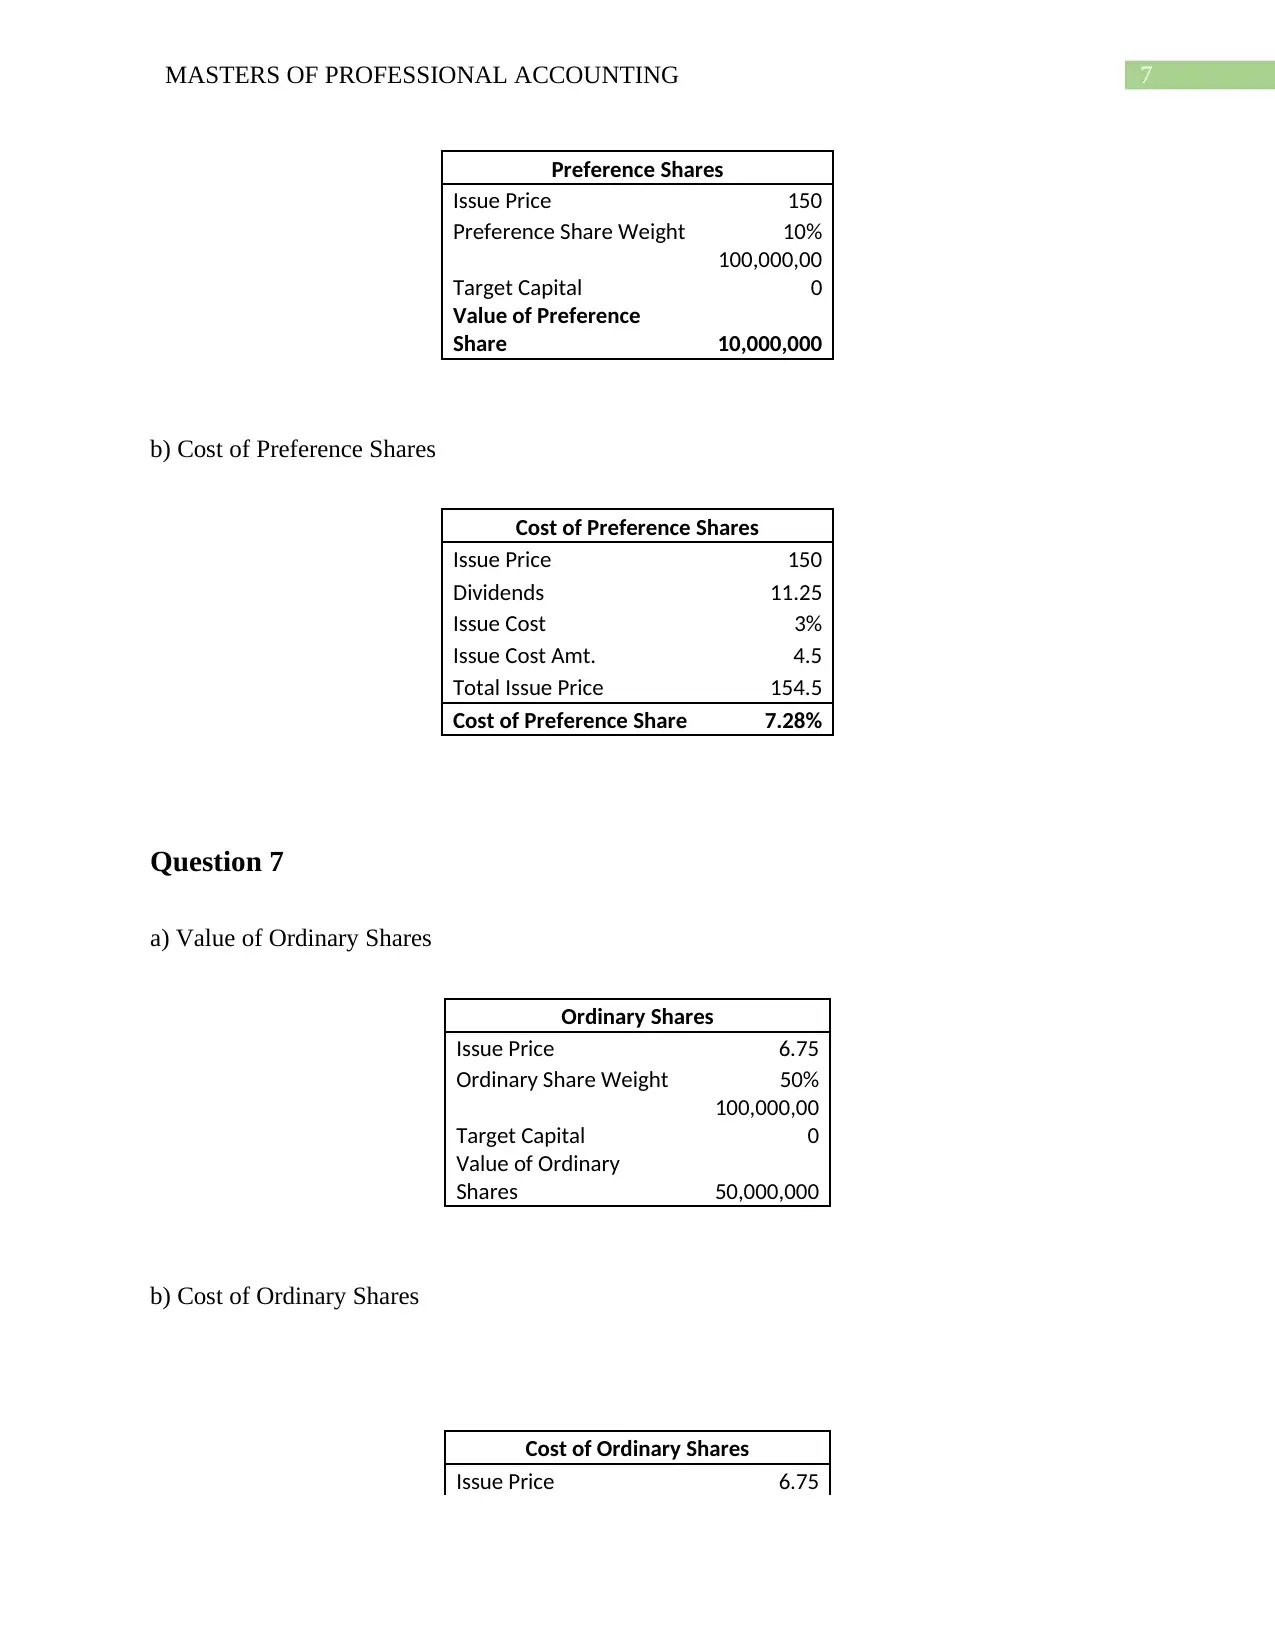
a) Value of Preference Share
referred as Equivalent Annual Annuity method or the replacement chain of method (Shivaani,
Jain & Yadav, 2017). In the case of EAA approach the projects are ranked based on the NPV per
year calculated by dividing the NPV by the present value of annuity factor which is well in
correspondence to the hurdle rate and the life period of the project.
Annual Net Present Value =
Net Present Value
Annuity Discount Factor for the Project
Life
Question 5
a) Value of Debt
Corporate Bonds
Issue Price/P.V 1070
Coupon 5%
Face Value 1000
Debt % 40%
Total Value of Debt 40,000,000
b) Cost of Debt
Cost of Debt
Present Value 1070
Face Value 1000
Coupon Rate 5%
Coupon Amt. 50
Issue Cost 10
Total Price of Bond 1080
Time (Period In Years) 10
Yield to Maturity
4.01
%
Question 6
a) Value of Preference Share
Paraphrase This Document
Need a fresh take? Get an instant paraphrase of this document with our AI Paraphraser
7MASTERS OF PROFESSIONAL ACCOUNTING
Preference Shares
Issue Price 150
Preference Share Weight 10%
Target Capital
100,000,00
0
Value of Preference
Share 10,000,000
b) Cost of Preference Shares
Cost of Preference Shares
Issue Price 150
Dividends 11.25
Issue Cost 3%
Issue Cost Amt. 4.5
Total Issue Price 154.5
Cost of Preference Share 7.28%
Question 7
a) Value of Ordinary Shares
Ordinary Shares
Issue Price 6.75
Ordinary Share Weight 50%
Target Capital
100,000,00
0
Value of Ordinary
Shares 50,000,000
b) Cost of Ordinary Shares
Cost of Ordinary Shares
Issue Price 6.75
8MASTERS OF PROFESSIONAL ACCOUNTING
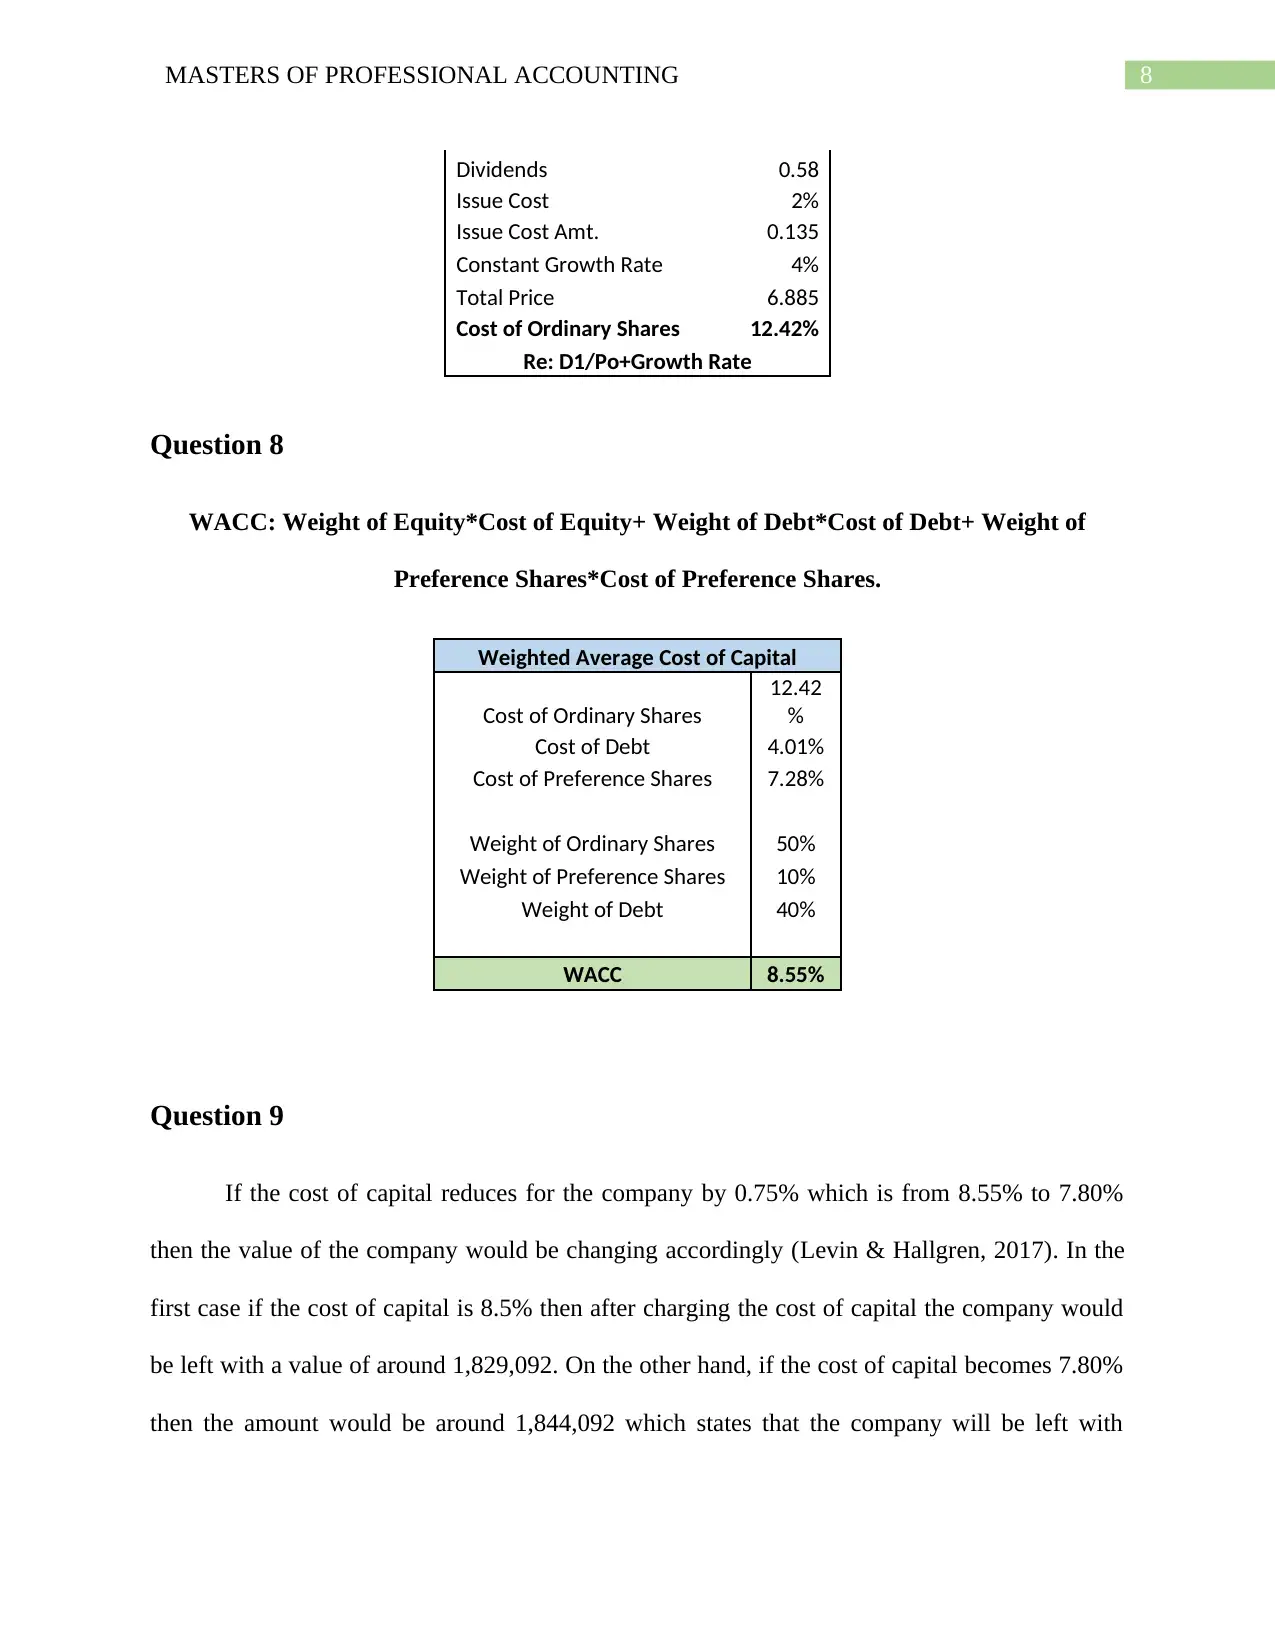
Dividends 0.58
Issue Cost 2%
Issue Cost Amt. 0.135
Constant Growth Rate 4%
Total Price 6.885
Cost of Ordinary Shares 12.42%
Re: D1/Po+Growth Rate
Question 8
WACC: Weight of Equity*Cost of Equity+ Weight of Debt*Cost of Debt+ Weight of
Preference Shares*Cost of Preference Shares.
Weighted Average Cost of Capital
Cost of Ordinary Shares
12.42
%
Cost of Debt 4.01%
Cost of Preference Shares 7.28%
Weight of Ordinary Shares 50%
Weight of Preference Shares 10%
Weight of Debt 40%
WACC 8.55%
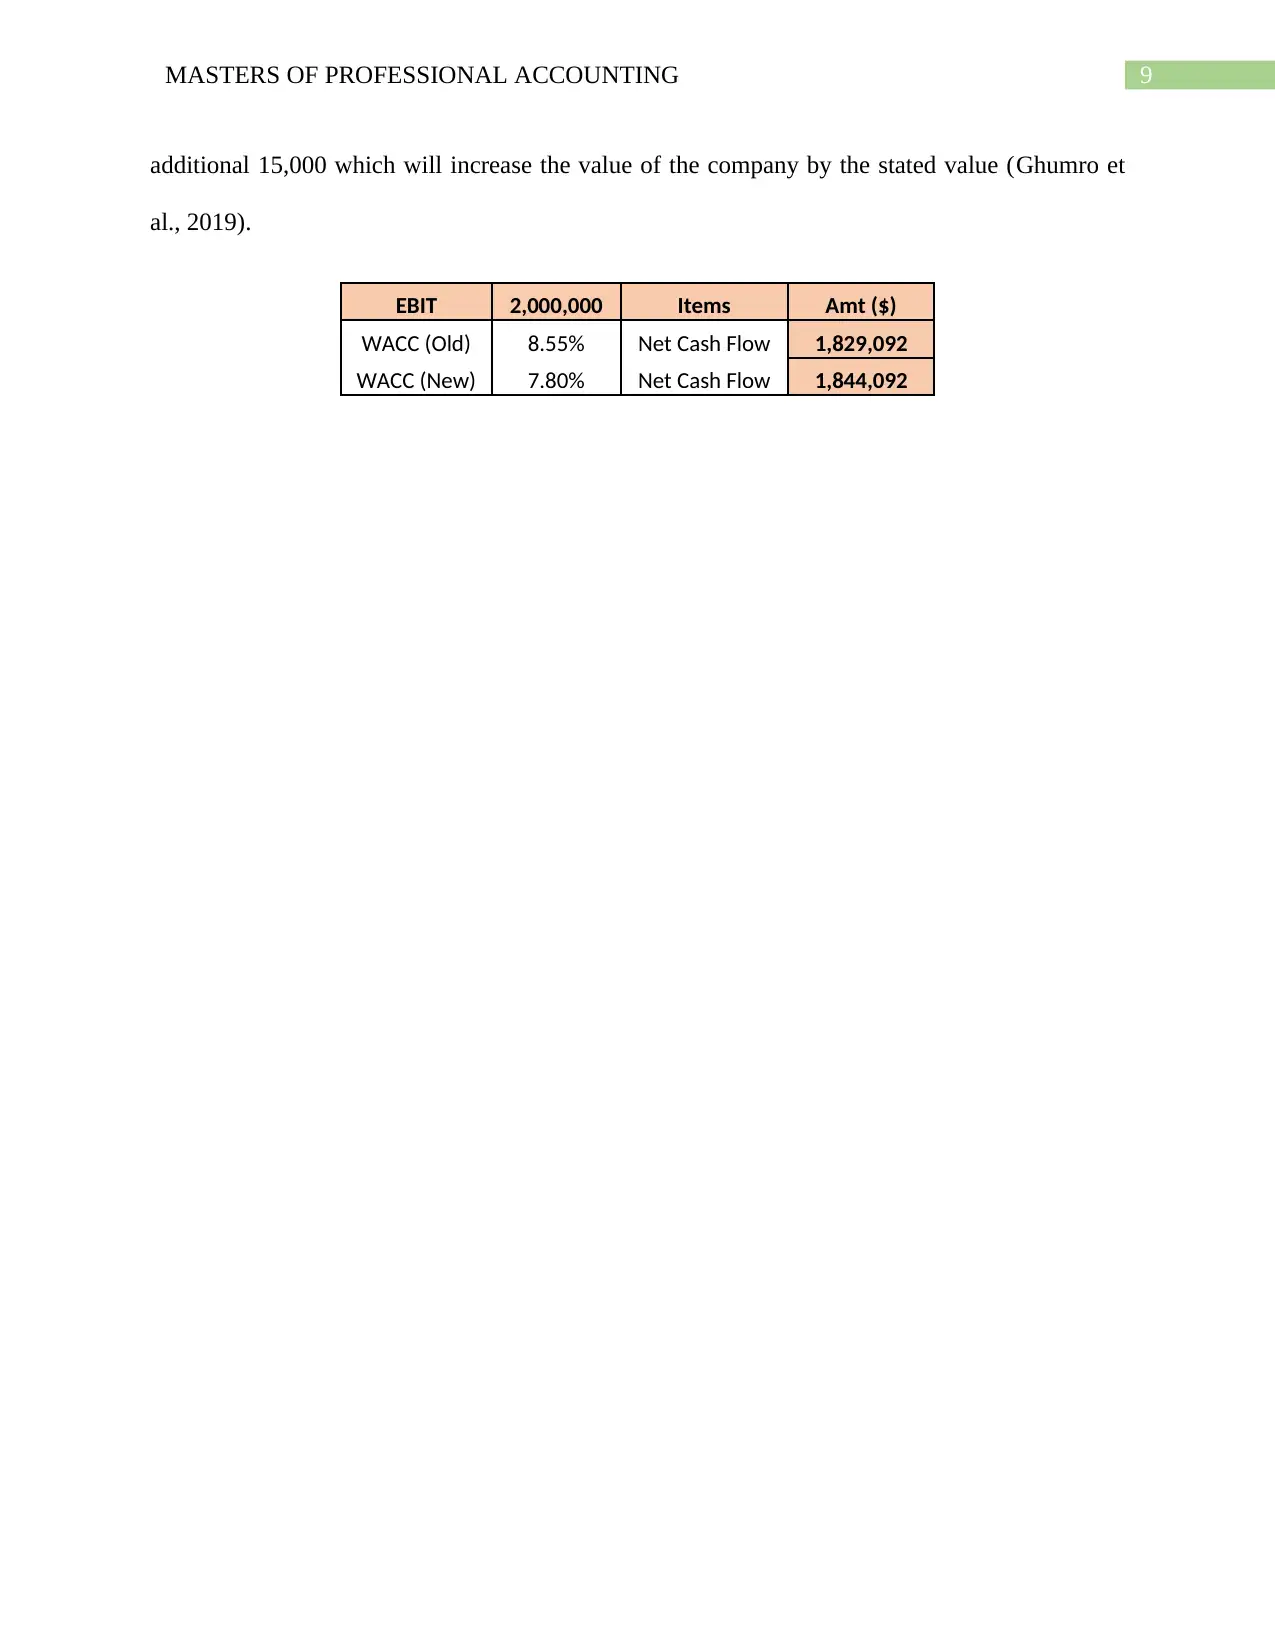
Question 9
If the cost of capital reduces for the company by 0.75% which is from 8.55% to 7.80%
then the value of the company would be changing accordingly (Levin & Hallgren, 2017). In the
first case if the cost of capital is 8.5% then after charging the cost of capital the company would
be left with a value of around 1,829,092. On the other hand, if the cost of capital becomes 7.80%
then the amount would be around 1,844,092 which states that the company will be left with
Dividends 0.58
Issue Cost 2%
Issue Cost Amt. 0.135
Constant Growth Rate 4%
Total Price 6.885
Cost of Ordinary Shares 12.42%
Re: D1/Po+Growth Rate
Question 8
WACC: Weight of Equity*Cost of Equity+ Weight of Debt*Cost of Debt+ Weight of
Preference Shares*Cost of Preference Shares.
Weighted Average Cost of Capital
Cost of Ordinary Shares
12.42
%
Cost of Debt 4.01%
Cost of Preference Shares 7.28%
Weight of Ordinary Shares 50%
Weight of Preference Shares 10%
Weight of Debt 40%
WACC 8.55%
Question 9
If the cost of capital reduces for the company by 0.75% which is from 8.55% to 7.80%
then the value of the company would be changing accordingly (Levin & Hallgren, 2017). In the
first case if the cost of capital is 8.5% then after charging the cost of capital the company would
be left with a value of around 1,829,092. On the other hand, if the cost of capital becomes 7.80%
then the amount would be around 1,844,092 which states that the company will be left with
⊘ This is a preview!⊘
Do you want full access?
Subscribe today to unlock all pages.
Trusted by 1+ million students worldwide
9MASTERS OF PROFESSIONAL ACCOUNTING
additional 15,000 which will increase the value of the company by the stated value (Ghumro et
al., 2019).
EBIT 2,000,000 Items Amt ($)
WACC (Old) 8.55% Net Cash Flow 1,829,092
WACC (New) 7.80% Net Cash Flow 1,844,092
additional 15,000 which will increase the value of the company by the stated value (Ghumro et
al., 2019).
EBIT 2,000,000 Items Amt ($)
WACC (Old) 8.55% Net Cash Flow 1,829,092
WACC (New) 7.80% Net Cash Flow 1,844,092
Paraphrase This Document
Need a fresh take? Get an instant paraphrase of this document with our AI Paraphraser
10MASTERS OF PROFESSIONAL ACCOUNTING
References
Alkhamis, N., Noreen, U., Ghonaim, L., Alghonaim, S., Ibrahim, S., & Alturki, R. A. A. (2017).
Capital Budgeting and Capital Structure Decisions in Saudi Arabia. Advanced Science
Letters, 23(1), 330-332.
Al-Mutairi, A., Naser, K., & Saeid, M. (2018). Capital budgeting practices by non-financial
companies listed on Kuwait Stock Exchange (KSE). Cogent Economics & Finance, 6(1),
1468232.
Chadha, S., & Sharma, S. K. (2019). Capital budgeting practices: a survey in the selected Indian
manufacturing firms. International Journal of Indian Culture and Business Management,
18(4), 381-390.
El Ghoul, S., Guedhami, O., Kim, H., & Park, K. (2018). Corporate environmental responsibility
and the cost of capital: International evidence. Journal of Business Ethics, 149(2), 335-
361.
Frank, M. Z., & Shen, T. (2016). Investment and the weighted average cost of capital. Journal of
Financial Economics, 119(2), 300-315.
Ghumro, I. A., Lashari, A. A., Bhatti, I., & Abro, M. U. R. (2019). Investment Decisions: How it
influence Capital Budgeting Practices. Journal of Managerial Sciences, 13(2).
Jha, A., & Arora, S. (2019). Literature Review of Capital Budgeting Practices with Special
Reference to Capital Intensive Industries of India. Prabandhan: Indian Journal of
Management, 12(5), 21-34.
11MASTERS OF PROFESSIONAL ACCOUNTING
Levin, V., & Hallgren, A. (2017). The choice of capital budgeting techniques: a human capital
approach.
Liu, M., & Wysocki, P. (2017). Cross-sectional determinants of information quality proxies and
cost of capital measures. Quarterly Journal of Finance, 7(02), 1650016.
Robinson, C. J., & Burnett, J. (2016). Financial Management Practices: An Exploratory Study of
Capital Budgeting Techniques in the Caribbean Region. Available at SSRN 2857152.
Shivaani, M. V., Jain, P. K., & Yadav, S. S. (2017). Perceptual Mapping of Capital Budgeting
Techniques: Empirical Evidence from Corporate Enterprises in India. Research Bulletin,
42(4), 106-112.
Su, S. H., Lee, H. L., Chou, J. J., Yeh, J. Y., & Thi, M. H. V. (2018). Application and effects of
capital budgeting among the manufacturing companies in Vietnam. International Journal
of Organizational Innovation (Online), 10(4), 111-120.
Vartiainen, E., Masson, G., Breyer, C., Moser, D., & Román Medina, E. (2019). Impact of
weighted average cost of capital, capital expenditure, and other parameters on future
utility‐scale PV levelised cost of electricity. Progress in Photovoltaics: Research and
Applications.
Zhang, G. (2017). Fundamental (versus Market) Risk and Capital Budgeting Decisions:
Distinguishing between the Investment Hurdle Rate and the Cost of Capital. Available at
SSRN 3019270.
⊘ This is a preview!⊘
Do you want full access?
Subscribe today to unlock all pages.
Trusted by 1+ million students worldwide
1 out of 12
Related Documents


Your All-in-One AI-Powered Toolkit for Academic Success.
+13062052269
info@desklib.com
Available 24*7 on WhatsApp / Email
![[object Object]](/_next/static/media/star-bottom.7253800d.svg)
Unlock your academic potential
Copyright © 2020–2026 A2Z Services. All Rights Reserved. Developed and managed by ZUCOL.