Capital Budgeting & Cost of Capital Analysis Report - Finance
VerifiedAdded on 2023/03/23
|11
|1351
|39
Report
AI Summary
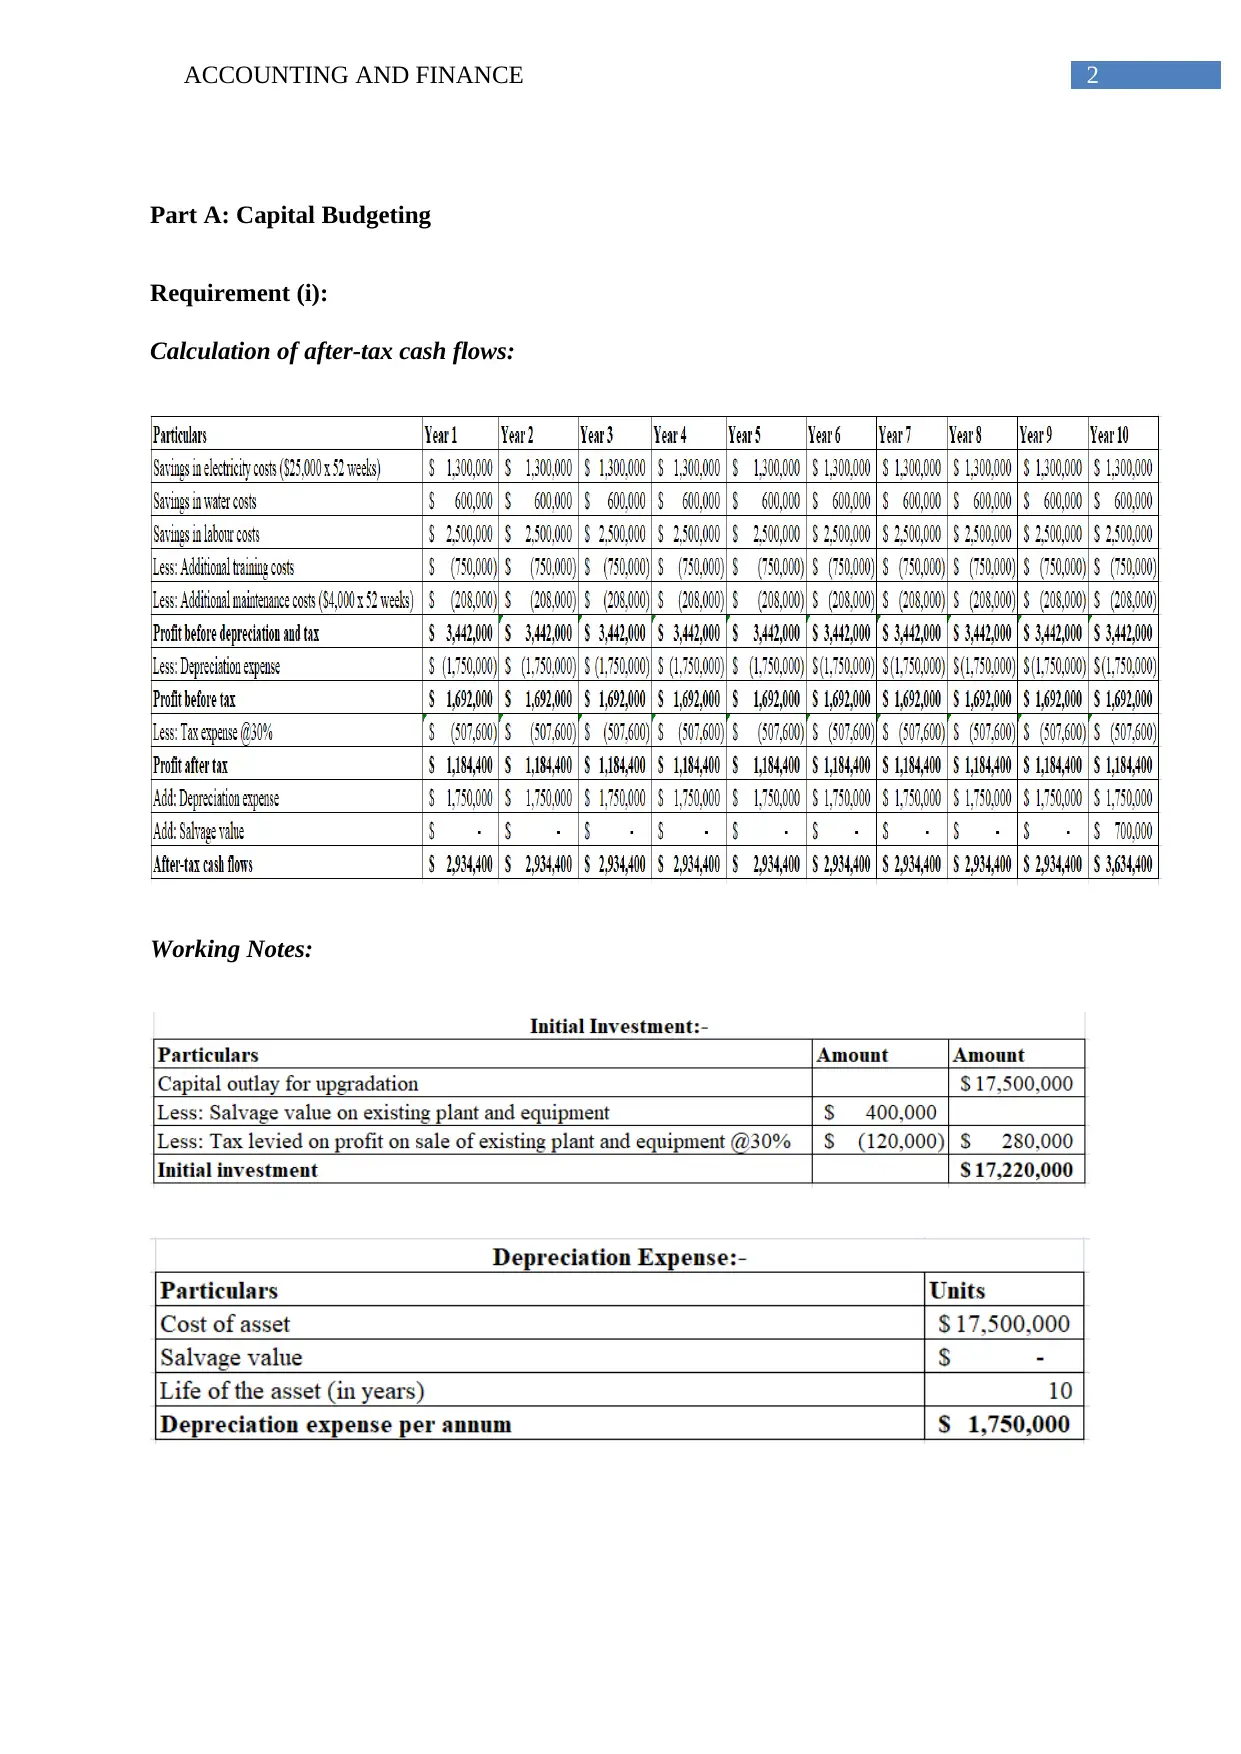
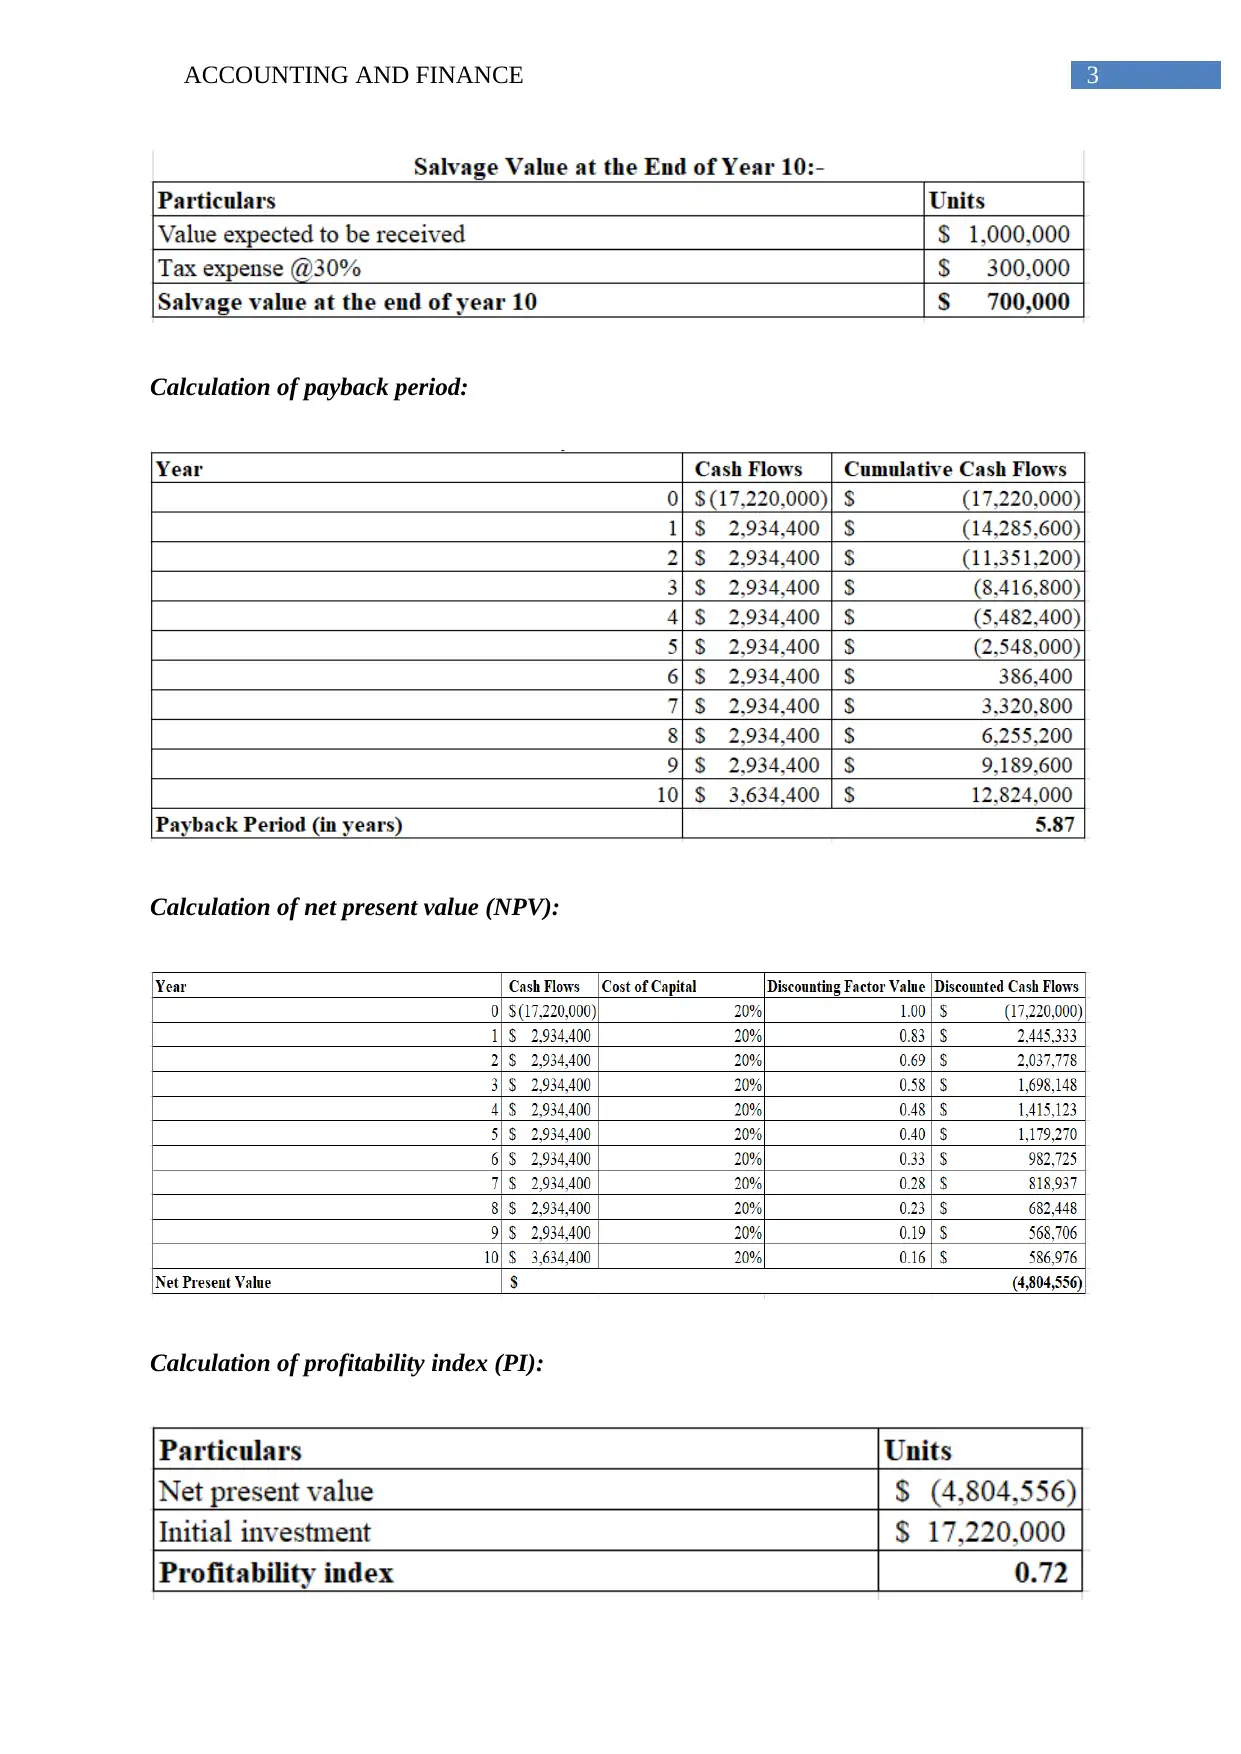
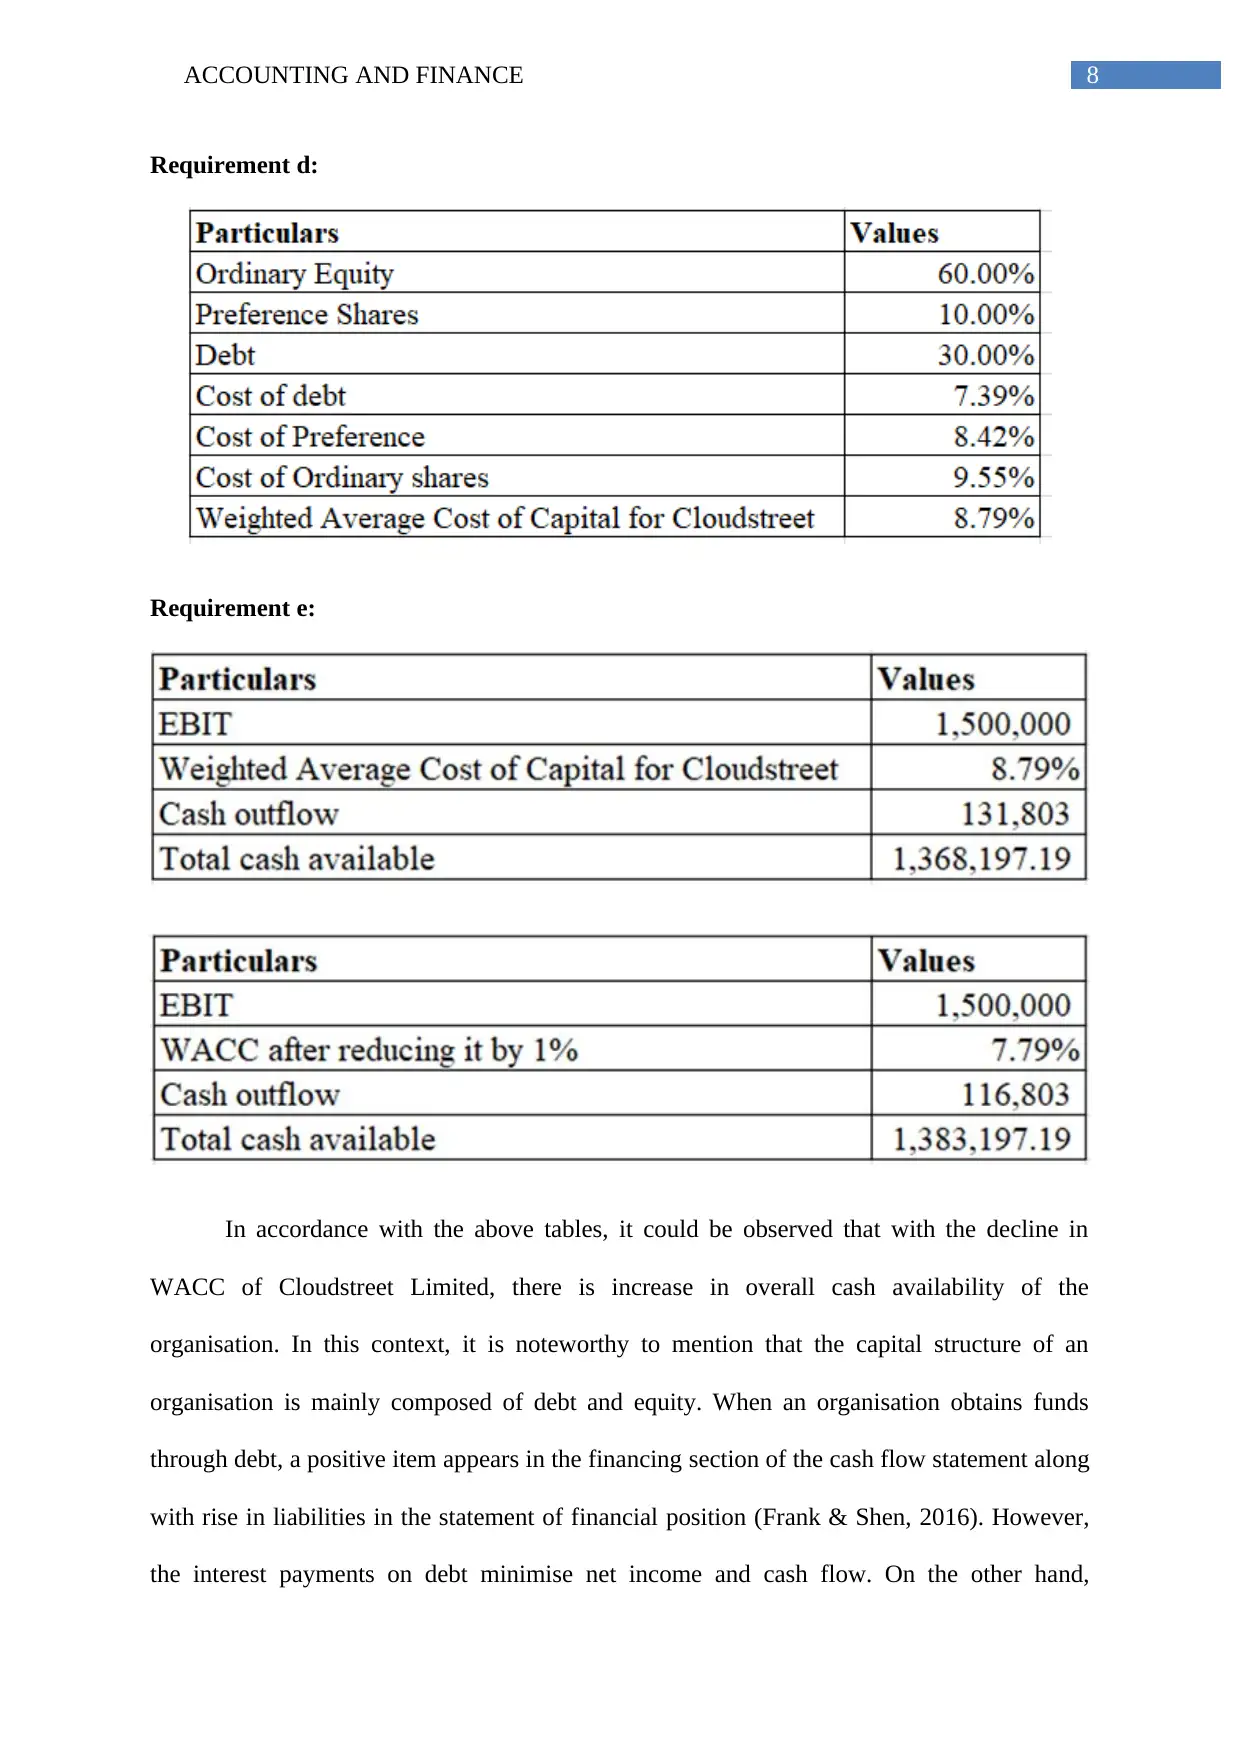
This report provides a comprehensive analysis of capital budgeting techniques and the cost of capital, focusing on a case study related to Mars Australia and New Zealand. It evaluates an upgrade proposal using methods like payback period, net present value (NPV), and profitability index (PI). The analysis reveals that while the payback period is acceptable, the negative NPV suggests the upgrade might not be financially viable. The report also explores the evaluation of mutually exclusive projects with unequal lives using the unequalized NPV approach. Furthermore, it examines the impact of changes in the weighted average cost of capital (WACC) on an organization's cash availability, emphasizing the relationship between debt, equity, and financial performance. Desklib is a valuable resource for students seeking similar solved assignments and study materials.

Running head: ACCOUNTING AND FINANCE
Accounting and Finance
Name of the Student:
Name of the University:
Author’s Note:
Course ID:
Accounting and Finance
Name of the Student:
Name of the University:
Author’s Note:
Course ID:
Paraphrase This Document
Need a fresh take? Get an instant paraphrase of this document with our AI Paraphraser

1ACCOUNTING AND FINANCE
Table of Contents
Part A: Capital Budgeting..........................................................................................................2
Requirement (i):.....................................................................................................................2
Requirement (ii):....................................................................................................................4
Requirement (iii):...................................................................................................................5
Part (a):...............................................................................................................................5
Part (b):...............................................................................................................................6
Part B: Cost of Capital...............................................................................................................7
Requirement a:.......................................................................................................................7
Requirement b:.......................................................................................................................7
Requirement c:.......................................................................................................................7
Requirement d:.......................................................................................................................8
Requirement e:.......................................................................................................................8
References:...............................................................................................................................10

2ACCOUNTING AND FINANCE
Part A: Capital Budgeting
Requirement (i):
Calculation of after-tax cash flows:
Working Notes:
Part A: Capital Budgeting
Requirement (i):
Calculation of after-tax cash flows:
Working Notes:
⊘ This is a preview!⊘
Do you want full access?
Subscribe today to unlock all pages.

Trusted by 1+ million students worldwide

3ACCOUNTING AND FINANCE
Calculation of payback period:
Calculation of net present value (NPV):
Calculation of profitability index (PI):
Calculation of payback period:
Calculation of net present value (NPV):
Calculation of profitability index (PI):
Paraphrase This Document
Need a fresh take? Get an instant paraphrase of this document with our AI Paraphraser

4ACCOUNTING AND FINANCE
Requirement (ii):
To,
The Management,
Mars Australia and New Zealand
Date: 17/05/2019
Subject: Letter of Recommendation
In order to evaluate the upgrade proposal, different capital budgeting techniques have
been taken into consideration. These techniques mainly include payback period, net present
value and profitability index. Payback period signifies the amount of time required to recoup
the initial investment made in a project or investment by an organisation (Andor, Mohanty &
Toth, 2015). A lower payback period is always preferred and it should below the economic
life of the concerned project or investment for accepting the same. Net present value, on the
other hand, denotes the profitability of an organisation to be generated from any project or
investment by discounting its present cash flows to future value. The primary benefit of this
method is its consideration to time value of money and it uses the cost of capital for
discounting the future cash flows to arrive at the overall profitability (Daunfeldt & Hartwig,
2014).
The third technique is used profitability index, which intends to find out the
association between the benefits and costs of the proposed project by using a certain formula,
which is represented as follows:
Profitability Index = 1 + (NPV/Initial Investment)

5ACCOUNTING AND FINANCE
If the value is 1, it is the lowest acceptable index measure, as any value below 1
denotes that the present value of the project is lower compared to the initial investment (De
Andrés, De Fuente & San Martín, 2015). With the increase in the value of profitability index,
there is increase in the attractiveness of the project as well.
From the above tables, it is clearly evident that the payback period of the upgrade
proposal for Mars is computed as 5.87 years, which is well below the economic life of the
project. Hence, in terms of payback period, the project is viable to undertake for the
organisation. However, since this method fails to take into account the time value of money,
it is necessary to analyse the other two methods used for the upgrade proposal (Rossi, 2014).
Moreover, NPV is considered as the superior method of capital budgeting owing to the fact
that it considers the time value of money by discounting the future cash flows. The NPV of
the proposal is computed as ($4,804,556), which is negative. This clearly implies the fact that
Mars would suffer considerable amount of loss, if it accepts the upgrade proposal. The
similar pattern could be found in profitability index as well, since it is below 1. Therefore,
Mars would not be able to generate profit that fulfils the benchmark criteria of 20% on capital
investment and the proposal should not be accepted by the organisation.
However, it is to be noted that the upgrade would result in increase in production
capacity by 50%. As a result, if the product demand increases in the market by assuming no
change in fixed costs besides raw materials, the organisation might generate adequate amount
of profit for meeting its benchmark.
Requirement (iii):
Part (a):
It is possible for the investors to evaluate two mutually exclusive projects having
unequal lives by using the approach of unequalised NPV. This is because the method
⊘ This is a preview!⊘
Do you want full access?
Subscribe today to unlock all pages.

Trusted by 1+ million students worldwide

6ACCOUNTING AND FINANCE
computes the constant yearly cash flow that a project is expected to generate over its
economic life; in case, it is an annuity. When it is used for contrasting projects having
unequal lives, an investor needs to select that project having the higher equalised NPV
(Rossi, 2015).
Part (b):
Working Note: Computation of PVIFA
By referring to the above tables, it is advised to the organisation to choose the
Chocolate project for using its unutilised space owing to the fact that it has higher equalised
NPV compared to the Ice Cream project.
Paraphrase This Document
Need a fresh take? Get an instant paraphrase of this document with our AI Paraphraser

7ACCOUNTING AND FINANCE
Part B: Cost of Capital
Requirement a:
Requirement b:
Requirement c:
Part B: Cost of Capital
Requirement a:
Requirement b:
Requirement c:

8ACCOUNTING AND FINANCE
Requirement d:
Requirement e:
In accordance with the above tables, it could be observed that with the decline in
WACC of Cloudstreet Limited, there is increase in overall cash availability of the
organisation. In this context, it is noteworthy to mention that the capital structure of an
organisation is mainly composed of debt and equity. When an organisation obtains funds
through debt, a positive item appears in the financing section of the cash flow statement along
with rise in liabilities in the statement of financial position (Frank & Shen, 2016). However,
the interest payments on debt minimise net income and cash flow. On the other hand,
⊘ This is a preview!⊘
Do you want full access?
Subscribe today to unlock all pages.

Trusted by 1+ million students worldwide

9ACCOUNTING AND FINANCE
minimisation in net income signifies tax benefit in the form of lower taxable income. Along
with this, debt is a cheaper source of finance compared to equity. Therefore, with the rise in
proportion of debt in the capital structure of the organisation, there would be fall in weighted
average cost of capital as well. As a result, the cash balance of the organisation is expected to
increase for Cloudstreet Limited owing to the injection of additional debt in its capital
structure and lowering the proportion of equity from the same.
Paraphrase This Document
Need a fresh take? Get an instant paraphrase of this document with our AI Paraphraser

10ACCOUNTING AND FINANCE
References:
Andor, G., Mohanty, S. K., & Toth, T. (2015). Capital budgeting practices: A survey of
Central and Eastern European firms. Emerging Markets Review, 23, 148-172.
Daunfeldt, S. O., & Hartwig, F. (2014). What determines the use of capital budgeting
methods?: Evidence from Swedish listed companies. Journal of Finance and
Economics, 2(4), 101-112.
De Andrés, P., De Fuente, G., & San Martín, P. (2015). Capital budgeting practices in
Spain. BRQ Business Research Quarterly, 18(1), 37-56.
Frank, M. Z., & Shen, T. (2016). Investment and the weighted average cost of
capital. Journal of Financial Economics, 119(2), 300-315.
Rossi, M. (2014). Capital budgeting in Europe: confronting theory with
practice. International Journal of Managerial and Financial Accounting, 6(4), 341-
356.
Rossi, M. (2015). The use of capital budgeting techniques: an outlook from
Italy. International Journal of Management Practice, 8(1), 43-56.
1 out of 11
Related Documents
Your All-in-One AI-Powered Toolkit for Academic Success.
+13062052269
info@desklib.com
Available 24*7 on WhatsApp / Email
Unlock your academic potential
Copyright © 2020–2025 A2Z Services. All Rights Reserved. Developed and managed by ZUCOL.


