Financial Analysis: Capital Budgeting for Printer Replacement at CQU
VerifiedAdded on 2020/05/16
|23
|3336
|151
Report
AI Summary
This report provides a comprehensive analysis of capital budgeting techniques applied to the decision of replacing printers at CQU Printing. The report evaluates two printer options (Printer A and Printer B) using Net Present Value (NPV), Payback Period, and Internal Rate of Return (IRR) methods. It includes detailed calculations of initial investments, operating cash flows, and terminal cash flows for each printer. The analysis compares the financial performance of each printer based on the different capital budgeting techniques, and provides a graphical representation of the IRR profiles with NPVs. The report concludes that Printer B is the more favorable investment option, as it demonstrates more positive outcomes across the various financial metrics. The report also addresses decision-making under different scenarios, such as unlimited funds.
Running Head: Appraisal of Capital Investments
Capital Budgeting Decisions
Capital Budgeting Decisions
Paraphrase This Document
Need a fresh take? Get an instant paraphrase of this document with our AI Paraphraser
Appraisal of Capital Investments 1
Executive summary:
In this report, various capital budgeting techniques have been discussed and applied to reach at a
conclusion regarding the decision of replacement of printers held as asset by CQU printing firm
which is engaged in the business of commercial printing. The firm is considering the
replacement the old printer with the new printer to improve the quality of printing and the
operational efficiency. However, there are two choices of printer available in the market and the
firm has to select the best suitable option on the basis of rankings given using various capital
budgeting techniques such as Net present value, Payback period, Internal rate of return etc. In
this report each of these capital investment proposals have been critically evaluated and it is
observed that the firm must go with the option of Printer B as it has more favorable results than
Printer A.
Appraisal of Capital Investments 2
Table of Contents
Executive summary.....................................................................................................................................1
Introduction.................................................................................................................................................3
Part A..........................................................................................................................................................3
1. Initial investment.............................................................................................................................3
2. Operating cash flows.......................................................................................................................5
3. Terminal cash flows.........................................................................................................................7
Part B...........................................................................................................................................................8
Cash flow streams....................................................................................................................................8
Part C.........................................................................................................................................................10
1. Payback Period..............................................................................................................................10
2. Net Present Value..........................................................................................................................11
3. Internal Rate of return....................................................................................................................13
Part d.........................................................................................................................................................15
Graphical representation of IRR profiles with NPVs.............................................................................15
Part e......................................................................................................................................................17
i. Conflicts of results.....................................................................................................................17
ii. Decision making under the different situations..........................................................................17
Part f..........................................................................................................................................................18
Conclusion.................................................................................................................................................19
References.................................................................................................................................................20
Appendices................................................................................................................................................22
⊘ This is a preview!⊘
Do you want full access?
Subscribe today to unlock all pages.
Trusted by 1+ million students worldwide
Appraisal of Capital Investments 3
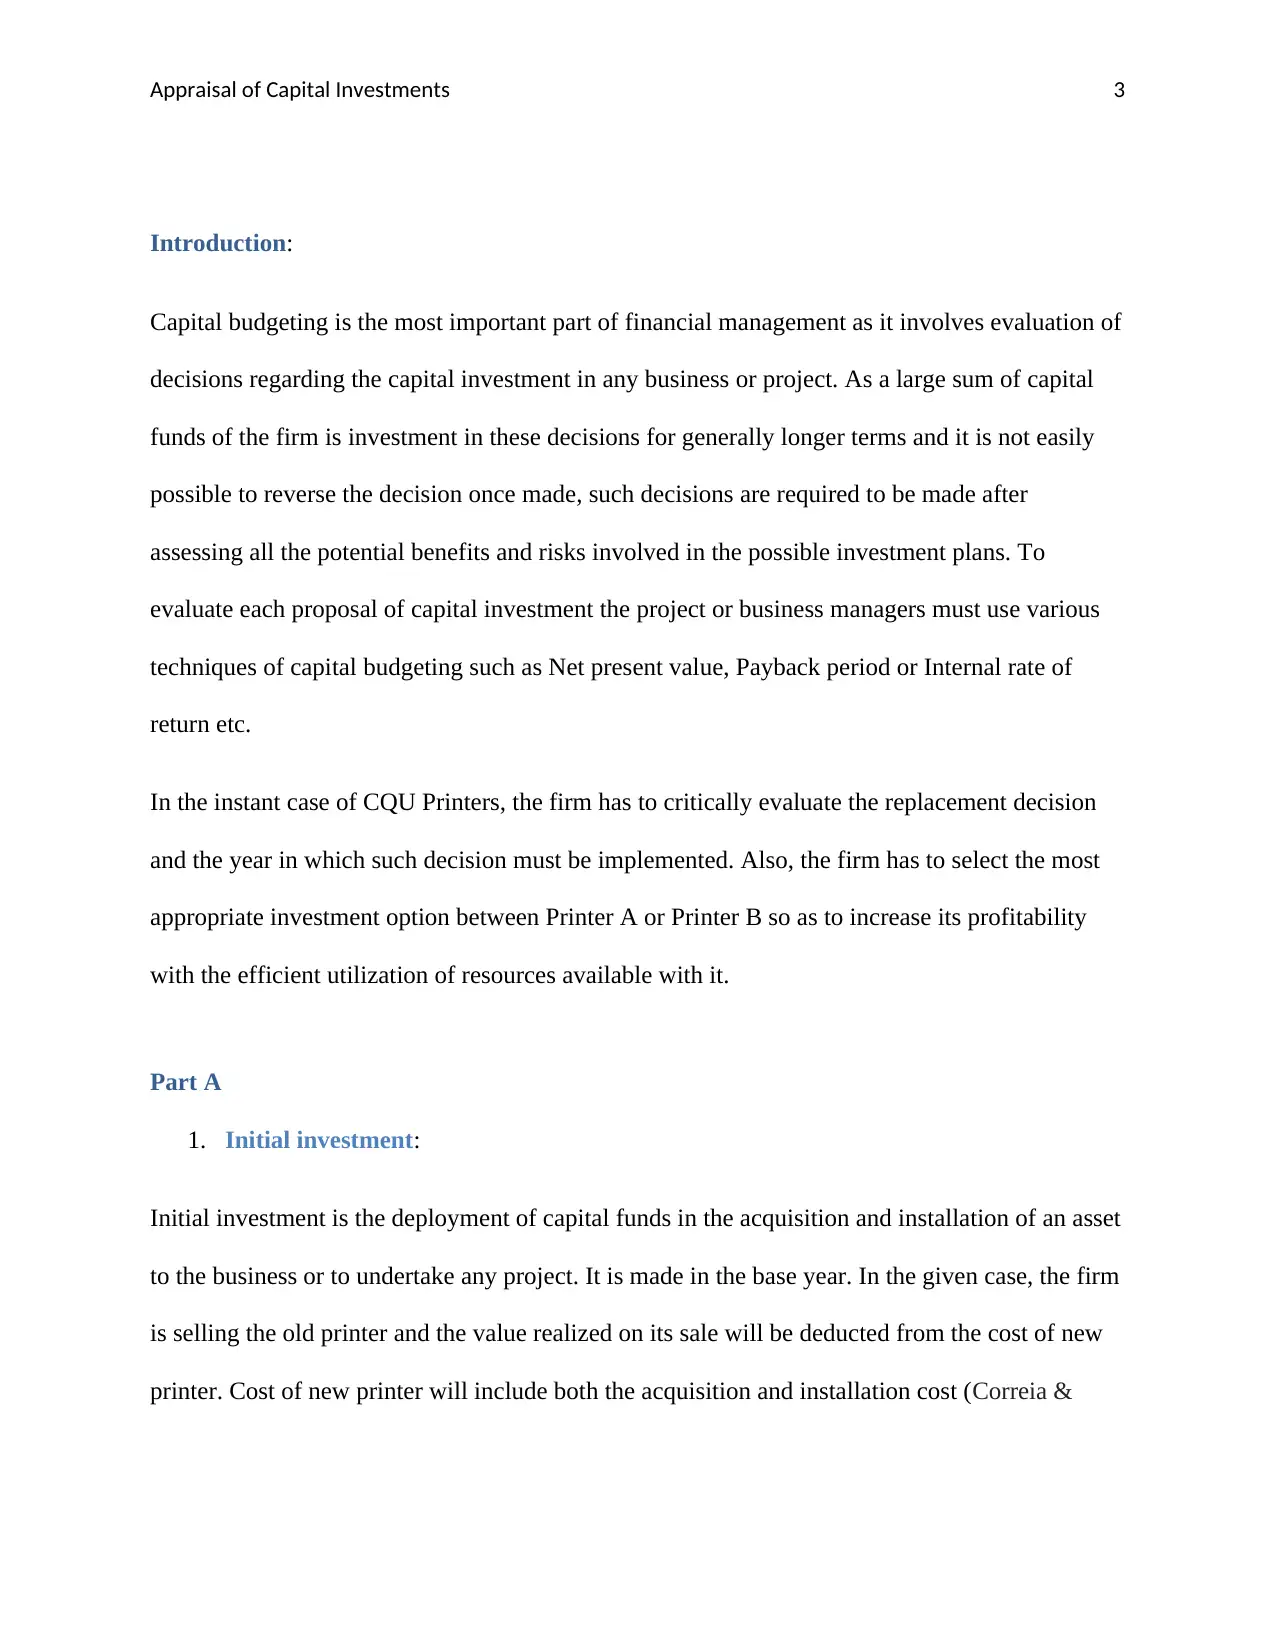
Introduction:
Capital budgeting is the most important part of financial management as it involves evaluation of
decisions regarding the capital investment in any business or project. As a large sum of capital
funds of the firm is investment in these decisions for generally longer terms and it is not easily
possible to reverse the decision once made, such decisions are required to be made after
assessing all the potential benefits and risks involved in the possible investment plans. To
evaluate each proposal of capital investment the project or business managers must use various
techniques of capital budgeting such as Net present value, Payback period or Internal rate of
return etc.
In the instant case of CQU Printers, the firm has to critically evaluate the replacement decision
and the year in which such decision must be implemented. Also, the firm has to select the most
appropriate investment option between Printer A or Printer B so as to increase its profitability
with the efficient utilization of resources available with it.
Part A
1. Initial investment:
Initial investment is the deployment of capital funds in the acquisition and installation of an asset
to the business or to undertake any project. It is made in the base year. In the given case, the firm
is selling the old printer and the value realized on its sale will be deducted from the cost of new
printer. Cost of new printer will include both the acquisition and installation cost (Correia &
Paraphrase This Document
Need a fresh take? Get an instant paraphrase of this document with our AI Paraphraser
Appraisal of Capital Investments 4
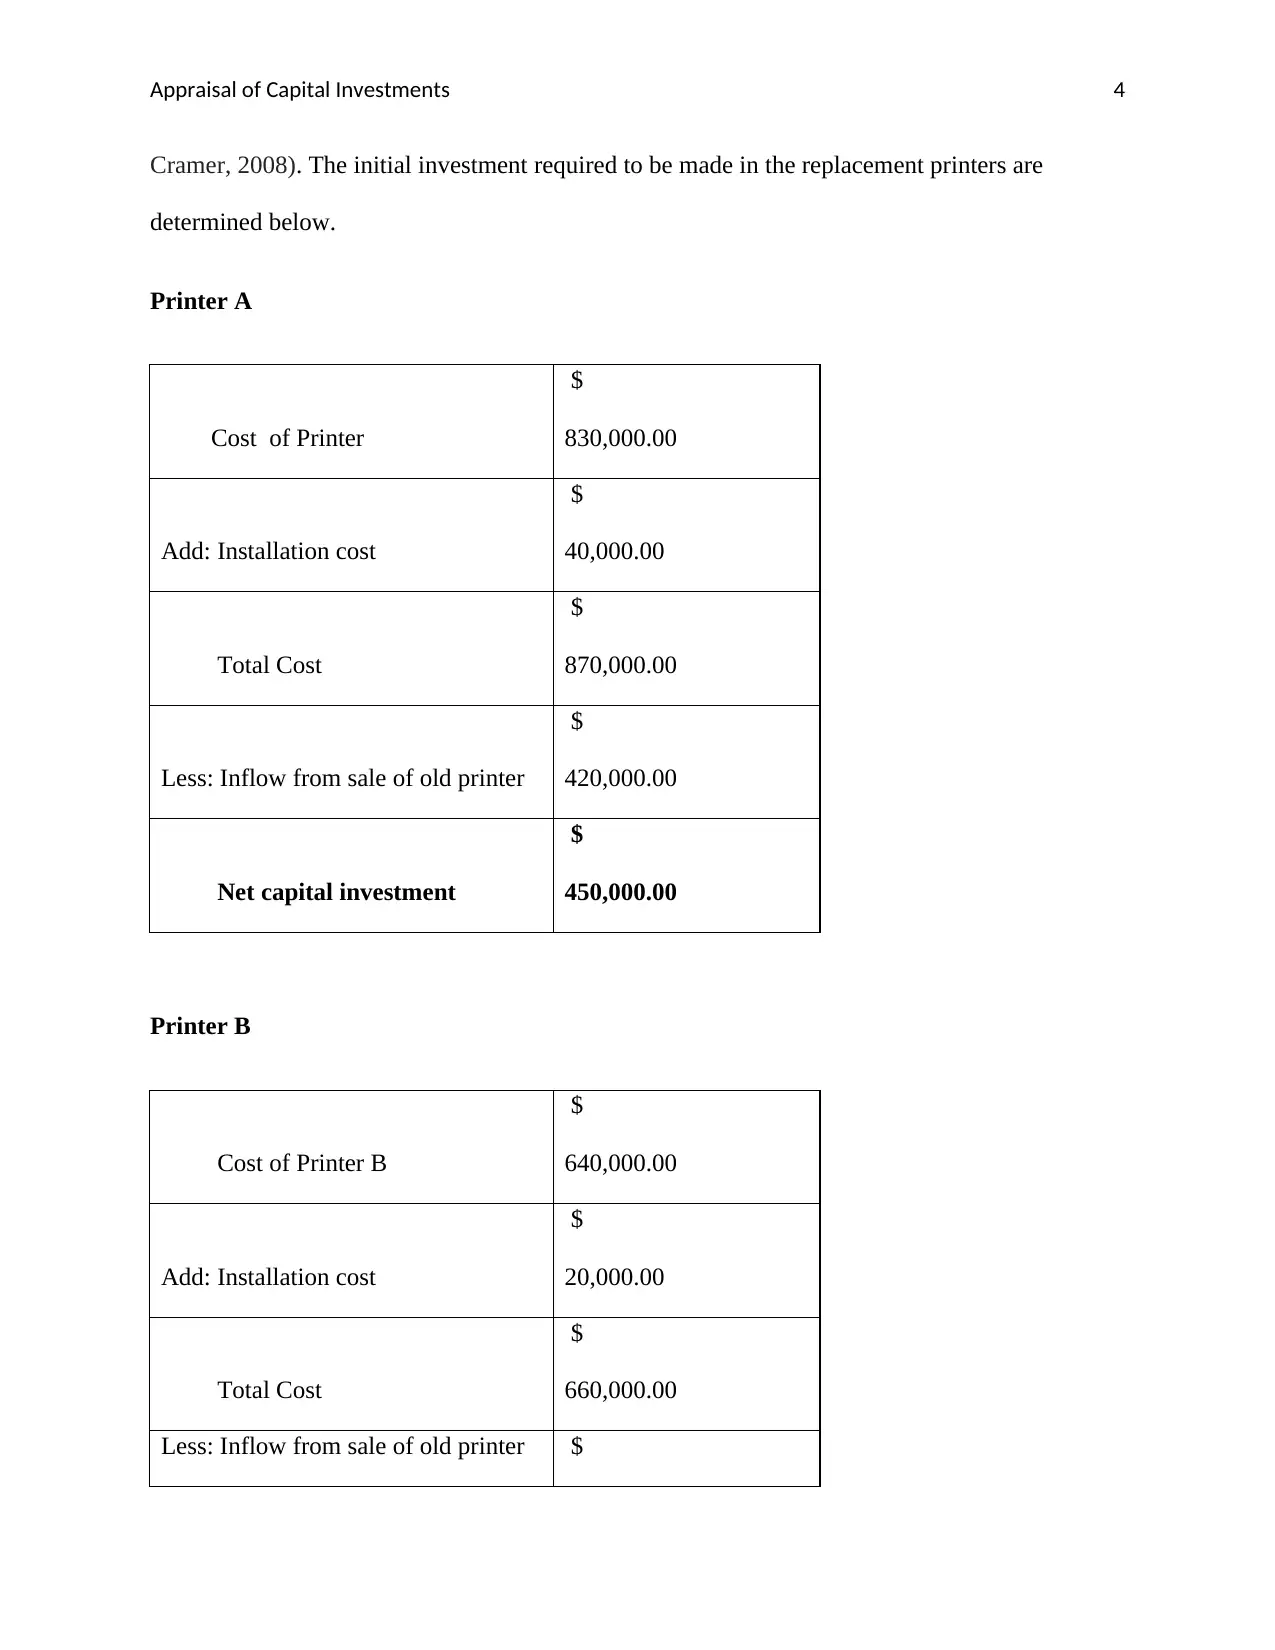
Cramer, 2008). The initial investment required to be made in the replacement printers are
determined below.
Printer A
Cost of Printer
$
830,000.00
Add: Installation cost
$
40,000.00
Total Cost
$
870,000.00
Less: Inflow from sale of old printer
$
420,000.00
Net capital investment
$
450,000.00
Printer B
Cost of Printer B
$
640,000.00
Add: Installation cost
$
20,000.00
Total Cost
$
660,000.00
Less: Inflow from sale of old printer $
Appraisal of Capital Investments 5
420,000.00
Net capital investment
$
240,000.00
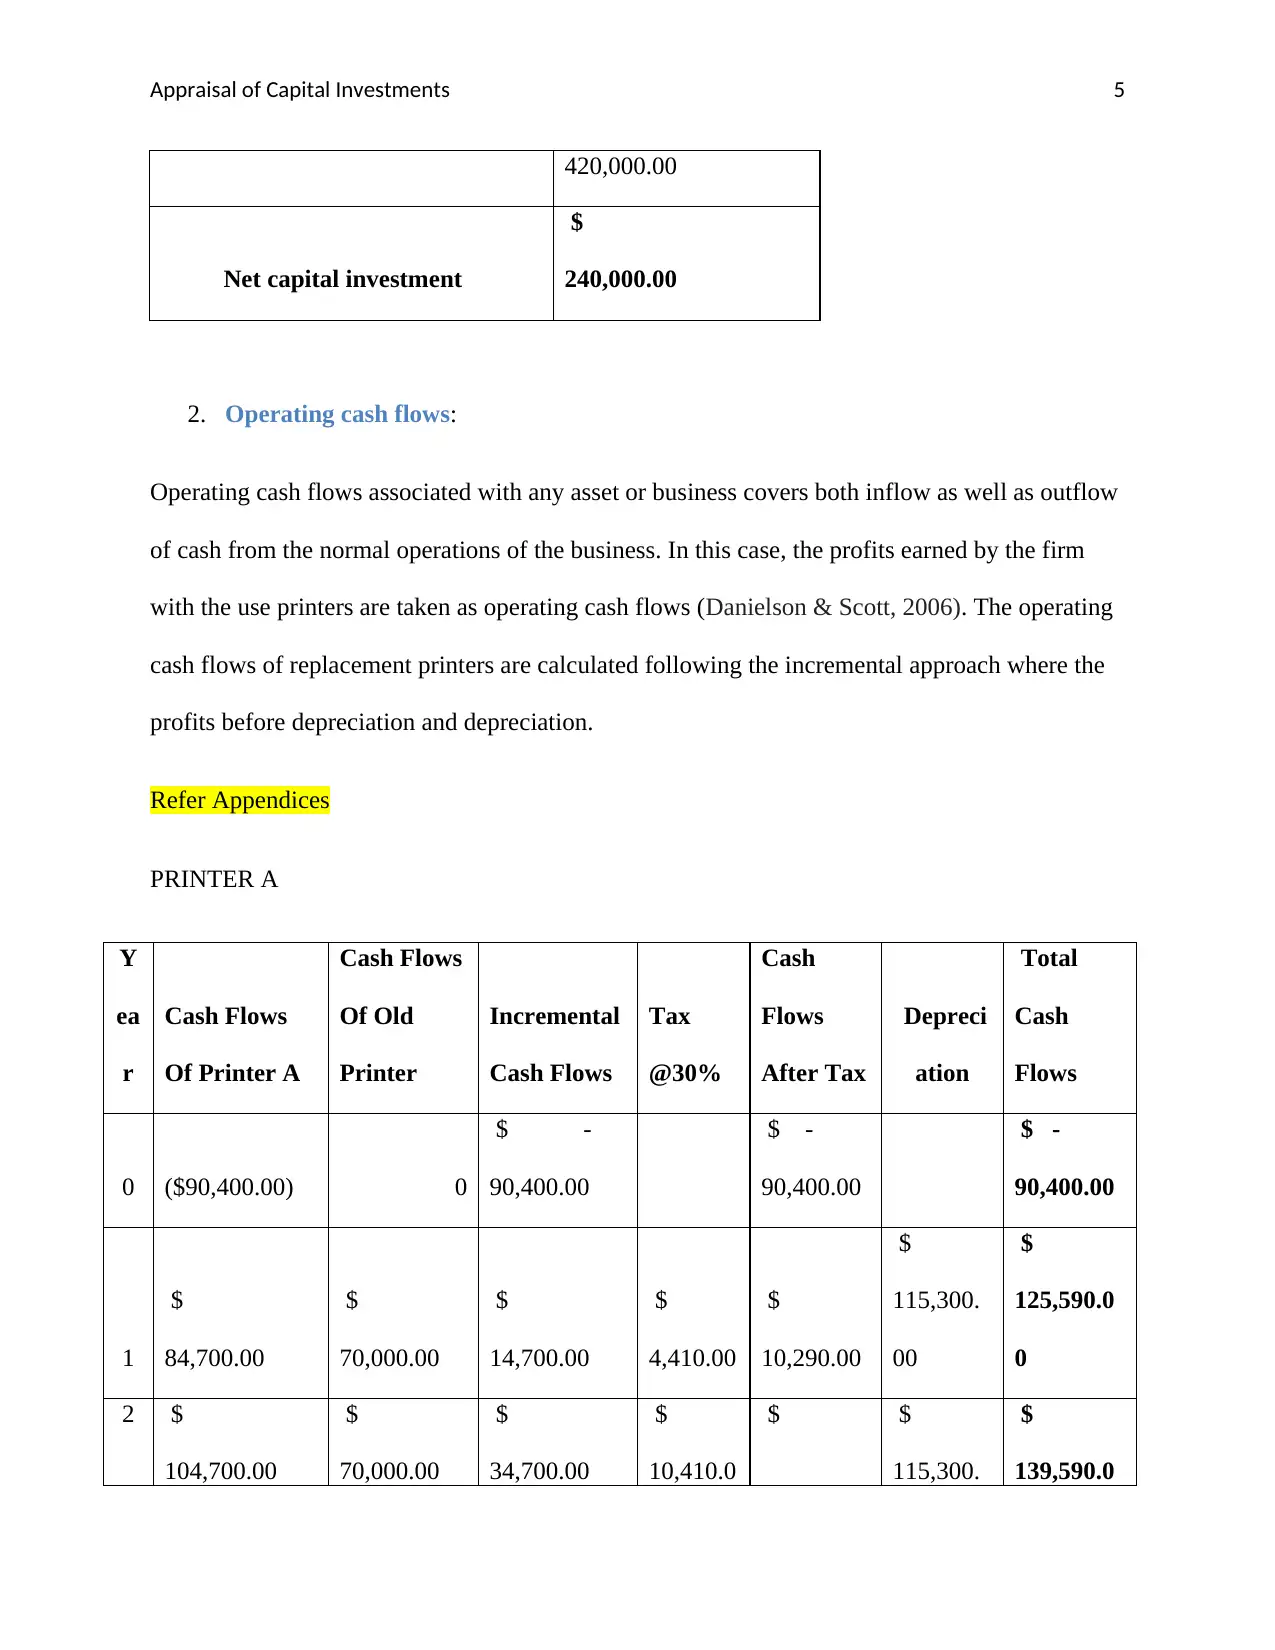
2. Operating cash flows:
Operating cash flows associated with any asset or business covers both inflow as well as outflow
of cash from the normal operations of the business. In this case, the profits earned by the firm
with the use printers are taken as operating cash flows (Danielson & Scott, 2006). The operating
cash flows of replacement printers are calculated following the incremental approach where the
profits before depreciation and depreciation.
Refer Appendices
PRINTER A
Y
ea
r
Cash Flows
Of Printer A
Cash Flows
Of Old
Printer
Incremental
Cash Flows
Tax
@30%
Cash
Flows
After Tax
Depreci
ation
Total
Cash
Flows
0 ($90,400.00) 0
$ -
90,400.00
$ -
90,400.00
$ -
90,400.00
1
$
84,700.00
$
70,000.00
$
14,700.00
$
4,410.00
$
10,290.00
$
115,300.
00
$
125,590.0
0
2 $
104,700.00
$
70,000.00
$
34,700.00
$
10,410.0
$ $
115,300.
$
139,590.0
420,000.00
Net capital investment
$
240,000.00
2. Operating cash flows:
Operating cash flows associated with any asset or business covers both inflow as well as outflow
of cash from the normal operations of the business. In this case, the profits earned by the firm
with the use printers are taken as operating cash flows (Danielson & Scott, 2006). The operating
cash flows of replacement printers are calculated following the incremental approach where the
profits before depreciation and depreciation.
Refer Appendices
PRINTER A
Y
ea
r
Cash Flows
Of Printer A
Cash Flows
Of Old
Printer
Incremental
Cash Flows
Tax
@30%
Cash
Flows
After Tax
Depreci
ation
Total
Cash
Flows
0 ($90,400.00) 0
$ -
90,400.00
$ -
90,400.00
$ -
90,400.00
1
$
84,700.00
$
70,000.00
$
14,700.00
$
4,410.00
$
10,290.00
$
115,300.
00
$
125,590.0
0
2 $
104,700.00
$
70,000.00
$
34,700.00
$
10,410.0
$ $
115,300.
$
139,590.0
⊘ This is a preview!⊘
Do you want full access?
Subscribe today to unlock all pages.
Trusted by 1+ million students worldwide
Appraisal of Capital Investments 6
0 24,290.00 00 0
3
$
134,700.00
$
70,000.00
$
64,700.00
$
19,410.0
0
$
45,290.00
$
115,300.
00
$
160,590.0
0
4
$
164,700.00
$
70,000.00
$
94,700.00
$
28,410.0
0
$
66,290.00
$
115,300.
00
$
181,590.0
0
5
$
204,700.00
$
70,000.00
$
134,700.00
$
40,410.0
0
$
94,290.00
$
115,300.
00
$
209,590.0
0
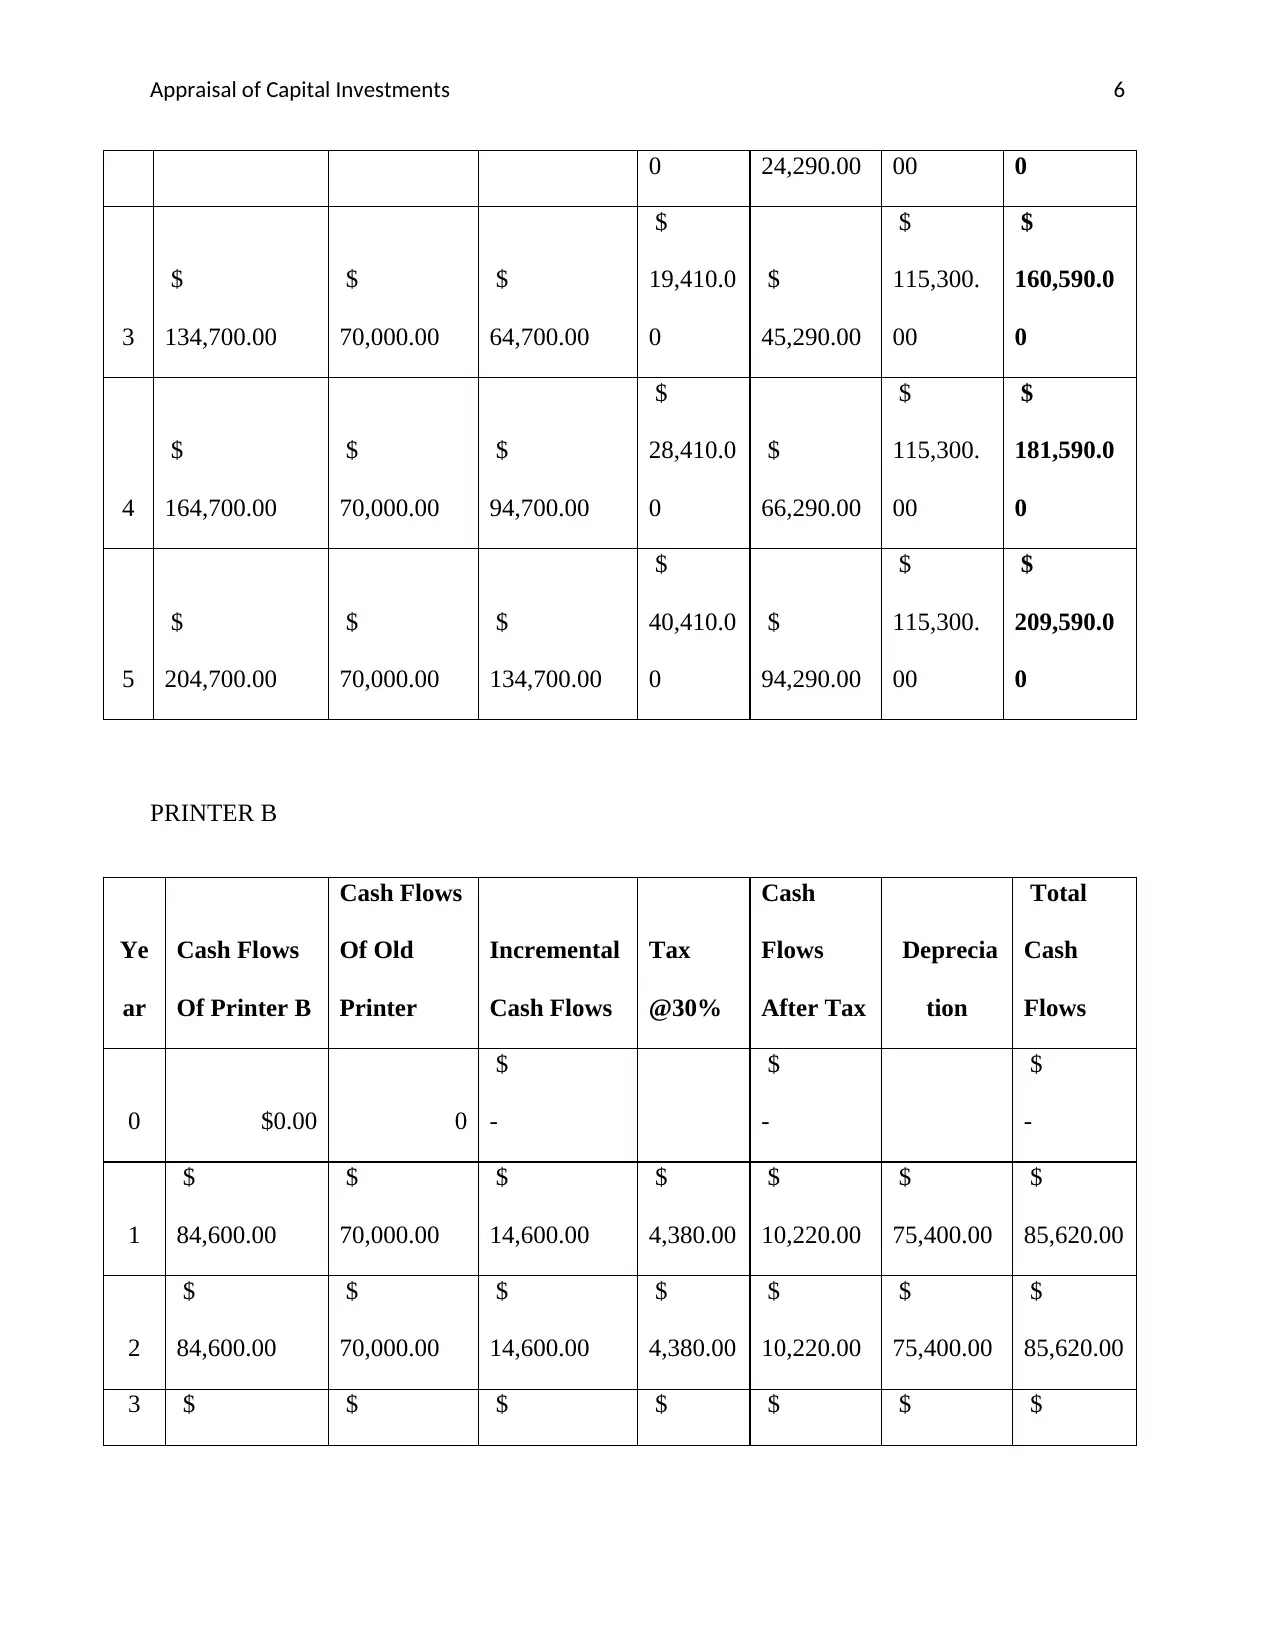
PRINTER B
Ye
ar
Cash Flows
Of Printer B
Cash Flows
Of Old
Printer
Incremental
Cash Flows
Tax
@30%
Cash
Flows
After Tax
Deprecia
tion
Total
Cash
Flows
0 $0.00 0
$
-
$
-
$
-
1
$
84,600.00
$
70,000.00
$
14,600.00
$
4,380.00
$
10,220.00
$
75,400.00
$
85,620.00
2
$
84,600.00
$
70,000.00
$
14,600.00
$
4,380.00
$
10,220.00
$
75,400.00
$
85,620.00
3 $ $ $ $ $ $ $
0 24,290.00 00 0
3
$
134,700.00
$
70,000.00
$
64,700.00
$
19,410.0
0
$
45,290.00
$
115,300.
00
$
160,590.0
0
4
$
164,700.00
$
70,000.00
$
94,700.00
$
28,410.0
0
$
66,290.00
$
115,300.
00
$
181,590.0
0
5
$
204,700.00
$
70,000.00
$
134,700.00
$
40,410.0
0
$
94,290.00
$
115,300.
00
$
209,590.0
0
PRINTER B
Ye
ar
Cash Flows
Of Printer B
Cash Flows
Of Old
Printer
Incremental
Cash Flows
Tax
@30%
Cash
Flows
After Tax
Deprecia
tion
Total
Cash
Flows
0 $0.00 0
$
-
$
-
$
-
1
$
84,600.00
$
70,000.00
$
14,600.00
$
4,380.00
$
10,220.00
$
75,400.00
$
85,620.00
2
$
84,600.00
$
70,000.00
$
14,600.00
$
4,380.00
$
10,220.00
$
75,400.00
$
85,620.00
3 $ $ $ $ $ $ $
Paraphrase This Document
Need a fresh take? Get an instant paraphrase of this document with our AI Paraphraser
Appraisal of Capital Investments 7
84,600.00 70,000.00 14,600.00 4,380.00 10,220.00 75,400.00 85,620.00
4
$
84,600.00
$
70,000.00
$
14,600.00
$
4,380.00
$
10,220.00
$
75,400.00
$
85,620.00
5
$
84,600.00
$
70,000.00
$
14,600.00
$
4,380.00
$
10,220.00
$
75,400.00
$
85,620.00
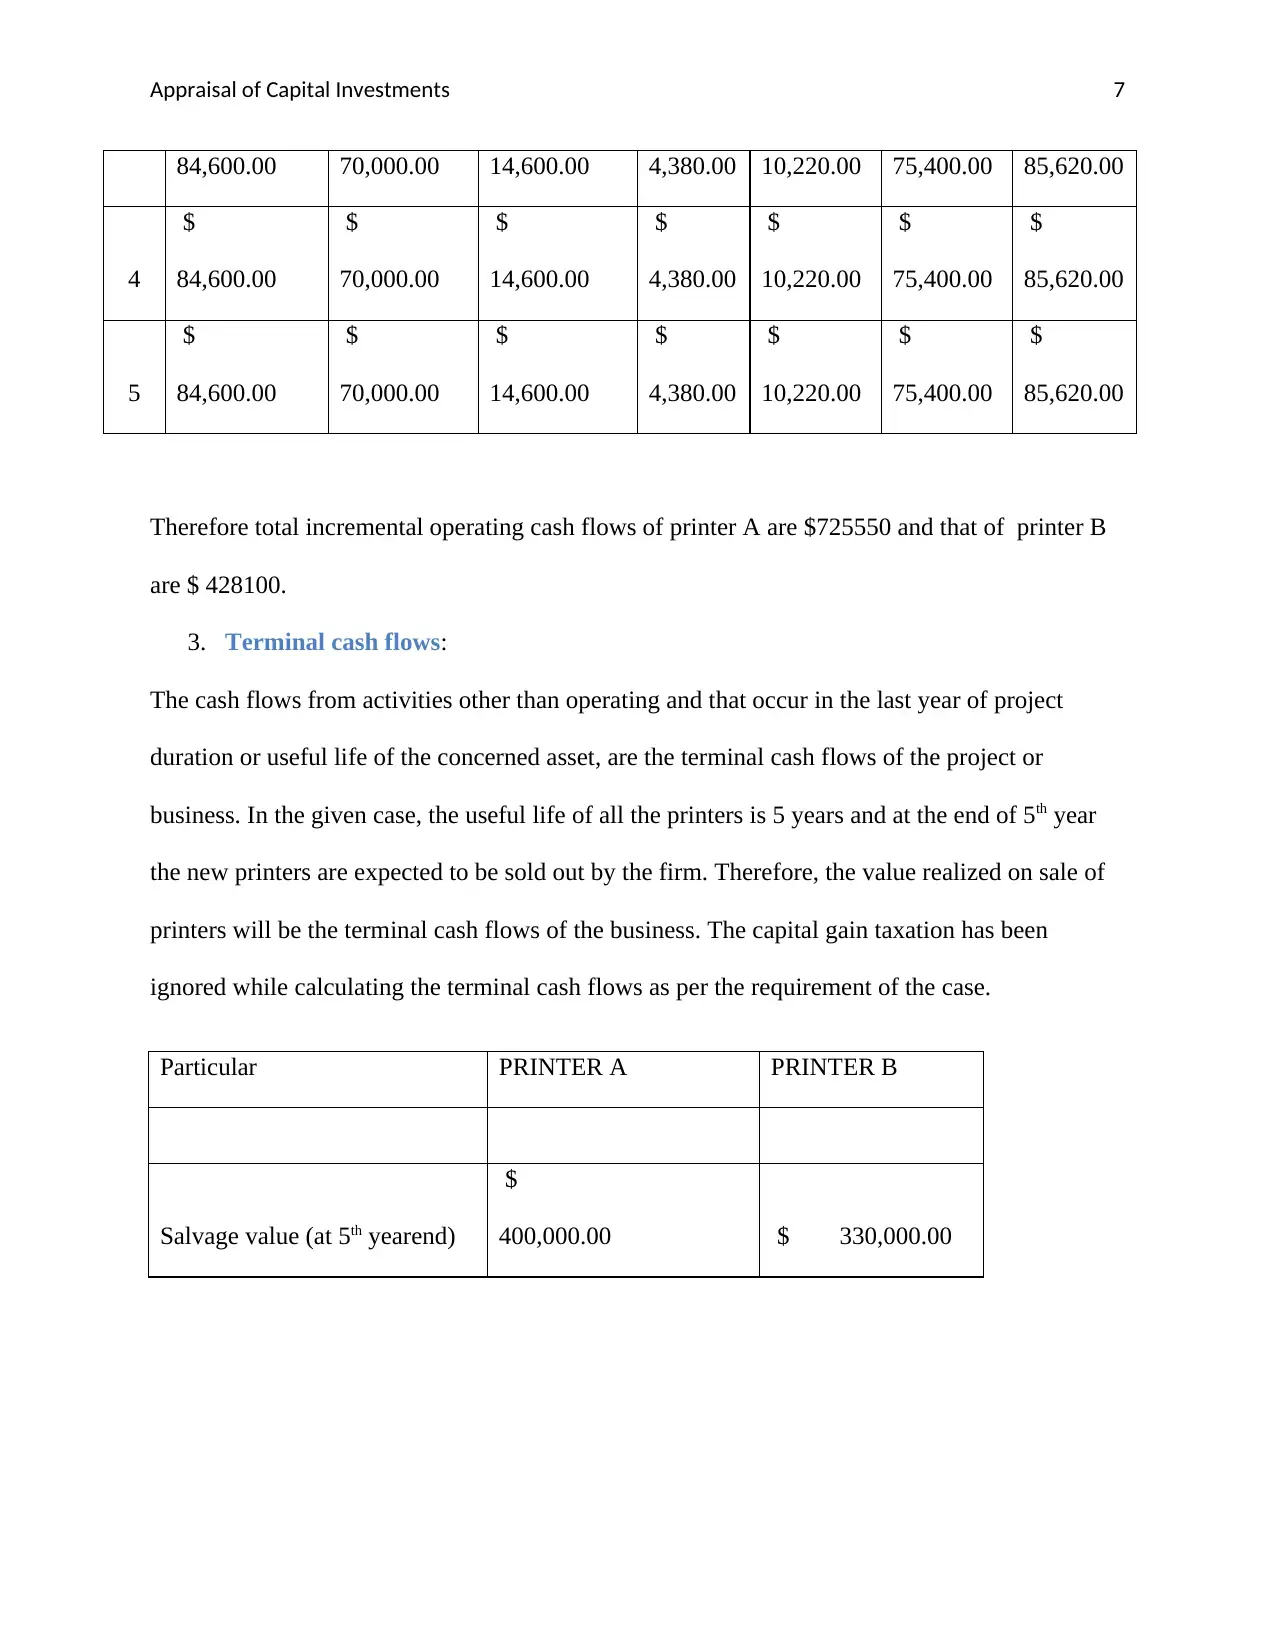
Therefore total incremental operating cash flows of printer A are $725550 and that of printer B
are $ 428100.
3. Terminal cash flows:
The cash flows from activities other than operating and that occur in the last year of project
duration or useful life of the concerned asset, are the terminal cash flows of the project or
business. In the given case, the useful life of all the printers is 5 years and at the end of 5th year
the new printers are expected to be sold out by the firm. Therefore, the value realized on sale of
printers will be the terminal cash flows of the business. The capital gain taxation has been
ignored while calculating the terminal cash flows as per the requirement of the case.
Particular PRINTER A PRINTER B
Salvage value (at 5th yearend)
$
400,000.00 $ 330,000.00
84,600.00 70,000.00 14,600.00 4,380.00 10,220.00 75,400.00 85,620.00
4
$
84,600.00
$
70,000.00
$
14,600.00
$
4,380.00
$
10,220.00
$
75,400.00
$
85,620.00
5
$
84,600.00
$
70,000.00
$
14,600.00
$
4,380.00
$
10,220.00
$
75,400.00
$
85,620.00
Therefore total incremental operating cash flows of printer A are $725550 and that of printer B
are $ 428100.
3. Terminal cash flows:
The cash flows from activities other than operating and that occur in the last year of project
duration or useful life of the concerned asset, are the terminal cash flows of the project or
business. In the given case, the useful life of all the printers is 5 years and at the end of 5th year
the new printers are expected to be sold out by the firm. Therefore, the value realized on sale of
printers will be the terminal cash flows of the business. The capital gain taxation has been
ignored while calculating the terminal cash flows as per the requirement of the case.
Particular PRINTER A PRINTER B
Salvage value (at 5th yearend)
$
400,000.00 $ 330,000.00
Appraisal of Capital Investments 8
Part B
Cash flow streams
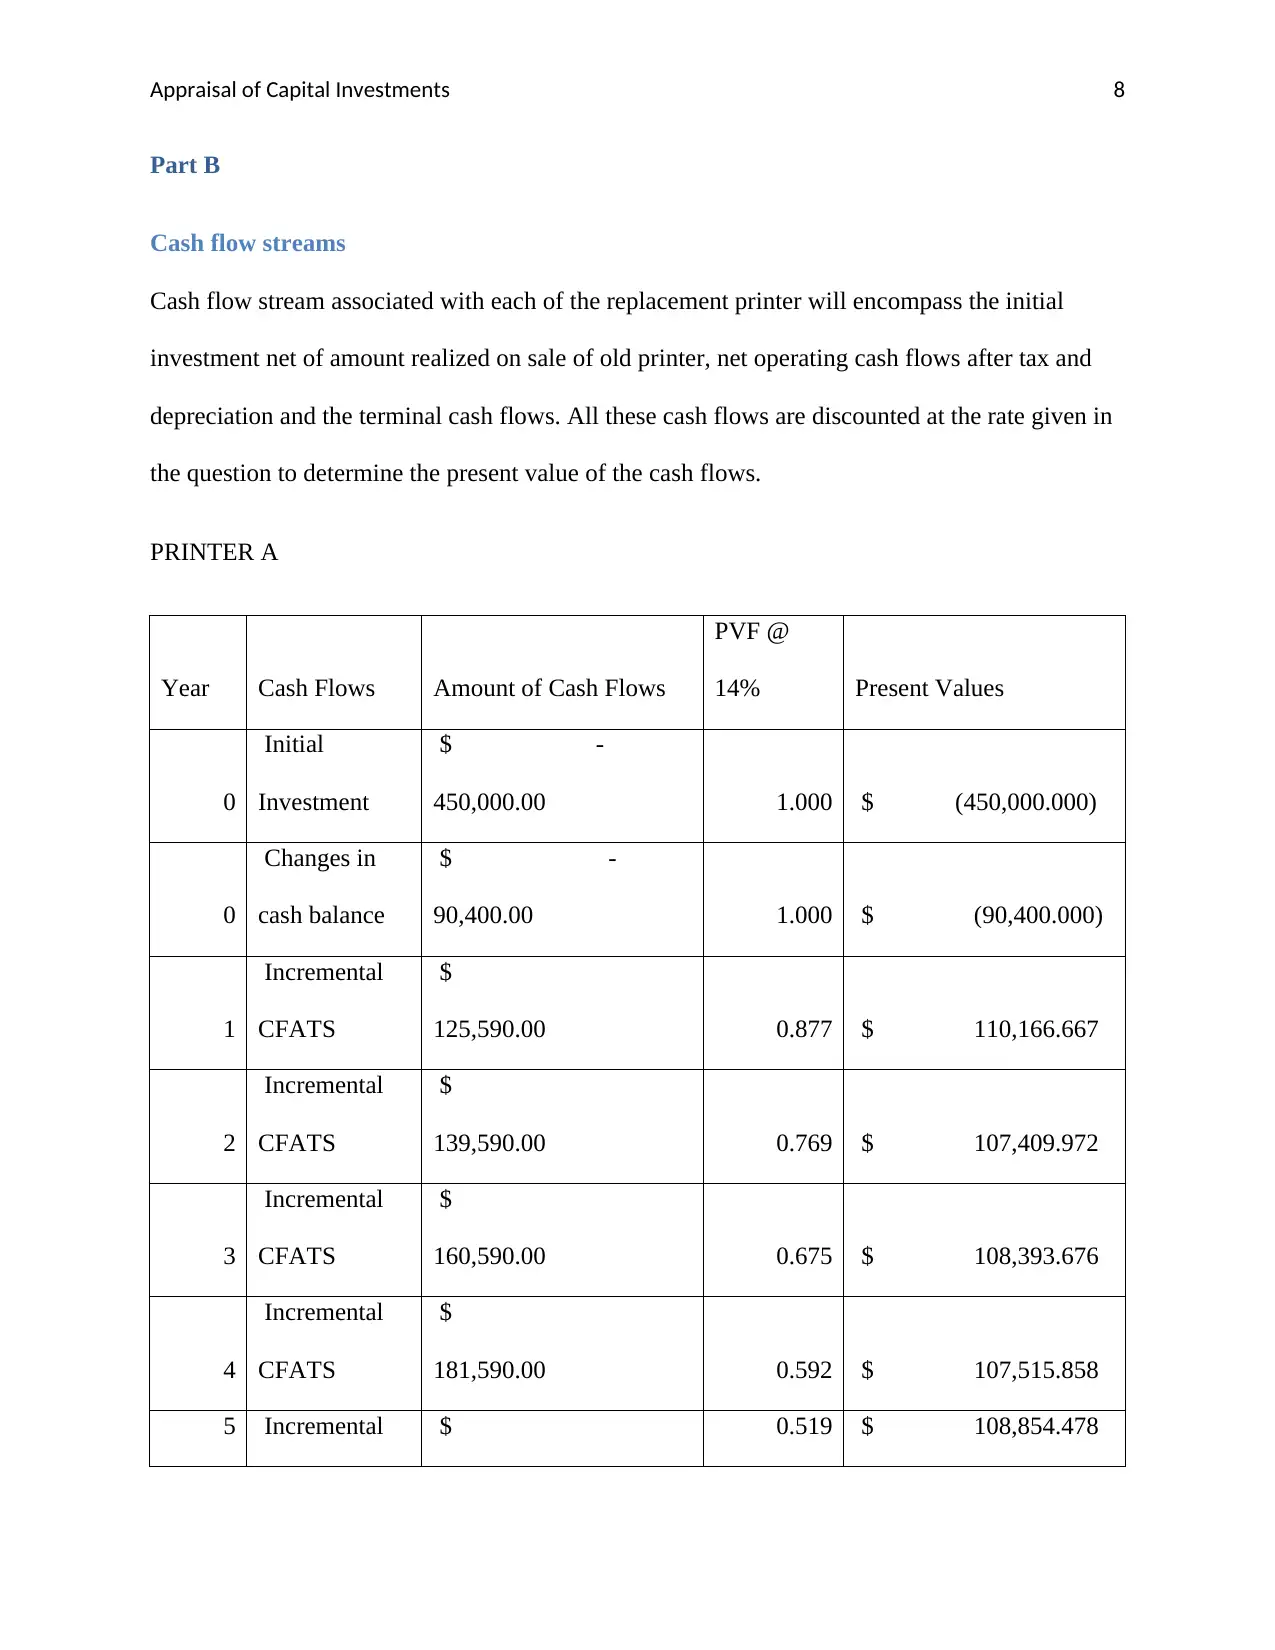
Cash flow stream associated with each of the replacement printer will encompass the initial
investment net of amount realized on sale of old printer, net operating cash flows after tax and
depreciation and the terminal cash flows. All these cash flows are discounted at the rate given in
the question to determine the present value of the cash flows.
PRINTER A
Year Cash Flows Amount of Cash Flows
PVF @
14% Present Values
0
Initial
Investment
$ -
450,000.00 1.000 $ (450,000.000)
0
Changes in
cash balance
$ -
90,400.00 1.000 $ (90,400.000)
1
Incremental
CFATS
$
125,590.00 0.877 $ 110,166.667
2
Incremental
CFATS
$
139,590.00 0.769 $ 107,409.972
3
Incremental
CFATS
$
160,590.00 0.675 $ 108,393.676
4
Incremental
CFATS
$
181,590.00 0.592 $ 107,515.858
5 Incremental $ 0.519 $ 108,854.478
Part B
Cash flow streams
Cash flow stream associated with each of the replacement printer will encompass the initial
investment net of amount realized on sale of old printer, net operating cash flows after tax and
depreciation and the terminal cash flows. All these cash flows are discounted at the rate given in
the question to determine the present value of the cash flows.
PRINTER A
Year Cash Flows Amount of Cash Flows
PVF @
14% Present Values
0
Initial
Investment
$ -
450,000.00 1.000 $ (450,000.000)
0
Changes in
cash balance
$ -
90,400.00 1.000 $ (90,400.000)
1
Incremental
CFATS
$
125,590.00 0.877 $ 110,166.667
2
Incremental
CFATS
$
139,590.00 0.769 $ 107,409.972
3
Incremental
CFATS
$
160,590.00 0.675 $ 108,393.676
4
Incremental
CFATS
$
181,590.00 0.592 $ 107,515.858
5 Incremental $ 0.519 $ 108,854.478
⊘ This is a preview!⊘
Do you want full access?
Subscribe today to unlock all pages.
Trusted by 1+ million students worldwide
Appraisal of Capital Investments 9
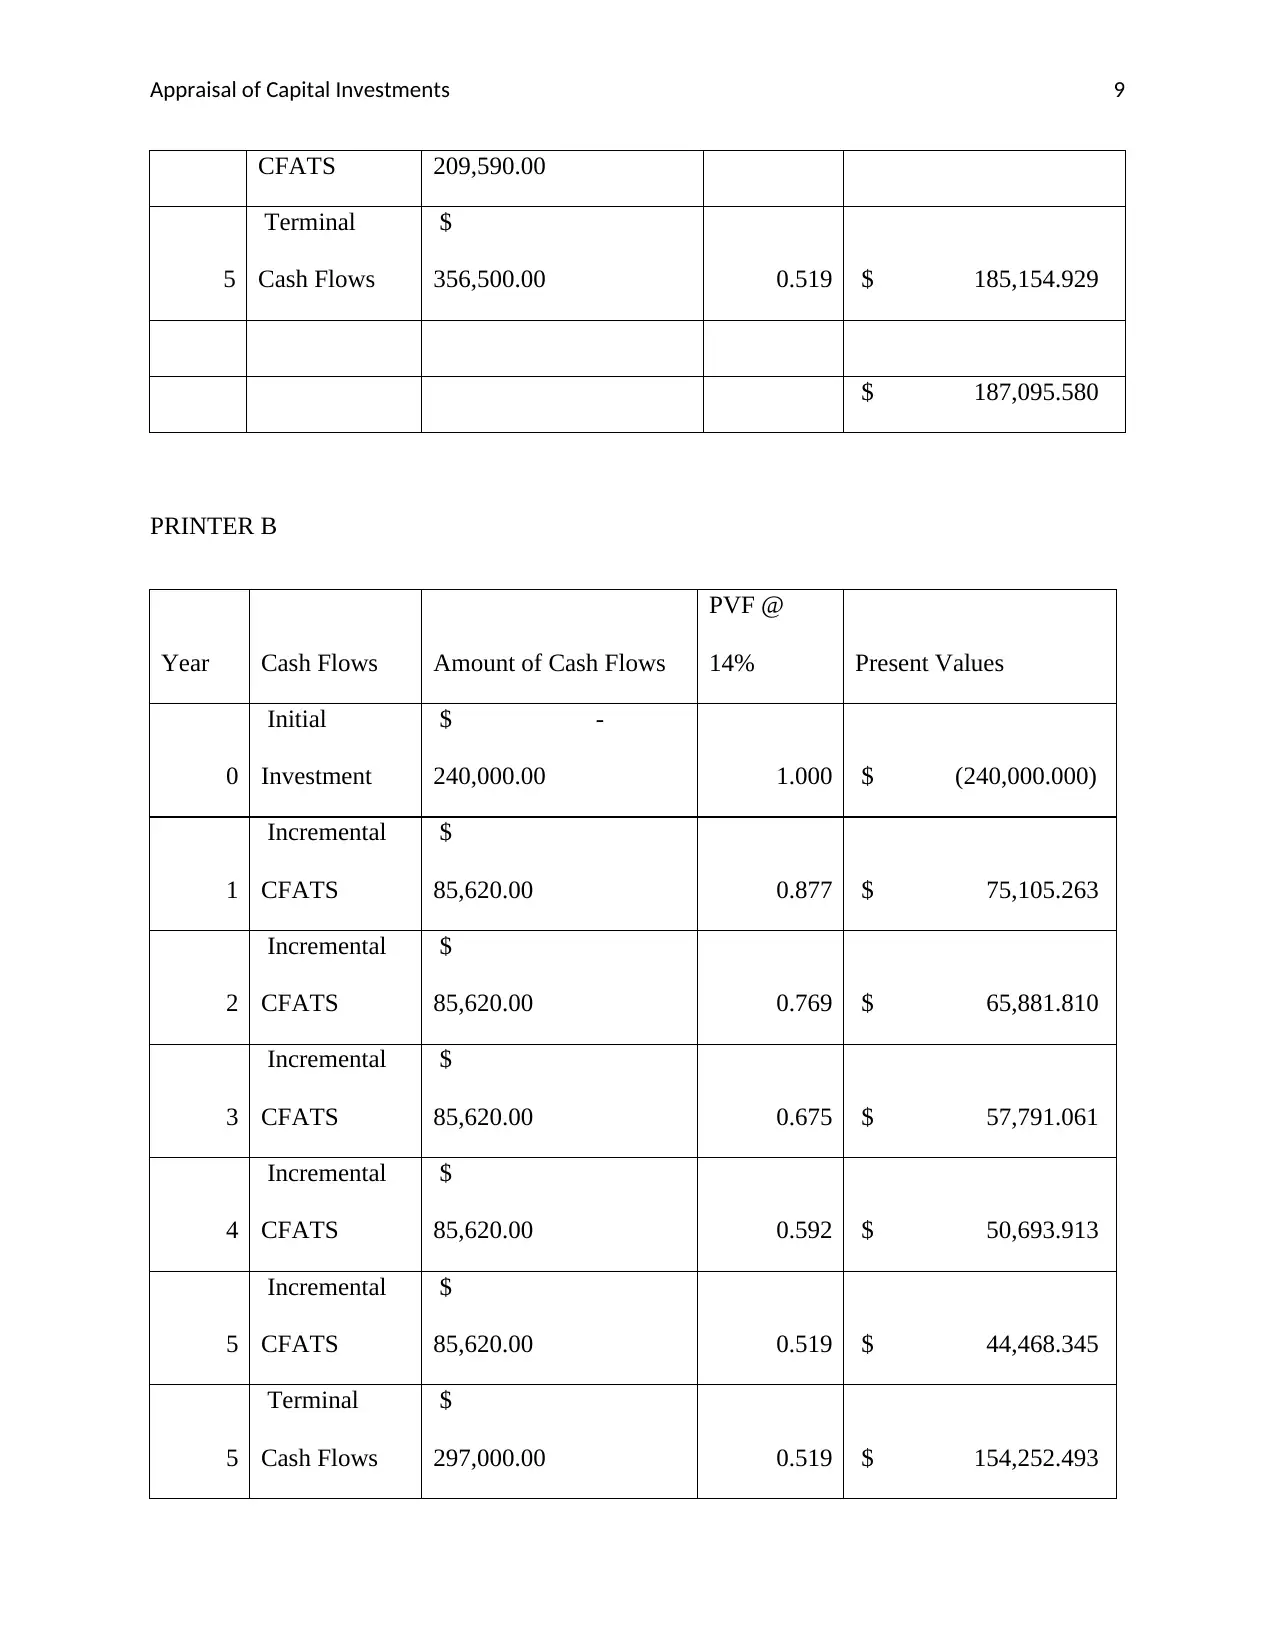
CFATS 209,590.00
5
Terminal
Cash Flows
$
356,500.00 0.519 $ 185,154.929
$ 187,095.580
PRINTER B
Year Cash Flows Amount of Cash Flows
PVF @
14% Present Values
0
Initial
Investment
$ -
240,000.00 1.000 $ (240,000.000)
1
Incremental
CFATS
$
85,620.00 0.877 $ 75,105.263
2
Incremental
CFATS
$
85,620.00 0.769 $ 65,881.810
3
Incremental
CFATS
$
85,620.00 0.675 $ 57,791.061
4
Incremental
CFATS
$
85,620.00 0.592 $ 50,693.913
5
Incremental
CFATS
$
85,620.00 0.519 $ 44,468.345
5
Terminal
Cash Flows
$
297,000.00 0.519 $ 154,252.493
Paraphrase This Document
Need a fresh take? Get an instant paraphrase of this document with our AI Paraphraser
Appraisal of Capital Investments 10
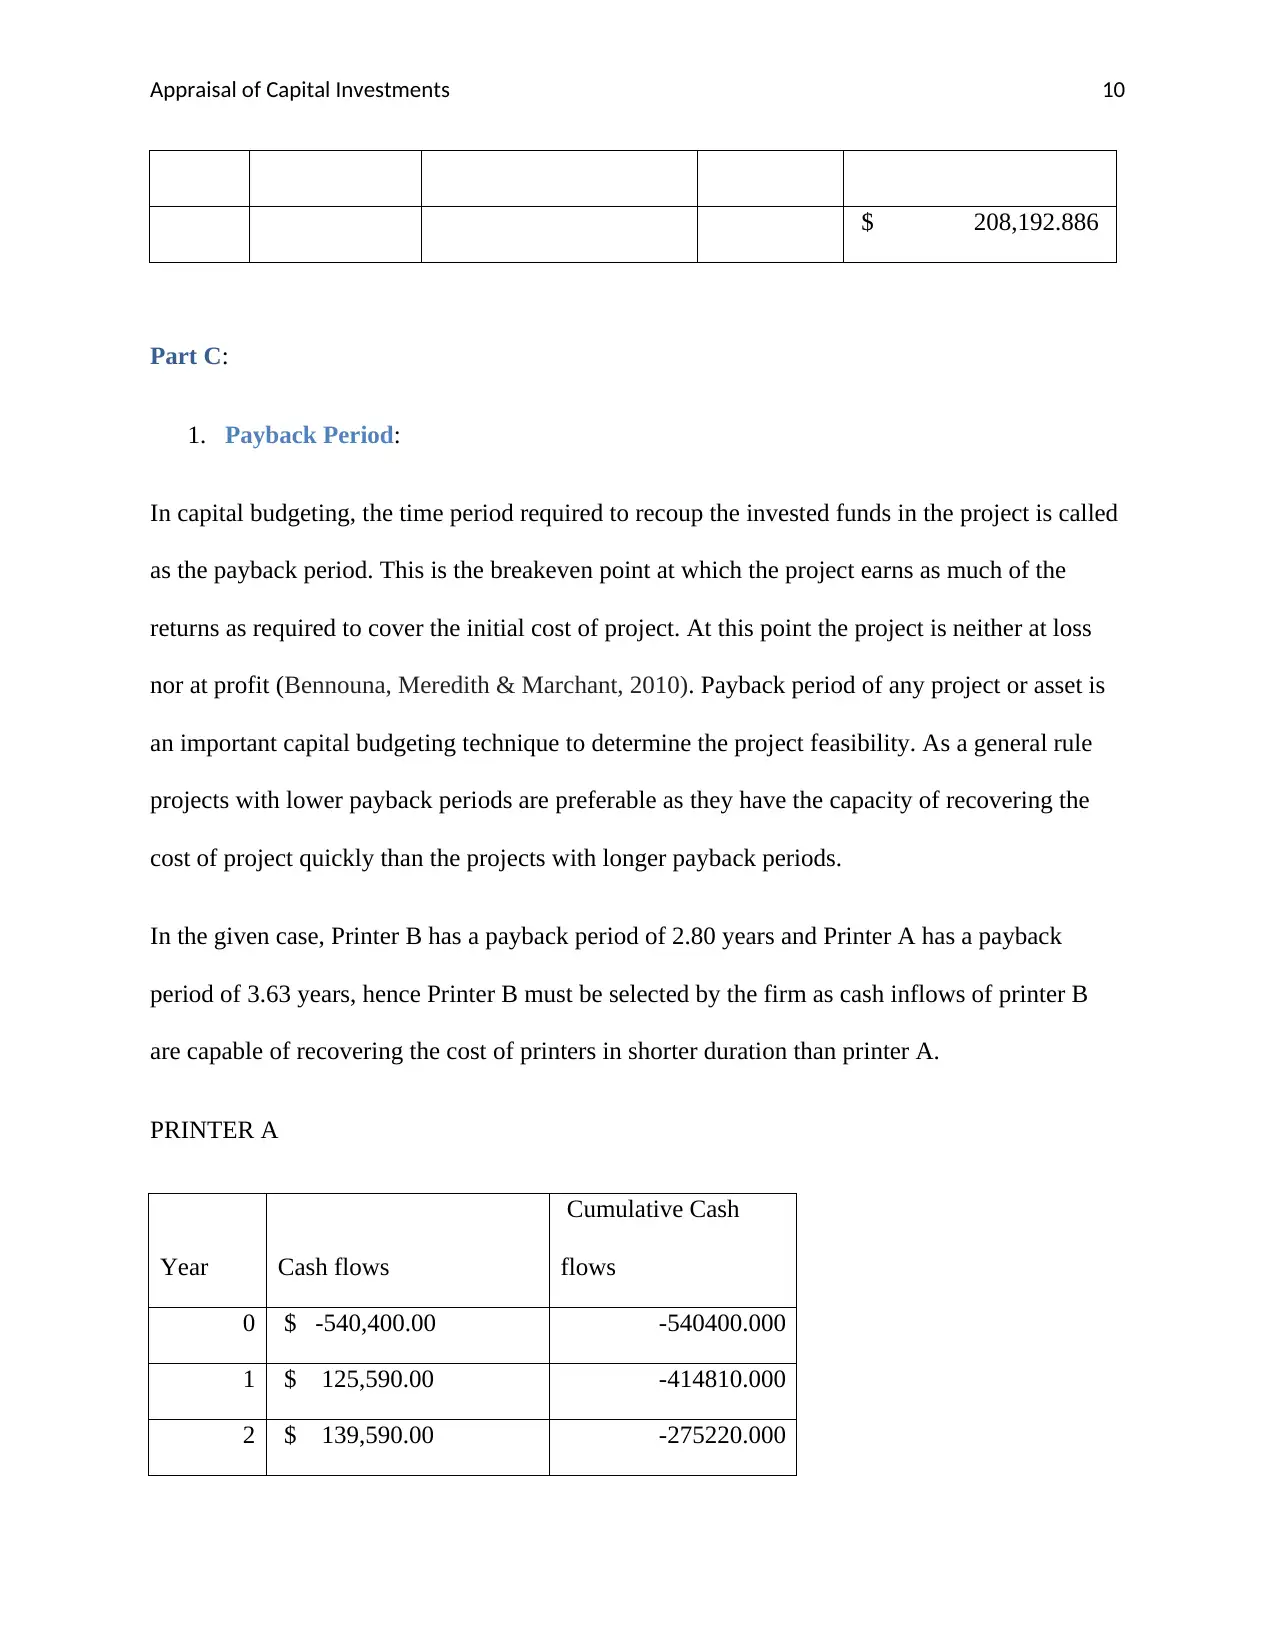
$ 208,192.886
Part C:
1. Payback Period:
In capital budgeting, the time period required to recoup the invested funds in the project is called
as the payback period. This is the breakeven point at which the project earns as much of the
returns as required to cover the initial cost of project. At this point the project is neither at loss
nor at profit (Bennouna, Meredith & Marchant, 2010). Payback period of any project or asset is
an important capital budgeting technique to determine the project feasibility. As a general rule
projects with lower payback periods are preferable as they have the capacity of recovering the
cost of project quickly than the projects with longer payback periods.
In the given case, Printer B has a payback period of 2.80 years and Printer A has a payback
period of 3.63 years, hence Printer B must be selected by the firm as cash inflows of printer B
are capable of recovering the cost of printers in shorter duration than printer A.
PRINTER A
Year Cash flows
Cumulative Cash
flows
0 $ -540,400.00 -540400.000
1 $ 125,590.00 -414810.000
2 $ 139,590.00 -275220.000
Appraisal of Capital Investments 11
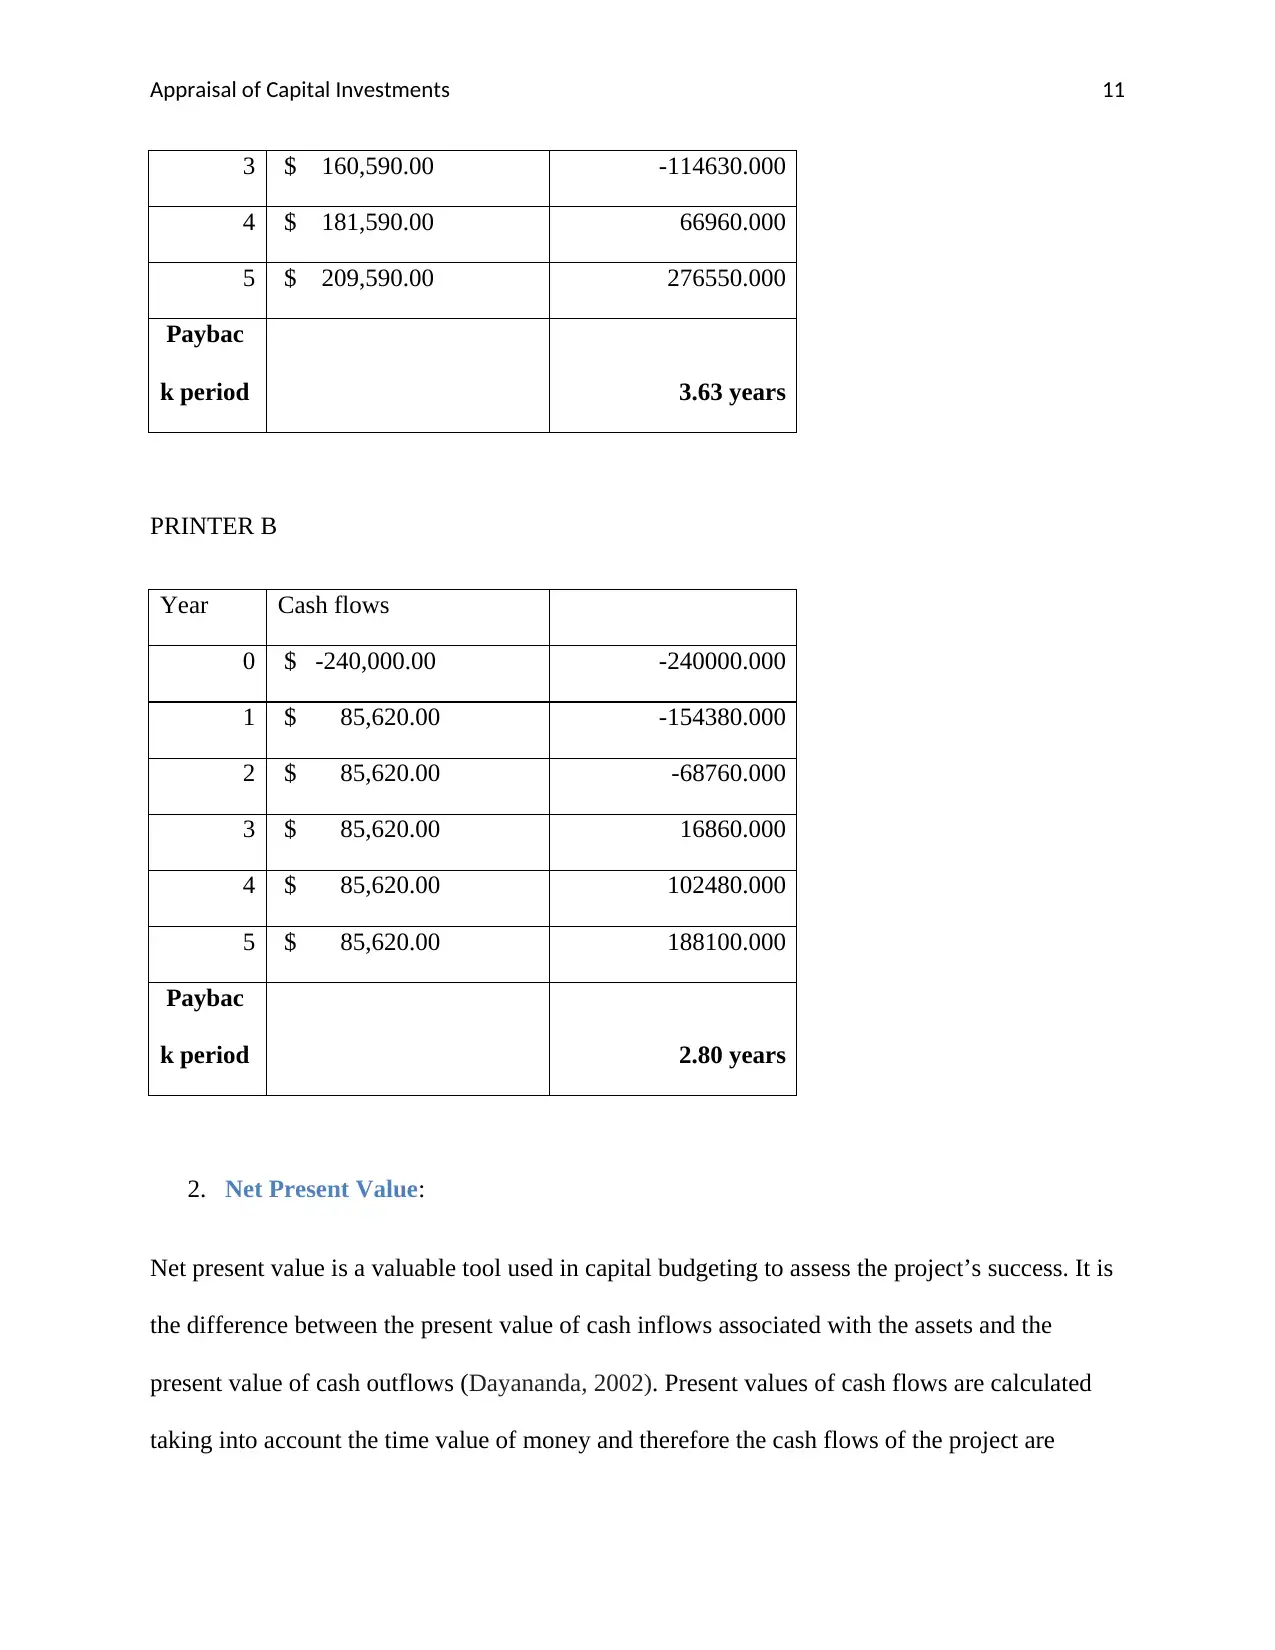
3 $ 160,590.00 -114630.000
4 $ 181,590.00 66960.000
5 $ 209,590.00 276550.000
Paybac
k period 3.63 years
PRINTER B
Year Cash flows
0 $ -240,000.00 -240000.000
1 $ 85,620.00 -154380.000
2 $ 85,620.00 -68760.000
3 $ 85,620.00 16860.000
4 $ 85,620.00 102480.000
5 $ 85,620.00 188100.000
Paybac
k period 2.80 years
2. Net Present Value:
Net present value is a valuable tool used in capital budgeting to assess the project’s success. It is
the difference between the present value of cash inflows associated with the assets and the
present value of cash outflows (Dayananda, 2002). Present values of cash flows are calculated
taking into account the time value of money and therefore the cash flows of the project are
⊘ This is a preview!⊘
Do you want full access?
Subscribe today to unlock all pages.
Trusted by 1+ million students worldwide
1 out of 23
Related Documents


Your All-in-One AI-Powered Toolkit for Academic Success.
+13062052269
info@desklib.com
Available 24*7 on WhatsApp / Email
![[object Object]](/_next/static/media/star-bottom.7253800d.svg)
Unlock your academic potential
Copyright © 2020–2026 A2Z Services. All Rights Reserved. Developed and managed by ZUCOL.