Analysis of Capital Budgeting Techniques for Corporate Finance
VerifiedAdded on 2020/02/24
|16
|3861
|76
Report
AI Summary
This report provides a comprehensive analysis of capital budgeting decisions and techniques crucial for organizational success. It explores various methods such as internal rate of return (IRR) and net present value (NPV) to evaluate investment proposals. The report delves into sensitivity analysis, demonstrating how changes in inputs influence business outputs, and scenario analysis, which assesses potential variability in capital budgeting. Additionally, it examines break-even analysis to identify the relationship between fixed costs, variable costs, and returns. Through the use of examples and figures, the report illustrates the application of these techniques, providing valuable insights for making informed financial decisions and managing long-term business performance. The analysis emphasizes the importance of these tools in enhancing market performance and achieving favorable outcomes, ultimately contributing to the success of an enterprise.

CORPORATE FINANCIAL MANAGEMENT
Paraphrase This Document
Need a fresh take? Get an instant paraphrase of this document with our AI Paraphraser
Table of Contents
INTRODUCTION...........................................................................................................................1
Capital budgeting decisions.........................................................................................................1
Sensitivity analysis in capital budgeting decisions......................................................................2
Scenario analysis.........................................................................................................................4
Break even analysis.....................................................................................................................7
Simulation techniques..................................................................................................................9
Recommendations......................................................................................................................11
CONCLUSION..............................................................................................................................11
REFERENCES..............................................................................................................................13
INTRODUCTION
Capital budgeting decisions are most crucial for the organization as they are linked to the
success of the enterprise in every possible manner (Ahmed 2013). Apart from this for effective
decision making different tools are present such as break even, simulation technique that assists
business in enhancing their market performance and leads to favorable results. The range of
capital budgeting techniques present such as net present value, internal rate of return, the average
rate of return, etc. allows in evaluating the project and in turn it can easily know whether it is
feasible to invest in the proposal or not.
In short capital budgeting decisions are most crucial, and they are associated with long
term performance of an enterprise. The present report carried out is based on analysis of different
techniques such as break even, simulation, sensitivity which can be used in the capital budgeting
decisions.
Capital budgeting decisions
It can be defined as the decision taken by the management of the enterprise to allocate
funds to any particular project with the motive to yield a high rate of return along with another
form of benefits (Bierman Jr & Smidt 2014). The range of investment decisions takes into
consideration new product investment, expansion, modernization, etc. The key associated with
capital budgeting decisions involves long term consequences, difficult to reverse and considers
the substantial outlays (PRISTINE 2015).
All the range of decisions taken by the business requires in-depth analysis like in case if
any investment proposal is seen as then it is necessary to consider pros and cons of the project so
that higher return can be obtained by investing into the proposal (Andor, Mohanty & Toth 2015).
Different types of techniques are present by which investment decision can be taken, and it
allows for efficient utilization of financial resources which is fruitful for the business in every
possible manner. The range of capital budgeting techniques is as follows:
Internal rate of return
It is considered as the rate at which net present value of the investment is zero. Apart
from this, the discounted cash inflow is equal to outflow. The main benefit associated with this
type of technique is that it considers the time value of money (Goodman et al. 2013). In short,
this method allows in knowing how much return a particular project can provide during its useful
1
⊘ This is a preview!⊘
Do you want full access?
Subscribe today to unlock all pages.
Trusted by 1+ million students worldwide
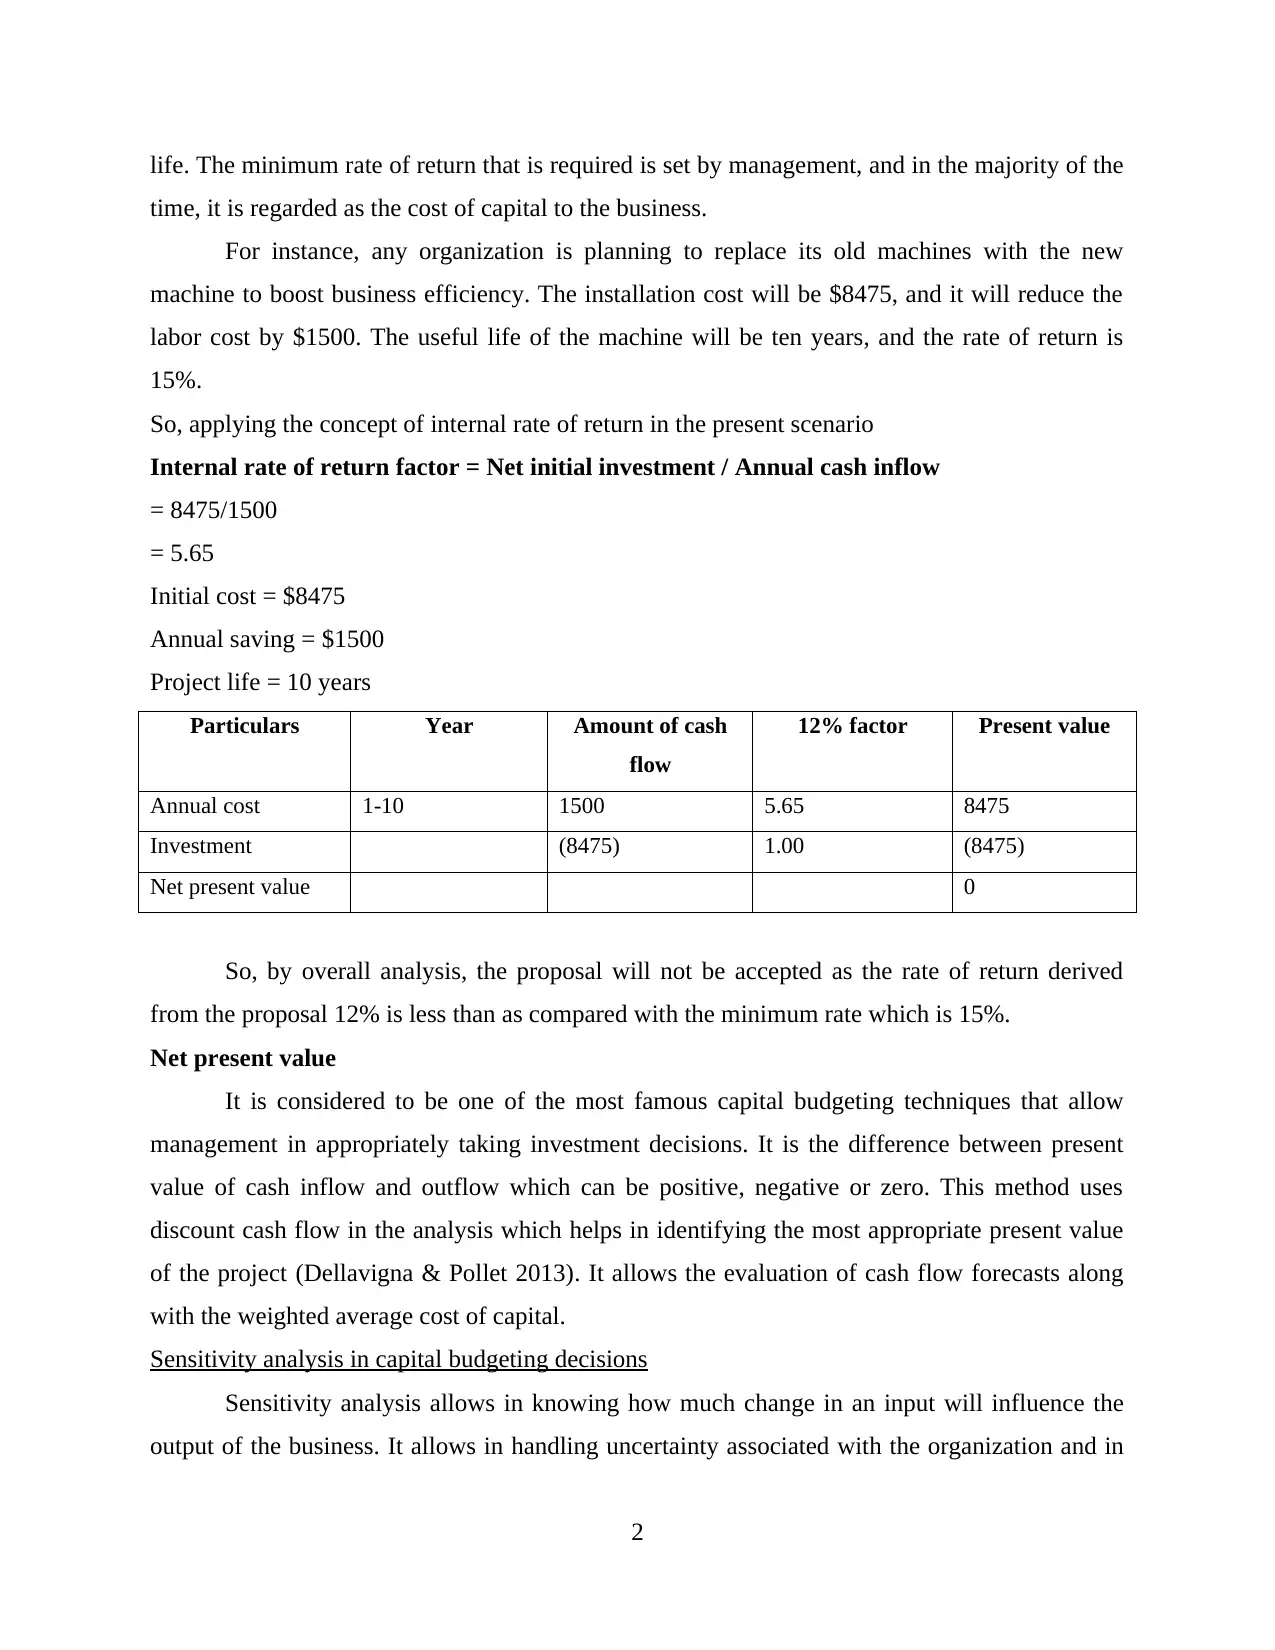
life. The minimum rate of return that is required is set by management, and in the majority of the
time, it is regarded as the cost of capital to the business.
For instance, any organization is planning to replace its old machines with the new
machine to boost business efficiency. The installation cost will be $8475, and it will reduce the
labor cost by $1500. The useful life of the machine will be ten years, and the rate of return is
15%.
So, applying the concept of internal rate of return in the present scenario
Internal rate of return factor = Net initial investment / Annual cash inflow
= 8475/1500
= 5.65
Initial cost = $8475
Annual saving = $1500
Project life = 10 years
Particulars Year Amount of cash
flow
12% factor Present value
Annual cost 1-10 1500 5.65 8475
Investment (8475) 1.00 (8475)
Net present value 0
So, by overall analysis, the proposal will not be accepted as the rate of return derived
from the proposal 12% is less than as compared with the minimum rate which is 15%.
Net present value
It is considered to be one of the most famous capital budgeting techniques that allow
management in appropriately taking investment decisions. It is the difference between present
value of cash inflow and outflow which can be positive, negative or zero. This method uses
discount cash flow in the analysis which helps in identifying the most appropriate present value
of the project (Dellavigna & Pollet 2013). It allows the evaluation of cash flow forecasts along
with the weighted average cost of capital.
Sensitivity analysis in capital budgeting decisions
Sensitivity analysis allows in knowing how much change in an input will influence the
output of the business. It allows in handling uncertainty associated with the organization and in
2
Paraphrase This Document
Need a fresh take? Get an instant paraphrase of this document with our AI Paraphraser
turn long term performance of the enterprise can be easily managed with the help of this like
change in sales, cost associated with the business etc (Goodman et al. 2013). All these key
elements can be easily managed with the concept of sensitivity analysis.
Year 0 Year 1-12
Investment (5400)
Sales 16000
Variable cost 13000
Fixed cost 2000
Depreciation 450
Pretax profit 550
Tax rate 40% 220
Profit after tax 330
Operating cash flow 780
Net cash flow (5400) 780
Net present value =$478
Outcomes expected
Variable Pessimistic Expected Optimistic
Sales 14000 16000 18000
Investment 6200 5400 5000
Variable cost
(Sales percentage)
83% 81.25% 80%
Fixed cost 2100 2000 1900
Above shown is the sensitivity analysis through which different type of data has been
retrieved through which it can be easily known whether it is feasible to accept the investment
proposal or not. The key data that has been derived with the help of sensitivity analysis involves
sales have been estimated that have the direct impact on net present value and due to this reason
additional survey result is needed (Götze, Northcott & Schuster 2015). The overall fluctuations
in the fixed cost are very significant. Different limitations of the sensitivity analysis are present
which involves that it provides ambiguous results and the key variables present are assumed to
be independent.
3
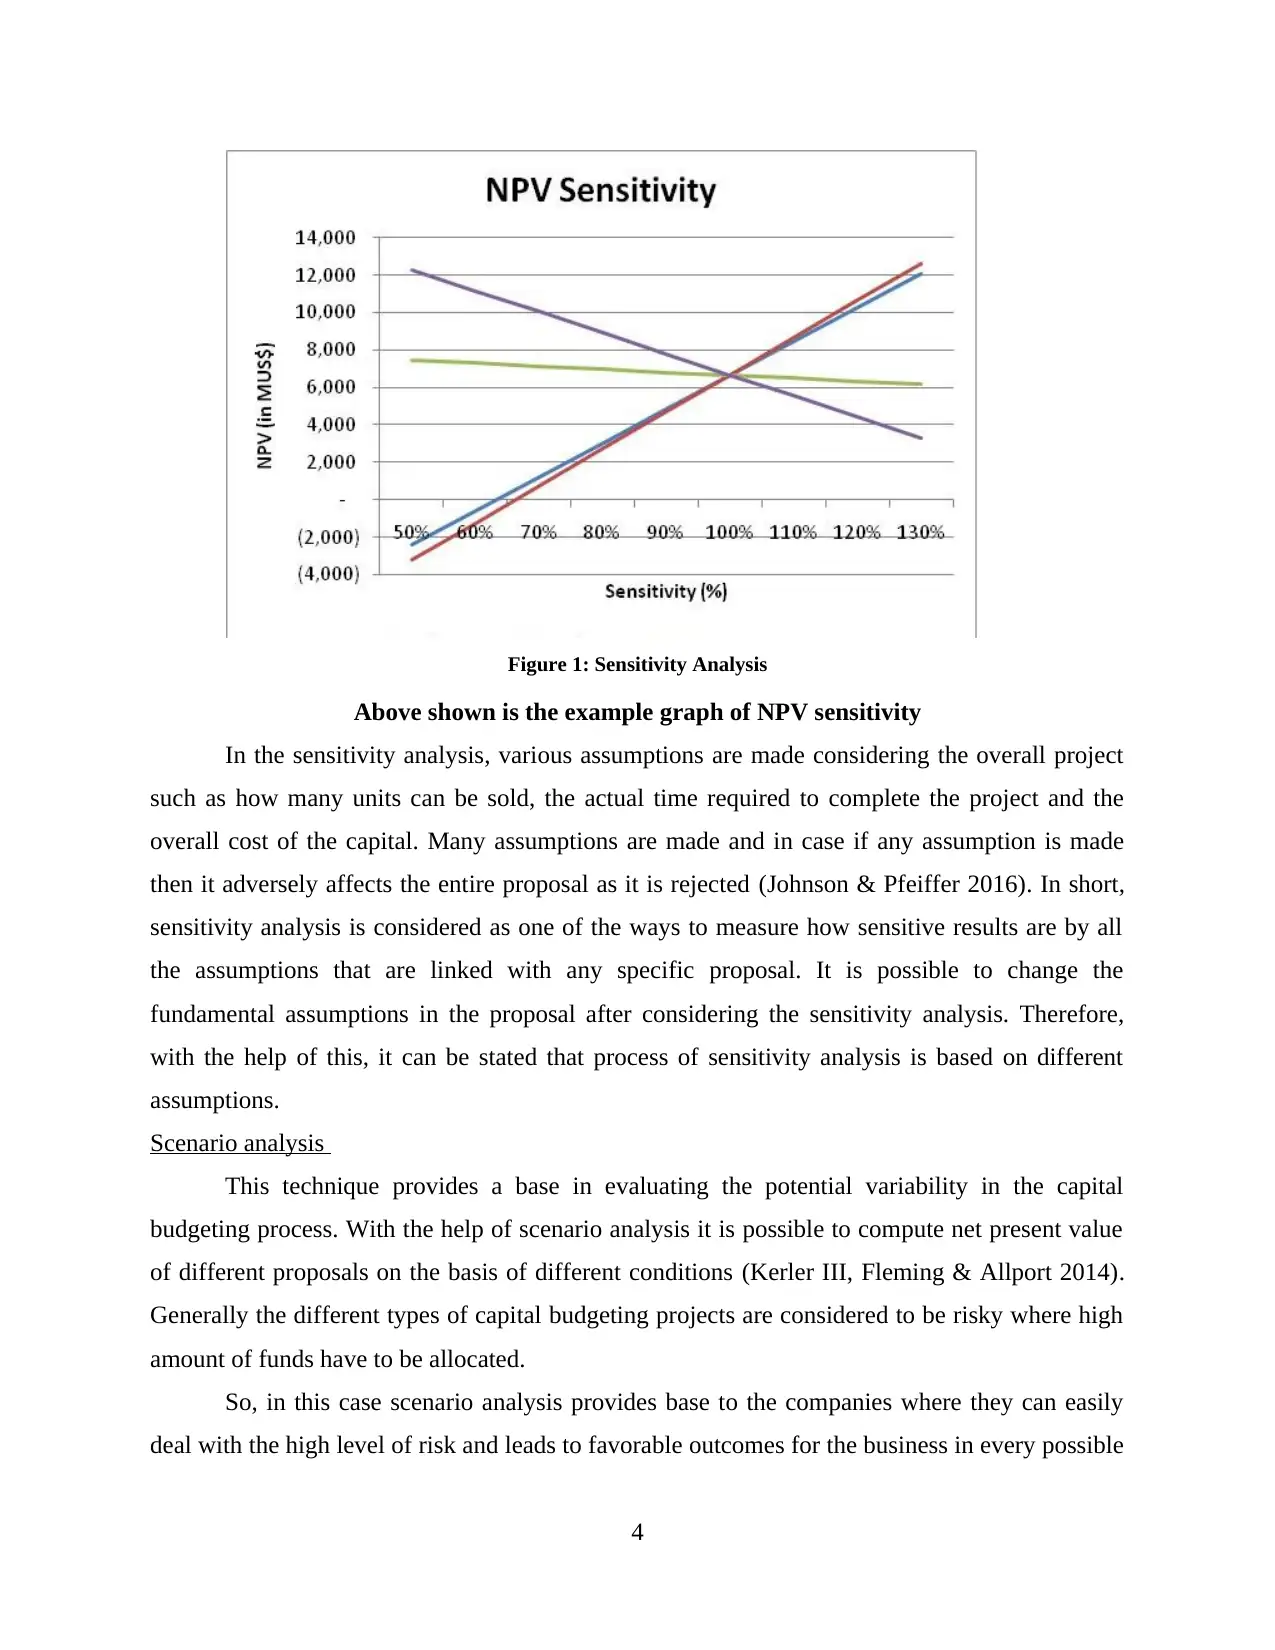
Figure 1: Sensitivity Analysis
Above shown is the example graph of NPV sensitivity
In the sensitivity analysis, various assumptions are made considering the overall project
such as how many units can be sold, the actual time required to complete the project and the
overall cost of the capital. Many assumptions are made and in case if any assumption is made
then it adversely affects the entire proposal as it is rejected (Johnson & Pfeiffer 2016). In short,
sensitivity analysis is considered as one of the ways to measure how sensitive results are by all
the assumptions that are linked with any specific proposal. It is possible to change the
fundamental assumptions in the proposal after considering the sensitivity analysis. Therefore,
with the help of this, it can be stated that process of sensitivity analysis is based on different
assumptions.
Scenario analysis
This technique provides a base in evaluating the potential variability in the capital
budgeting process. With the help of scenario analysis it is possible to compute net present value
of different proposals on the basis of different conditions (Kerler III, Fleming & Allport 2014).
Generally the different types of capital budgeting projects are considered to be risky where high
amount of funds have to be allocated.
So, in this case scenario analysis provides base to the companies where they can easily
deal with the high level of risk and leads to favorable outcomes for the business in every possible
4
⊘ This is a preview!⊘
Do you want full access?
Subscribe today to unlock all pages.
Trusted by 1+ million students worldwide
manner (Lane & Rosewall 2015). The entire process of scenario analysis starts with the
development of base case scenario. Further, it also takes into consideration best case scenario
and worst case scenario. Every scenario is assigned probability and it is calculated with the
motive to reach towards expected value.
Project X Project Y
Investment (t=0) 40,000 40,000
Cash inflow (t=1-15)
Worst 6 0
Most likely 8 8
Best 10 16
Required rate of return 0.10 0.10
Life of project 15 15
Expected cash inflow
Project X Project Y
Cash inflow PV NPV PV NPV
Worst 45,636 5630 0 (40000)
Most likely 60,840 20,840 60,830 20,840
Best 76,000 36,000 1,21,600 81,000
By these two projects, it has been found that project X is considered to be a lesser risk as
compared with project Y. Further, the overall acceptance of the project relies on the attitude of
decision maker towards risk. In case if the decision maker is conservative then in such case
project X will be accepted as the chance of the possibility of suffering loss is very low. On the
other hand, if the individual prefers to take the risk then in such case it would be preferable to
accept project Y which yields higher return as compared to the other project. For instance, if
expected cash flow has a probability of 0.7 of occurrence then it indicates the given cash flow is
likely to be obtained in 7 out of 10 times.
Overall the entire technique of scenario analysis represents different situations that need
to be undertaken. Apart from this, the conditions present involve worst, most likely and best. The
above project is worst when its present value is zero, and in such case, investment is not at all
5
Paraphrase This Document
Need a fresh take? Get an instant paraphrase of this document with our AI Paraphraser
considered to be feasible (Muchiri et al. 2014). Apart from this, it is deemed to be best when the
overall present value is very high and through this high level of return can be obtained easily.
In case if the present value of the proposal is very high as compared with the net present
value then in such case it is considered to be feasible to allocate funds in the proposal, and it can
surely provide a high return to the business. This technique allows in knowing which investment
proposal is most appropriate for the company regarding return and the entire amount of
investment can be recovered easily and in short, period keeping in view the financial needs of the
business.
Figure 2: Scenario Analysis
6
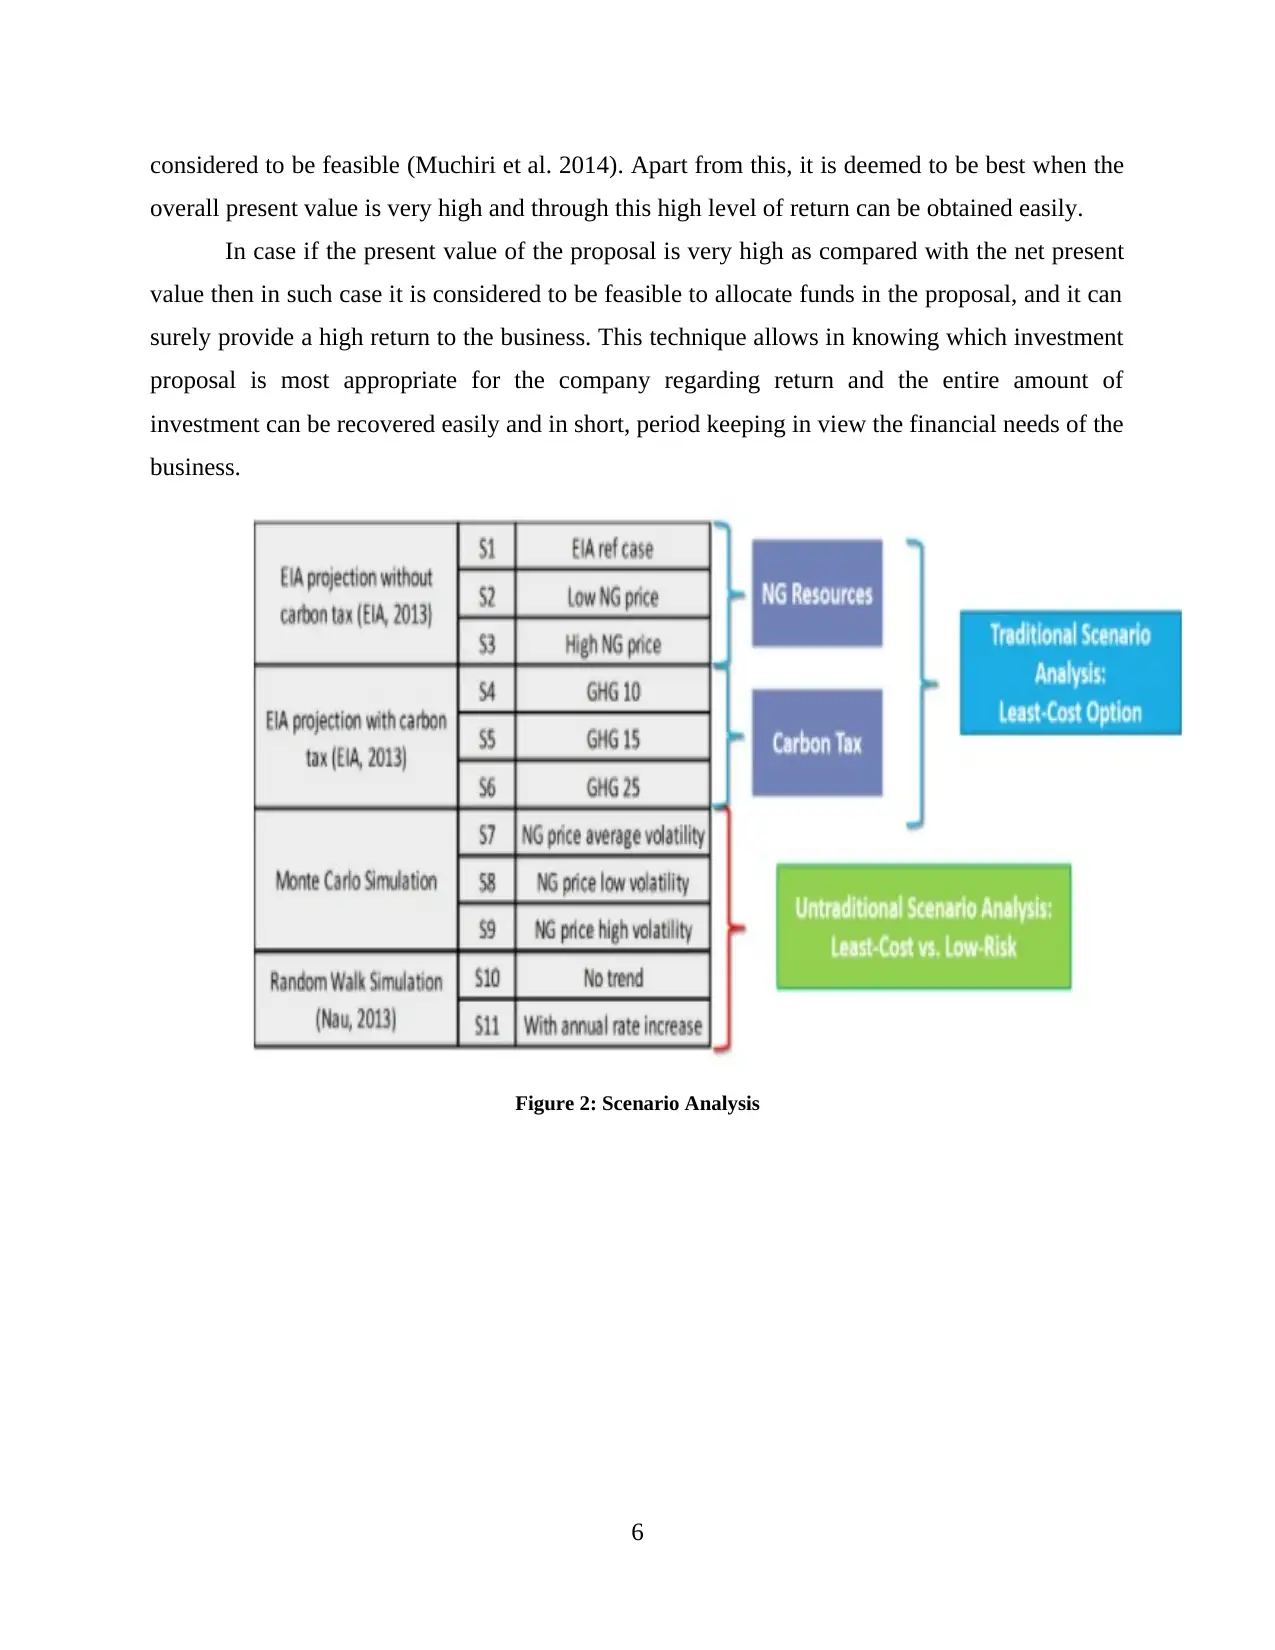
Above shown are the different six scenarios which are the traditional analysis that get
least cost option and the least five scenario undertakes cost plus risk management. The chart
represents NPV of six different options where red line indicates cost of NPV, blue line represents
possible outcomes from different scenarios (Delicate 2017). The option 1 is the least cost in the
base case and the worst possible result for option 1 is higher as compared with other options.
Break even analysis
It is considered to be one of the most effective tools through which relationship between
variable, fixed cost and returns can be identified. It helps in knowing whether any particular
investment can provide positive return or not. The key elements involve fixed and variable costs
that are most crucial for the enterprise (Mendes-Da-Silva & Saito 2014). Fixed costs are not
directly linked with the production level and it takes into consideration interest cost, general
overhead expenses and taxes. On the other hand, variable cost represents the change in direct
relation to volume of output. It takes into consideration overall cost of goods sold such as fuel,
feed, irrigation, power cost etc (Rossi 2014). Break even helps in knowing the income and cost
level which intersects at this point.
7
⊘ This is a preview!⊘
Do you want full access?
Subscribe today to unlock all pages.
Trusted by 1+ million students worldwide
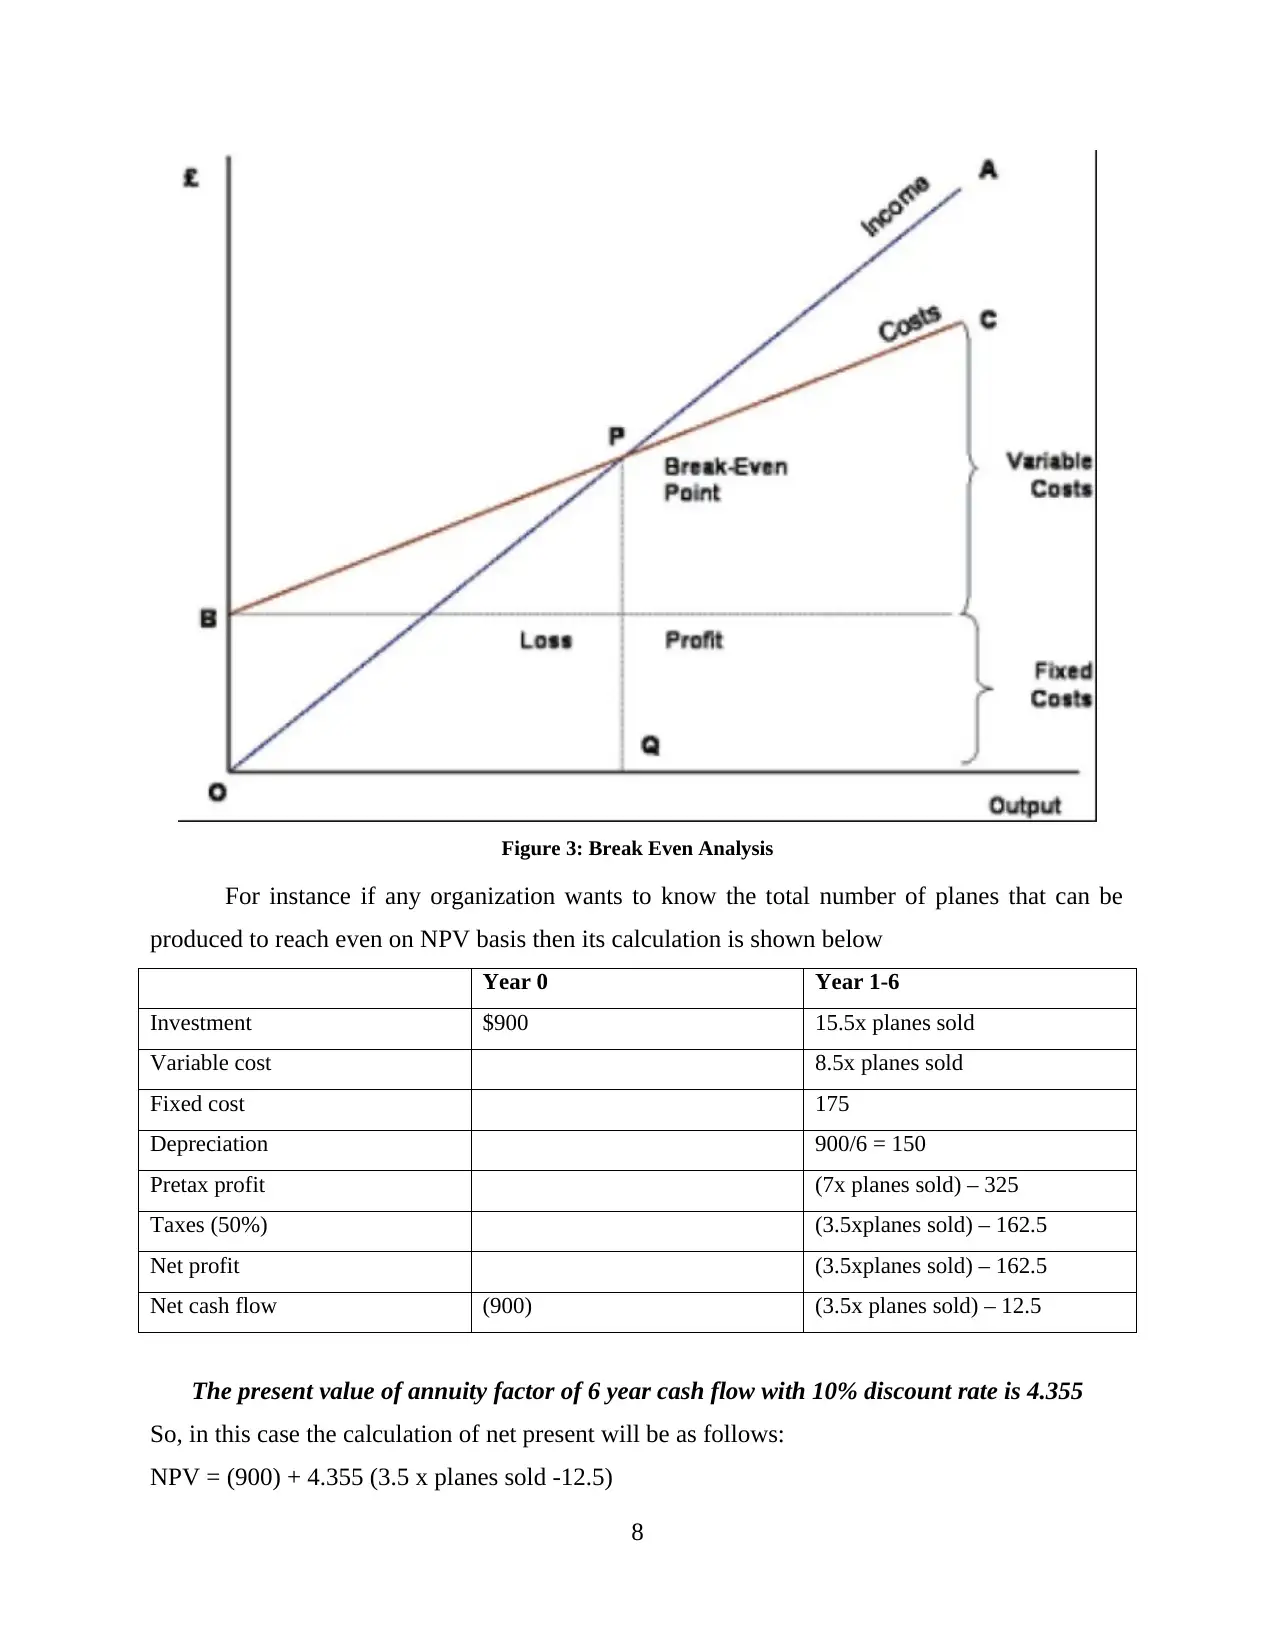
Figure 3: Break Even Analysis
For instance if any organization wants to know the total number of planes that can be
produced to reach even on NPV basis then its calculation is shown below
Year 0 Year 1-6
Investment $900 15.5x planes sold
Variable cost 8.5x planes sold
Fixed cost 175
Depreciation 900/6 = 150
Pretax profit (7x planes sold) – 325
Taxes (50%) (3.5xplanes sold) – 162.5
Net profit (3.5xplanes sold) – 162.5
Net cash flow (900) (3.5x planes sold) – 12.5
The present value of annuity factor of 6 year cash flow with 10% discount rate is 4.355
So, in this case the calculation of net present will be as follows:
NPV = (900) + 4.355 (3.5 x planes sold -12.5)
8
Paraphrase This Document
Need a fresh take? Get an instant paraphrase of this document with our AI Paraphraser
= 63
So, with the help of break even analysis, it has been found that it is required for the
company to produce 63 planes. By this technique, it is feasible to take investment decisions that
are associated with the long term performance of the business in every possible manner. Apart
from this, it lowers down the risk of loss where decent profits can be generated by the
organization (Schönbohm et al. 2016). Break even analysis is used in every sector and industry
as through this management has to apply lesser efforts in taking investment decisions. This tool
helps in determining the cost structure where targets can be fixed with the motive to cover the
major costs that are associated with the organization.
Moreover, businesses can quickly take decisions regarding allocation of financial
resources and this, in turn, acts as a development tool for the entire enterprise. After reaching
breakeven point companies can quickly earn profits that are directly beneficial to them in every
possible manner. It is the main reason due to which break even analysis is considered to be most
effective, and the right amount of financial resources can be allocated to the project considering
the requirement of the enterprise in every possible manner (Rossi 2015). Break even analysis is
deemed to be useful in the different type of situations that take into consideration starting any
activity, focusing on the expansion of different level of activities, making projects in fixed assets,
etc. So, these are some of the crucial functions that are associated with this project.
Simulation techniques
Simulation is considered to be an imitation of some real thing or any other process. It is
considered as the act of simulating which represents key behavior along with another form of
attributes. It takes into consideration the use of models with the motive to real life condition.
Simulation analysis can also be regarded as an extension of scenario analysis where with the help
of computer it is possible to generate various combinations of probability along with the
probability distributions keeping in view the historical data (Schönbohm et al. 2016).
9
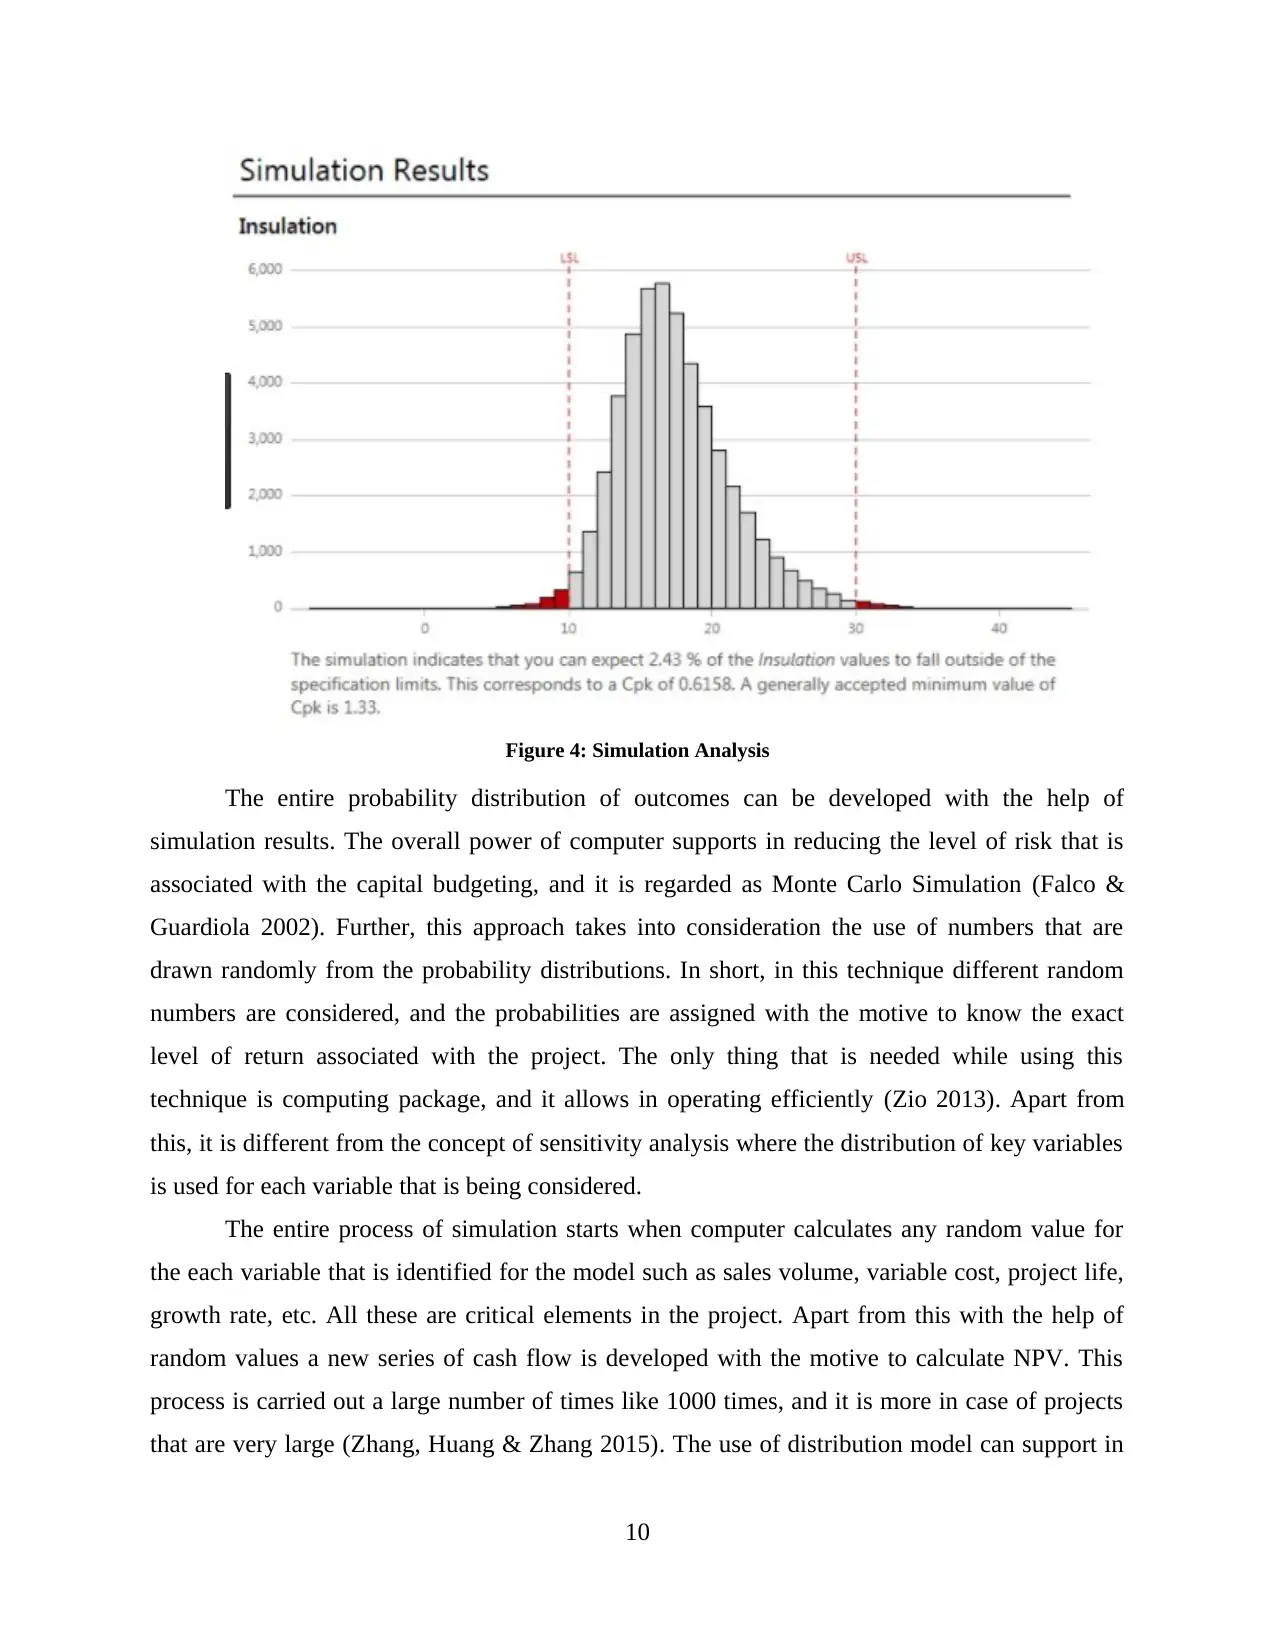
Figure 4: Simulation Analysis
The entire probability distribution of outcomes can be developed with the help of
simulation results. The overall power of computer supports in reducing the level of risk that is
associated with the capital budgeting, and it is regarded as Monte Carlo Simulation (Falco &
Guardiola 2002). Further, this approach takes into consideration the use of numbers that are
drawn randomly from the probability distributions. In short, in this technique different random
numbers are considered, and the probabilities are assigned with the motive to know the exact
level of return associated with the project. The only thing that is needed while using this
technique is computing package, and it allows in operating efficiently (Zio 2013). Apart from
this, it is different from the concept of sensitivity analysis where the distribution of key variables
is used for each variable that is being considered.
The entire process of simulation starts when computer calculates any random value for
the each variable that is identified for the model such as sales volume, variable cost, project life,
growth rate, etc. All these are critical elements in the project. Apart from this with the help of
random values a new series of cash flow is developed with the motive to calculate NPV. This
process is carried out a large number of times like 1000 times, and it is more in case of projects
that are very large (Zhang, Huang & Zhang 2015). The use of distribution model can support in
10
⊘ This is a preview!⊘
Do you want full access?
Subscribe today to unlock all pages.
Trusted by 1+ million students worldwide
1 out of 16
Related Documents


Your All-in-One AI-Powered Toolkit for Academic Success.
+13062052269
info@desklib.com
Available 24*7 on WhatsApp / Email
![[object Object]](/_next/static/media/star-bottom.7253800d.svg)
Unlock your academic potential
Copyright © 2020–2026 A2Z Services. All Rights Reserved. Developed and managed by ZUCOL.