ECF2226 Investment Finance: Capital Budgeting Models at Edith Cowan
VerifiedAdded on 2023/06/12
|48
|8683
|339
Homework Assignment
AI Summary
This assignment solution for the Investment Finance course (ECF2226) at Edith Cowan University comprehensively addresses capital budgeting models, portfolio diversification through Modern Portfolio Theory (MPT), and the Capital Asset Pricing Model (CAPM). Part A includes calculations and analysis of Holding Period Returns (HPRs), Value at Risk (VaR), correlation and covariance, Beta (β), and the Single Index Model (SIM) for companies like Woolworths and BHP. Part B features discussions on the benefits of diversification using MPT and a critical examination of the CAPM, including its limitations and extensions like the Fama and French three-factor model. The analysis involves statistical computations and interpretations relevant to investment decisions and risk management.
RUNNING Head: Finance and capital budgeting models
1 | P a g e
Name of the Student
University Name-
Topic-
1 | P a g e
Name of the Student
University Name-
Topic-
Paraphrase This Document
Need a fresh take? Get an instant paraphrase of this document with our AI Paraphraser
Finance and capital budgeting models 2 | P a g e
Table of Contents
Part-A.........................................................................................................................................3
Answer to question no1..........................................................................................................3
Answer to question no2..........................................................................................................3
Minimum Variance portfolio.................................................................................................6
Beta Computation of the Woolworth.................................................................................6
Answer to question no-4........................................................................................................6
Beta Calculation of the BHP....................................................................................................34
Security Market line.................................................................................................................35
Portfolio risk Using SIM......................................................................................................37
Part-2........................................................................................................................................38
Modern portfolio theory...........................................................................................................38
Capital Asset Pricing Model....................................................................................................39
CAPM and multi-factor models...............................................................................................42
Fama and French three factor model....................................................................................43
References................................................................................................................................45
Finance and capital budgeting models 3 | P a g e
Part-A
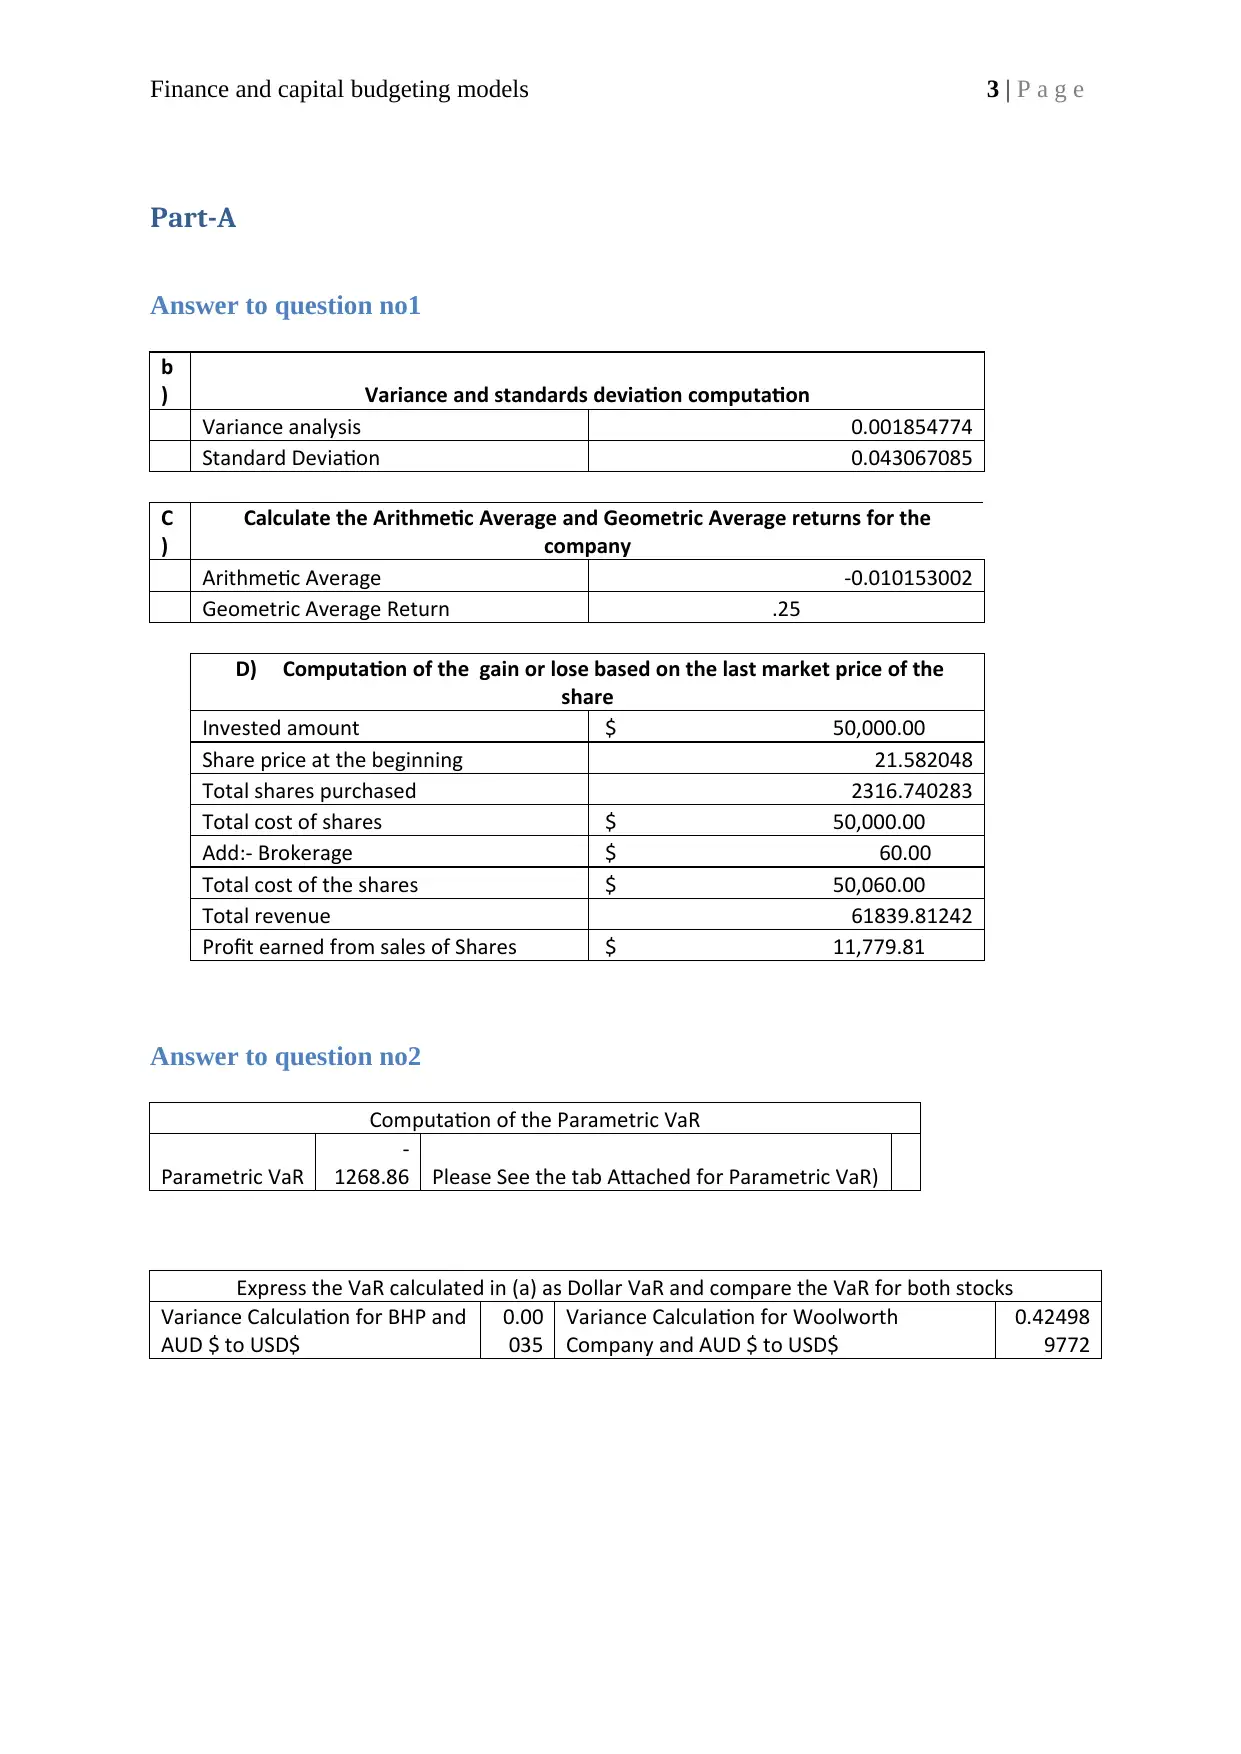
Answer to question no1
b
) Variance and standards deviation computation
Variance analysis 0.001854774
Standard Deviation 0.043067085
C
)
Calculate the Arithmetic Average and Geometric Average returns for the
company
Arithmetic Average -0.010153002
Geometric Average Return .25
D) Computation of the gain or lose based on the last market price of the
share
Invested amount $ 50,000.00
Share price at the beginning 21.582048
Total shares purchased 2316.740283
Total cost of shares $ 50,000.00
Add:- Brokerage $ 60.00
Total cost of the shares $ 50,060.00
Total revenue 61839.81242
Profit earned from sales of Shares $ 11,779.81
Answer to question no2
Computation of the Parametric VaR
Parametric VaR
-
1268.86 Please See the tab Attached for Parametric VaR)
Express the VaR calculated in (a) as Dollar VaR and compare the VaR for both stocks
Variance Calculation for BHP and
AUD $ to USD$
0.00
035
Variance Calculation for Woolworth
Company and AUD $ to USD$
0.42498
9772
Part-A
Answer to question no1
b
) Variance and standards deviation computation
Variance analysis 0.001854774
Standard Deviation 0.043067085
C
)
Calculate the Arithmetic Average and Geometric Average returns for the
company
Arithmetic Average -0.010153002
Geometric Average Return .25
D) Computation of the gain or lose based on the last market price of the
share
Invested amount $ 50,000.00
Share price at the beginning 21.582048
Total shares purchased 2316.740283
Total cost of shares $ 50,000.00
Add:- Brokerage $ 60.00
Total cost of the shares $ 50,060.00
Total revenue 61839.81242
Profit earned from sales of Shares $ 11,779.81
Answer to question no2
Computation of the Parametric VaR
Parametric VaR
-
1268.86 Please See the tab Attached for Parametric VaR)
Express the VaR calculated in (a) as Dollar VaR and compare the VaR for both stocks
Variance Calculation for BHP and
AUD $ to USD$
0.00
035
Variance Calculation for Woolworth
Company and AUD $ to USD$
0.42498
9772
⊘ This is a preview!⊘
Do you want full access?
Subscribe today to unlock all pages.
Trusted by 1+ million students worldwide
Finance and capital budgeting models 4 | P a g e
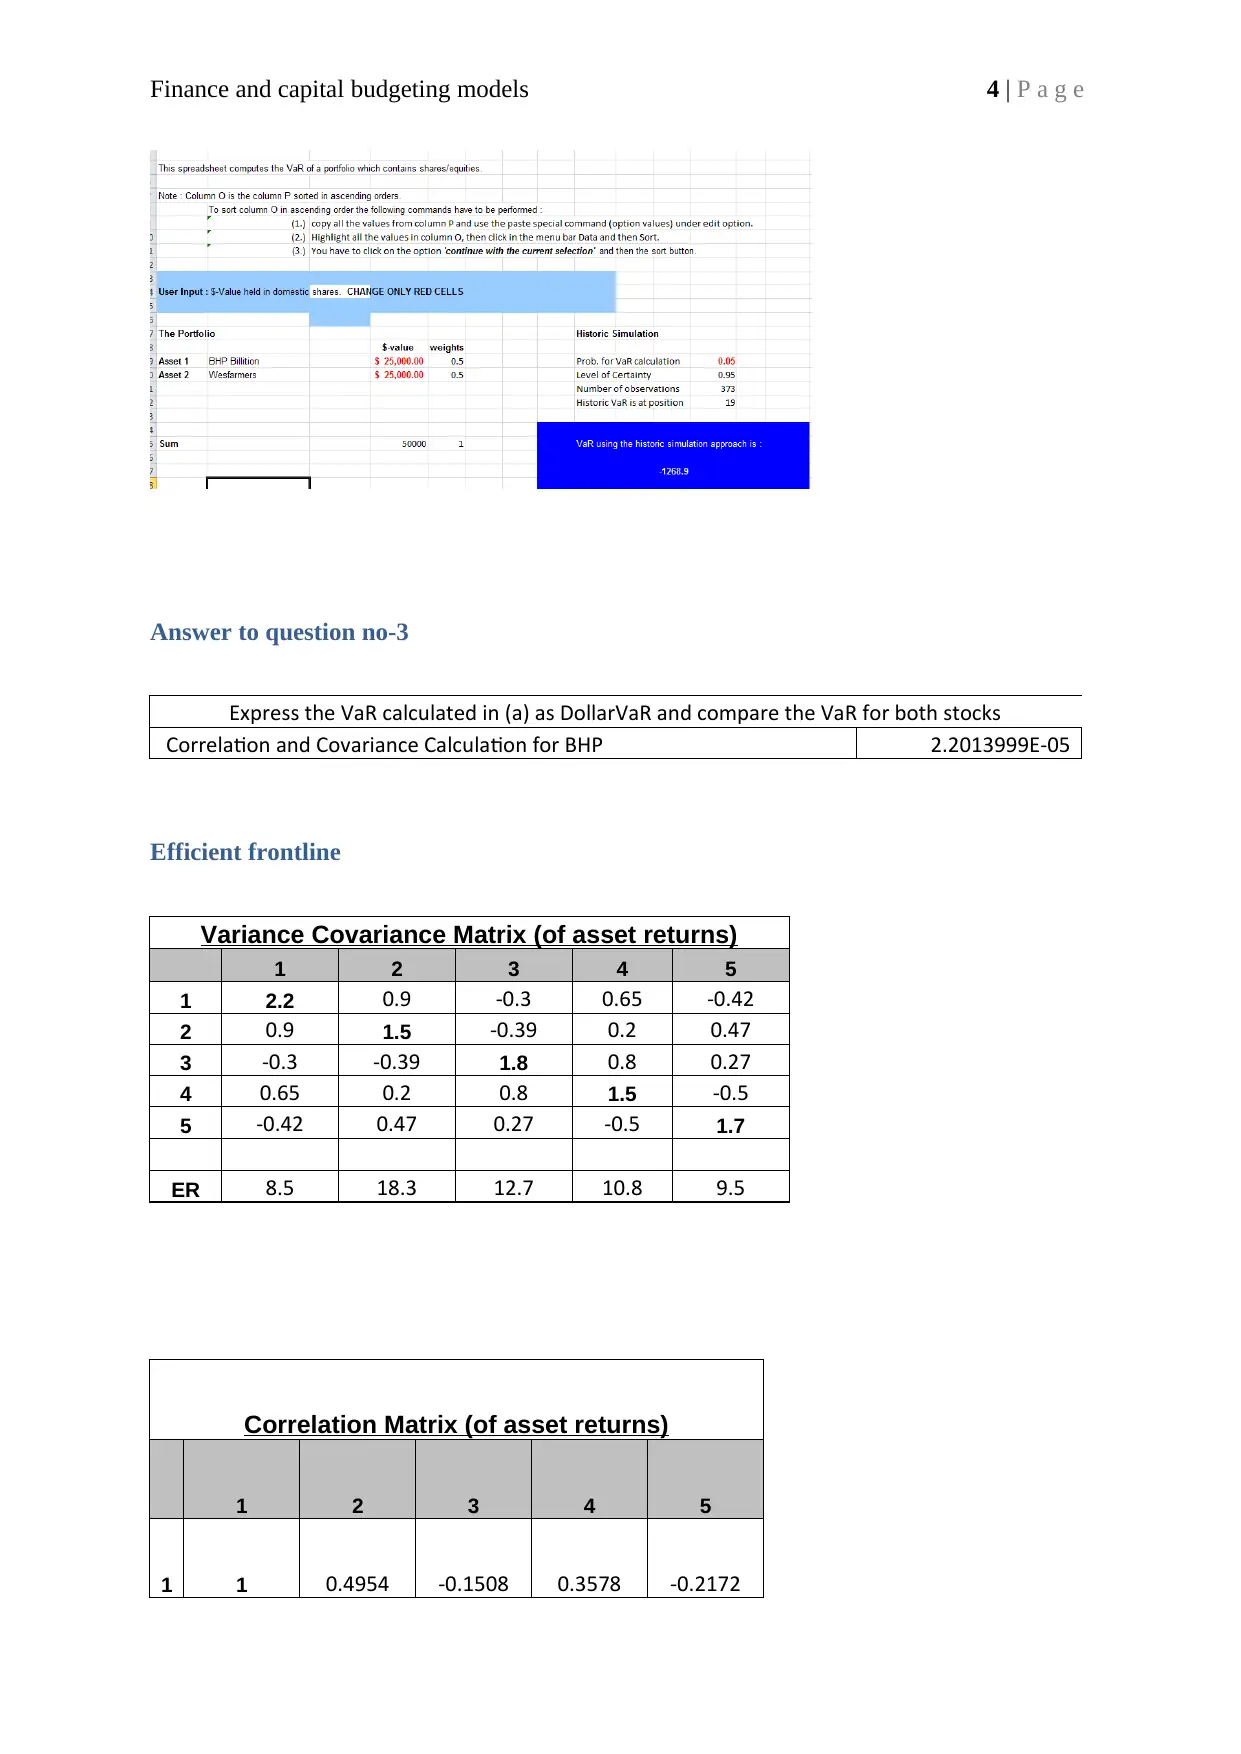
Answer to question no-3
Express the VaR calculated in (a) as DollarVaR and compare the VaR for both stocks
Correlation and Covariance Calculation for BHP 2.2013999E-05
Efficient frontline
Variance Covariance Matrix (of asset returns)
1 2 3 4 5
1 2.2 0.9 -0.3 0.65 -0.42
2 0.9 1.5 -0.39 0.2 0.47
3 -0.3 -0.39 1.8 0.8 0.27
4 0.65 0.2 0.8 1.5 -0.5
5 -0.42 0.47 0.27 -0.5 1.7
ER 8.5 18.3 12.7 10.8 9.5
Correlation Matrix (of asset returns)
1 2 3 4 5
1 1 0.4954 -0.1508 0.3578 -0.2172
Paraphrase This Document
Need a fresh take? Get an instant paraphrase of this document with our AI Paraphraser
Finance and capital budgeting models 5 | P a g e
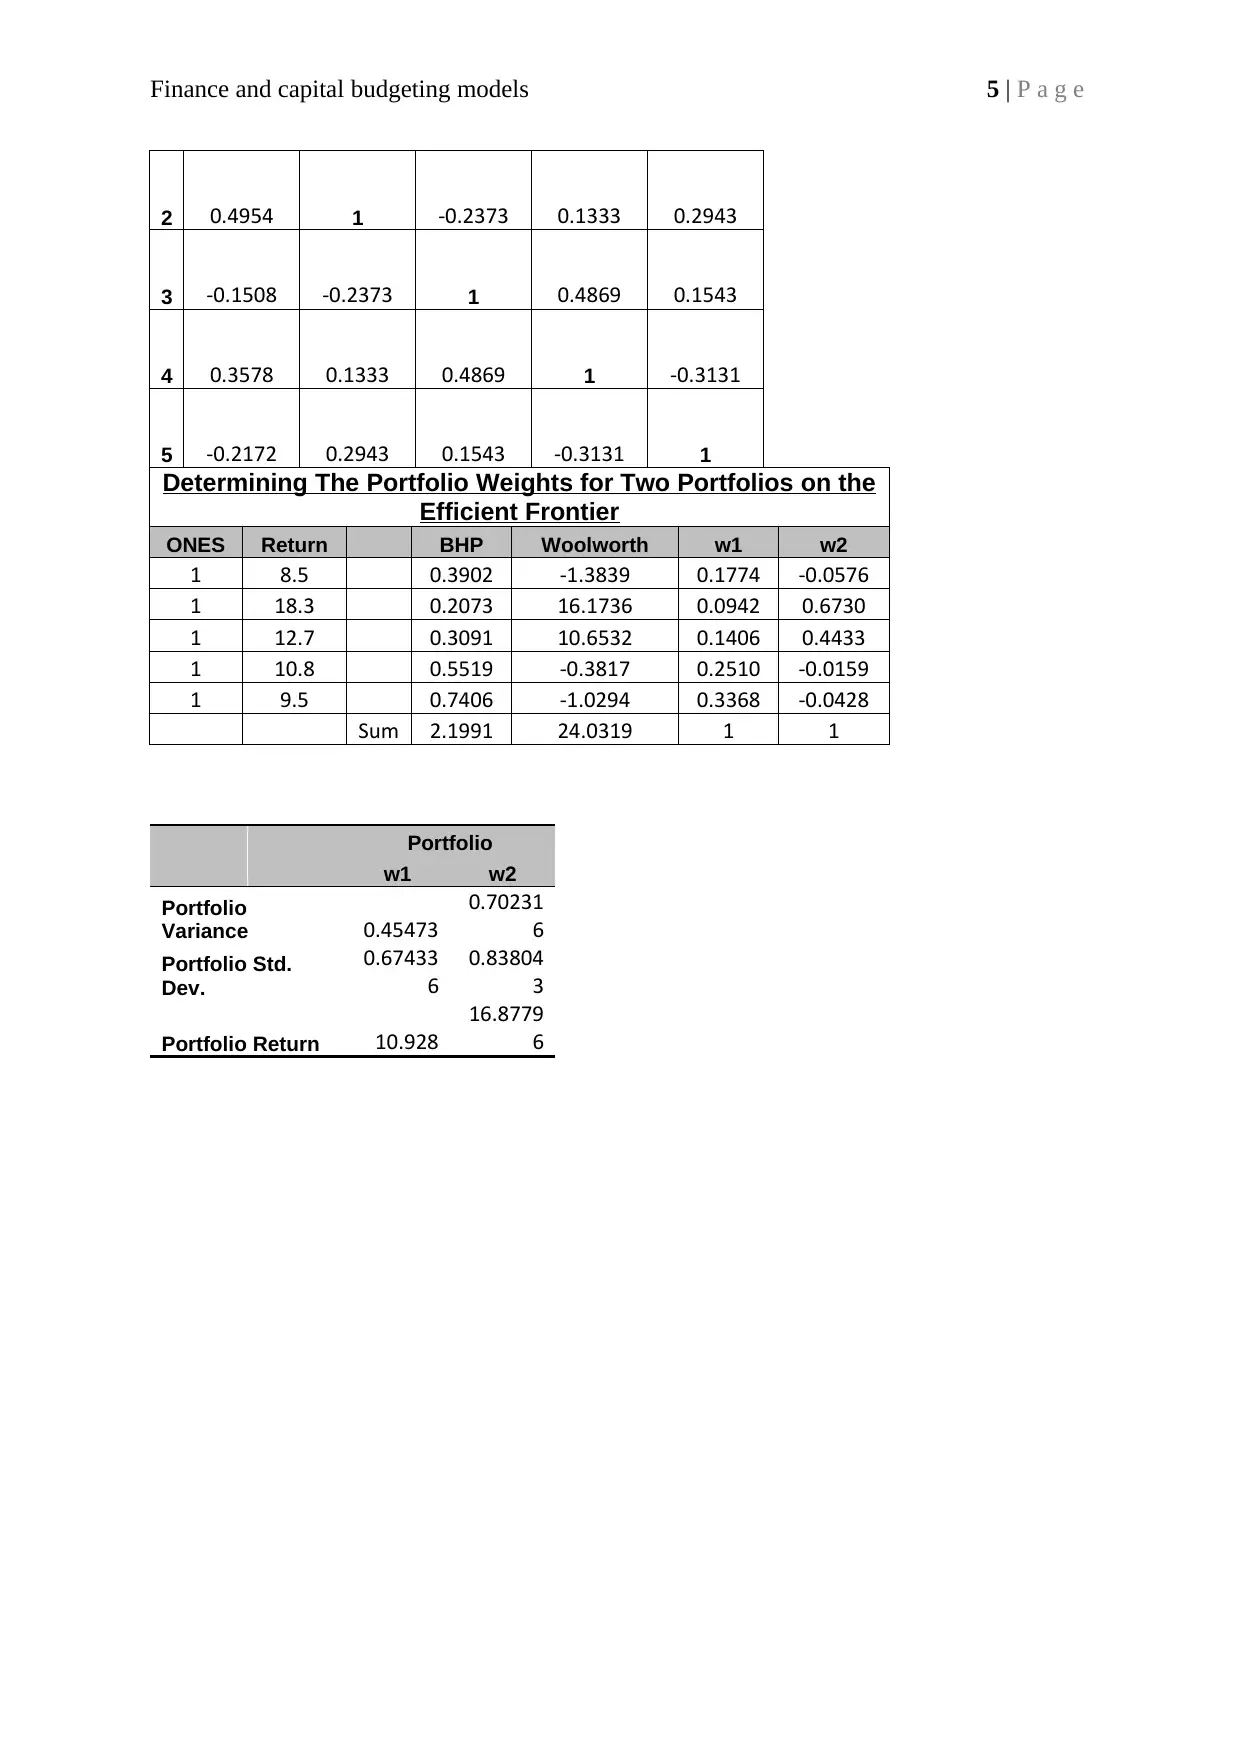
2 0.4954 1 -0.2373 0.1333 0.2943
3 -0.1508 -0.2373 1 0.4869 0.1543
4 0.3578 0.1333 0.4869 1 -0.3131
5 -0.2172 0.2943 0.1543 -0.3131 1
Determining The Portfolio Weights for Two Portfolios on the
Efficient Frontier
ONES Return BHP Woolworth w1 w2
1 8.5 0.3902 -1.3839 0.1774 -0.0576
1 18.3 0.2073 16.1736 0.0942 0.6730
1 12.7 0.3091 10.6532 0.1406 0.4433
1 10.8 0.5519 -0.3817 0.2510 -0.0159
1 9.5 0.7406 -1.0294 0.3368 -0.0428
Sum 2.1991 24.0319 1 1
Portfolio
w1 w2
Portfolio
Variance 0.45473
0.70231
6
Portfolio Std.
Dev.
0.67433
6
0.83804
3
Portfolio Return 10.928
16.8779
6
Finance and capital budgeting models 6 | P a g e
0.6 0.8 1 1.2 1.4 1.6 1.8 2 2.2-5
0
5
10
15
20
25
30
35
40
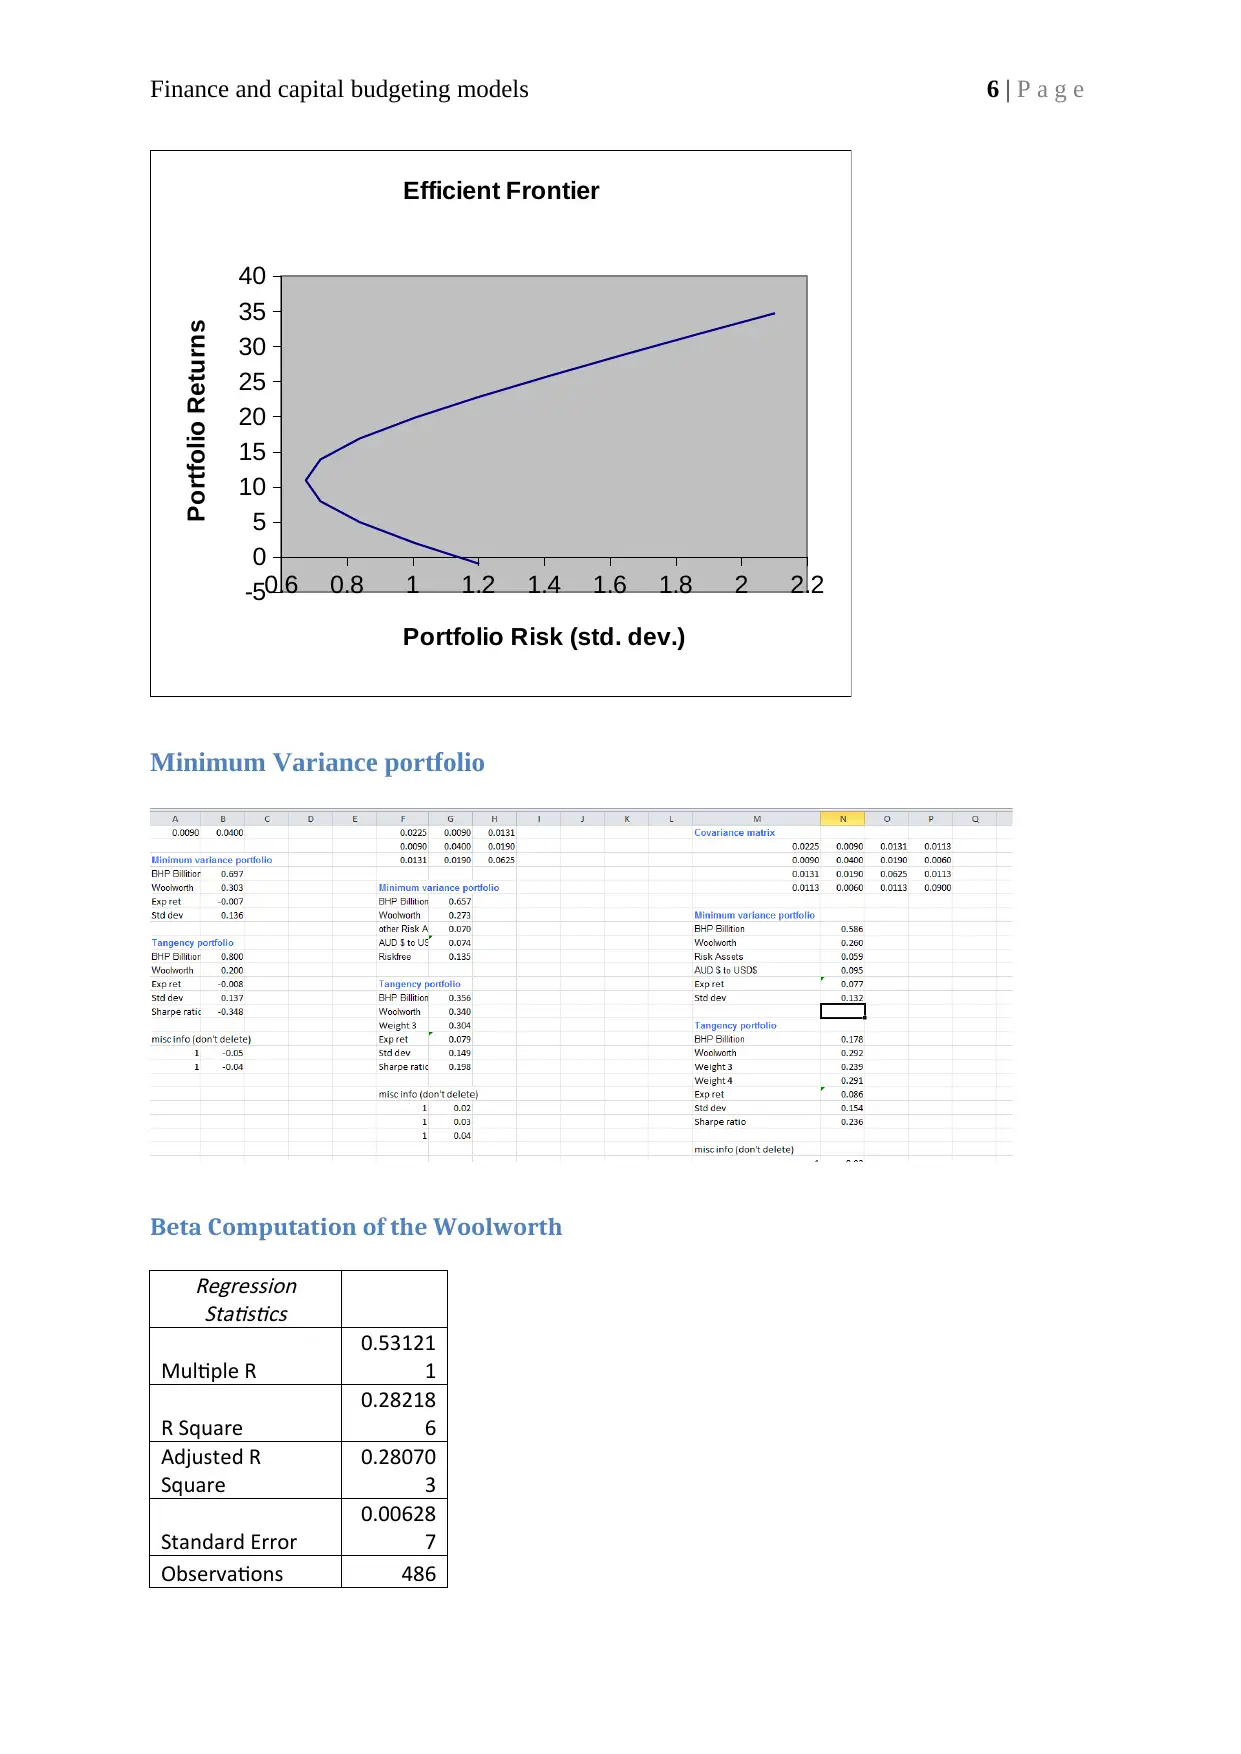
Efficient Frontier
Portfolio Risk (std. dev.)
Portfolio Returns
Minimum Variance portfolio
Beta Computation of the WoolworthRegression
Statistics
Multiple R
0.53121
1
R Square
0.28218
6
Adjusted R
Square
0.28070
3
Standard Error
0.00628
7
Observations 486
0.6 0.8 1 1.2 1.4 1.6 1.8 2 2.2-5
0
5
10
15
20
25
30
35
40
Efficient Frontier
Portfolio Risk (std. dev.)
Portfolio Returns
Minimum Variance portfolio
Beta Computation of the WoolworthRegression
Statistics
Multiple R
0.53121
1
R Square
0.28218
6
Adjusted R
Square
0.28070
3
Standard Error
0.00628
7
Observations 486
⊘ This is a preview!⊘
Do you want full access?
Subscribe today to unlock all pages.
Trusted by 1+ million students worldwide
Finance and capital budgeting models 7 | P a g e
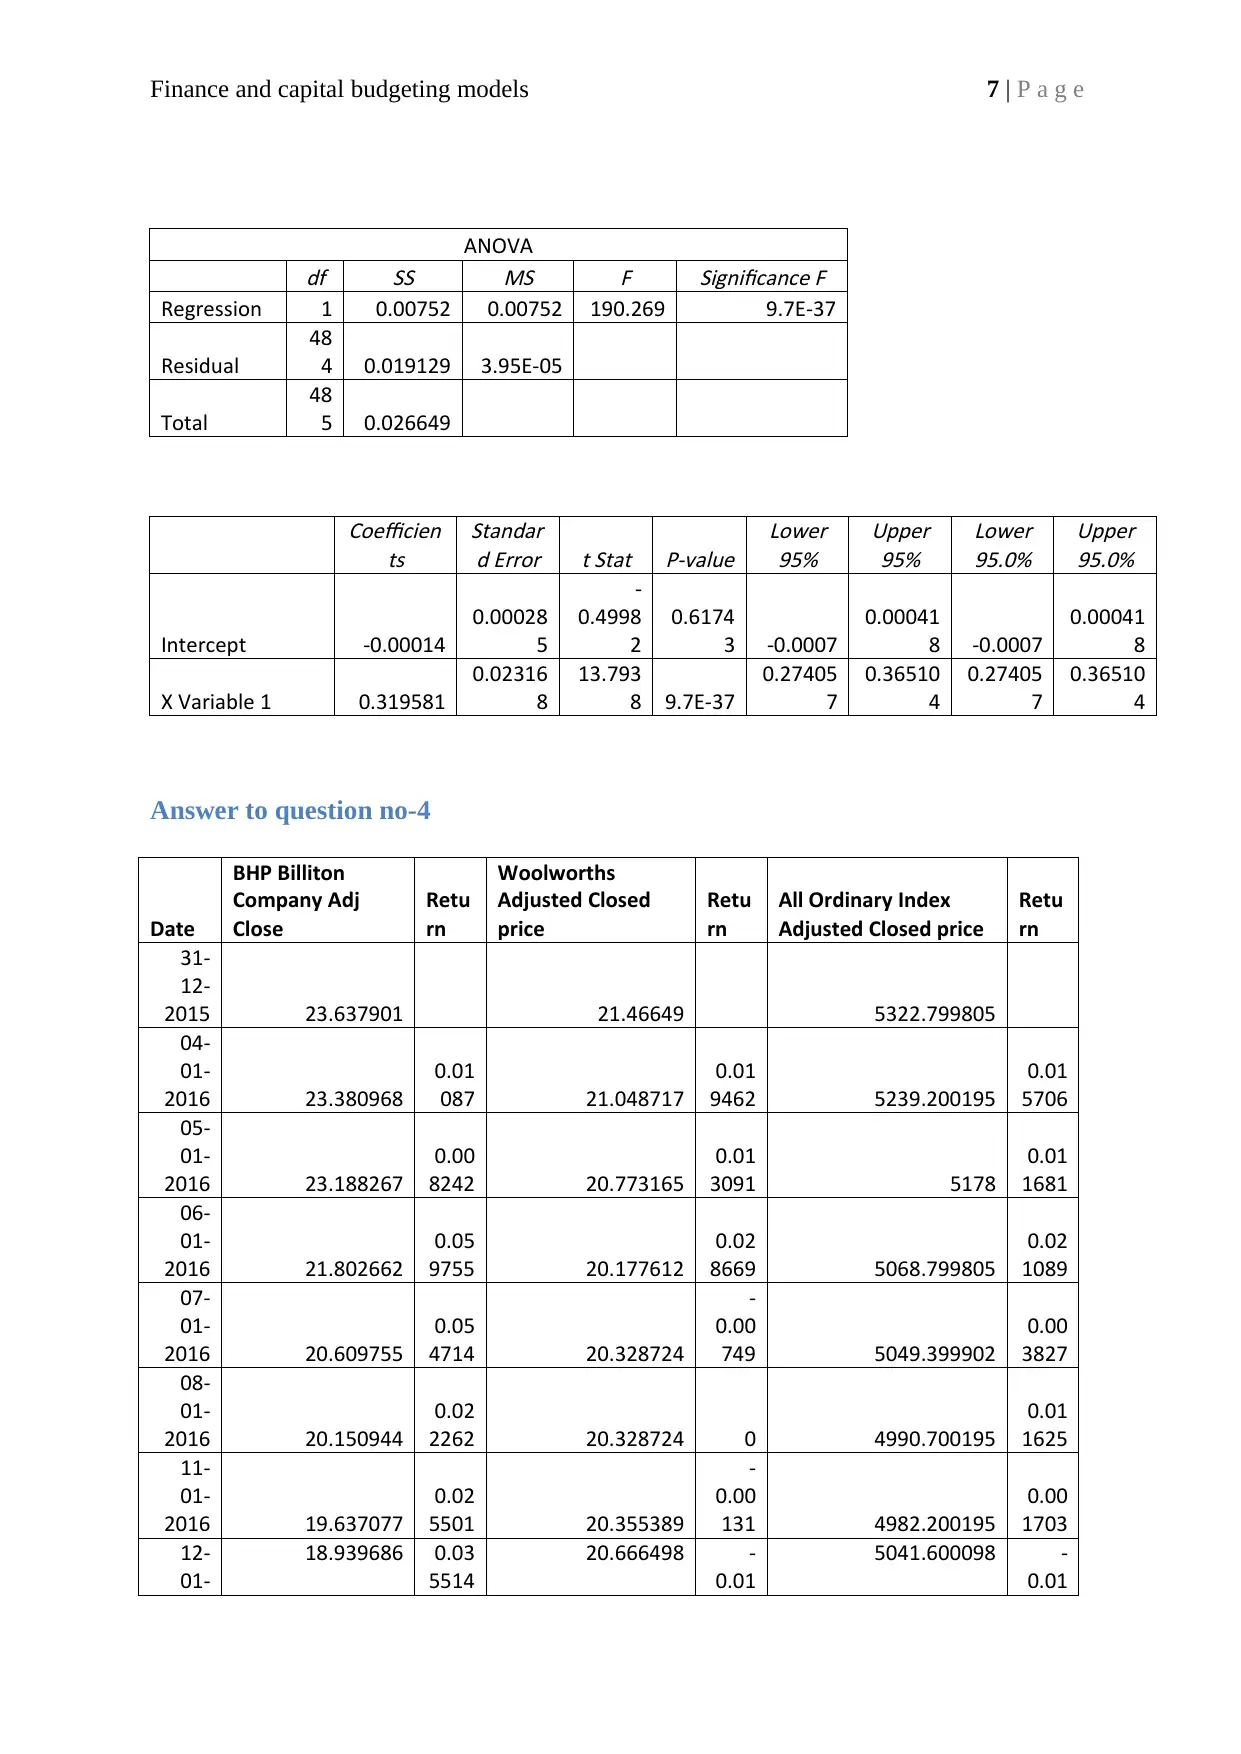
ANOVA
df SS
MS F Significance F
Regression 1 0.00752 0.00752 190.269 9.7E-37
Residual
48
4 0.019129 3.95E-05
Total
48
5 0.026649
Coefficien
ts
Standar
d Error t Stat P-value
Lower
95%
Upper
95%
Lower
95.0%
Upper
95.0%
Intercept -0.00014
0.00028
5
-
0.4998
2
0.6174
3 -0.0007
0.00041
8 -0.0007
0.00041
8
X Variable 1 0.319581
0.02316
8
13.793
8 9.7E-37
0.27405
7
0.36510
4
0.27405
7
0.36510
4
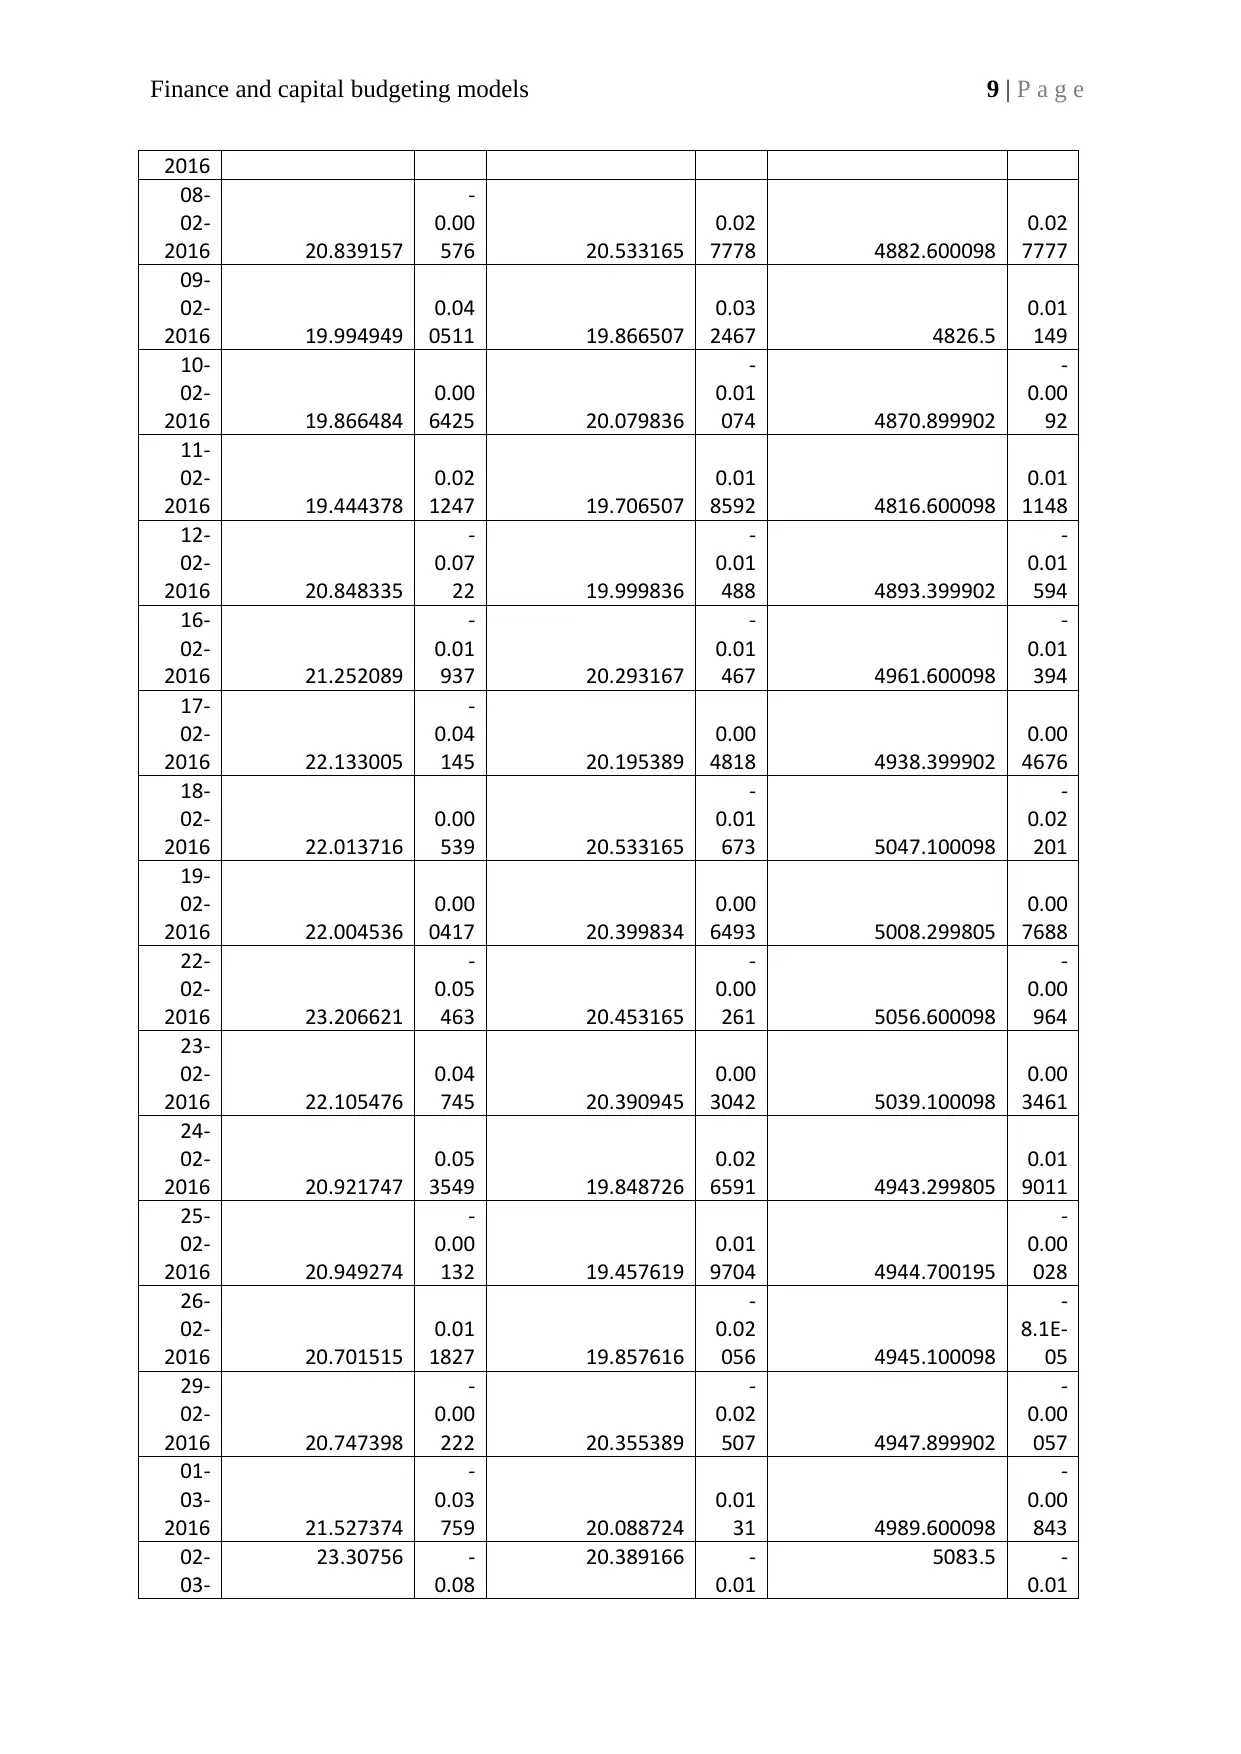
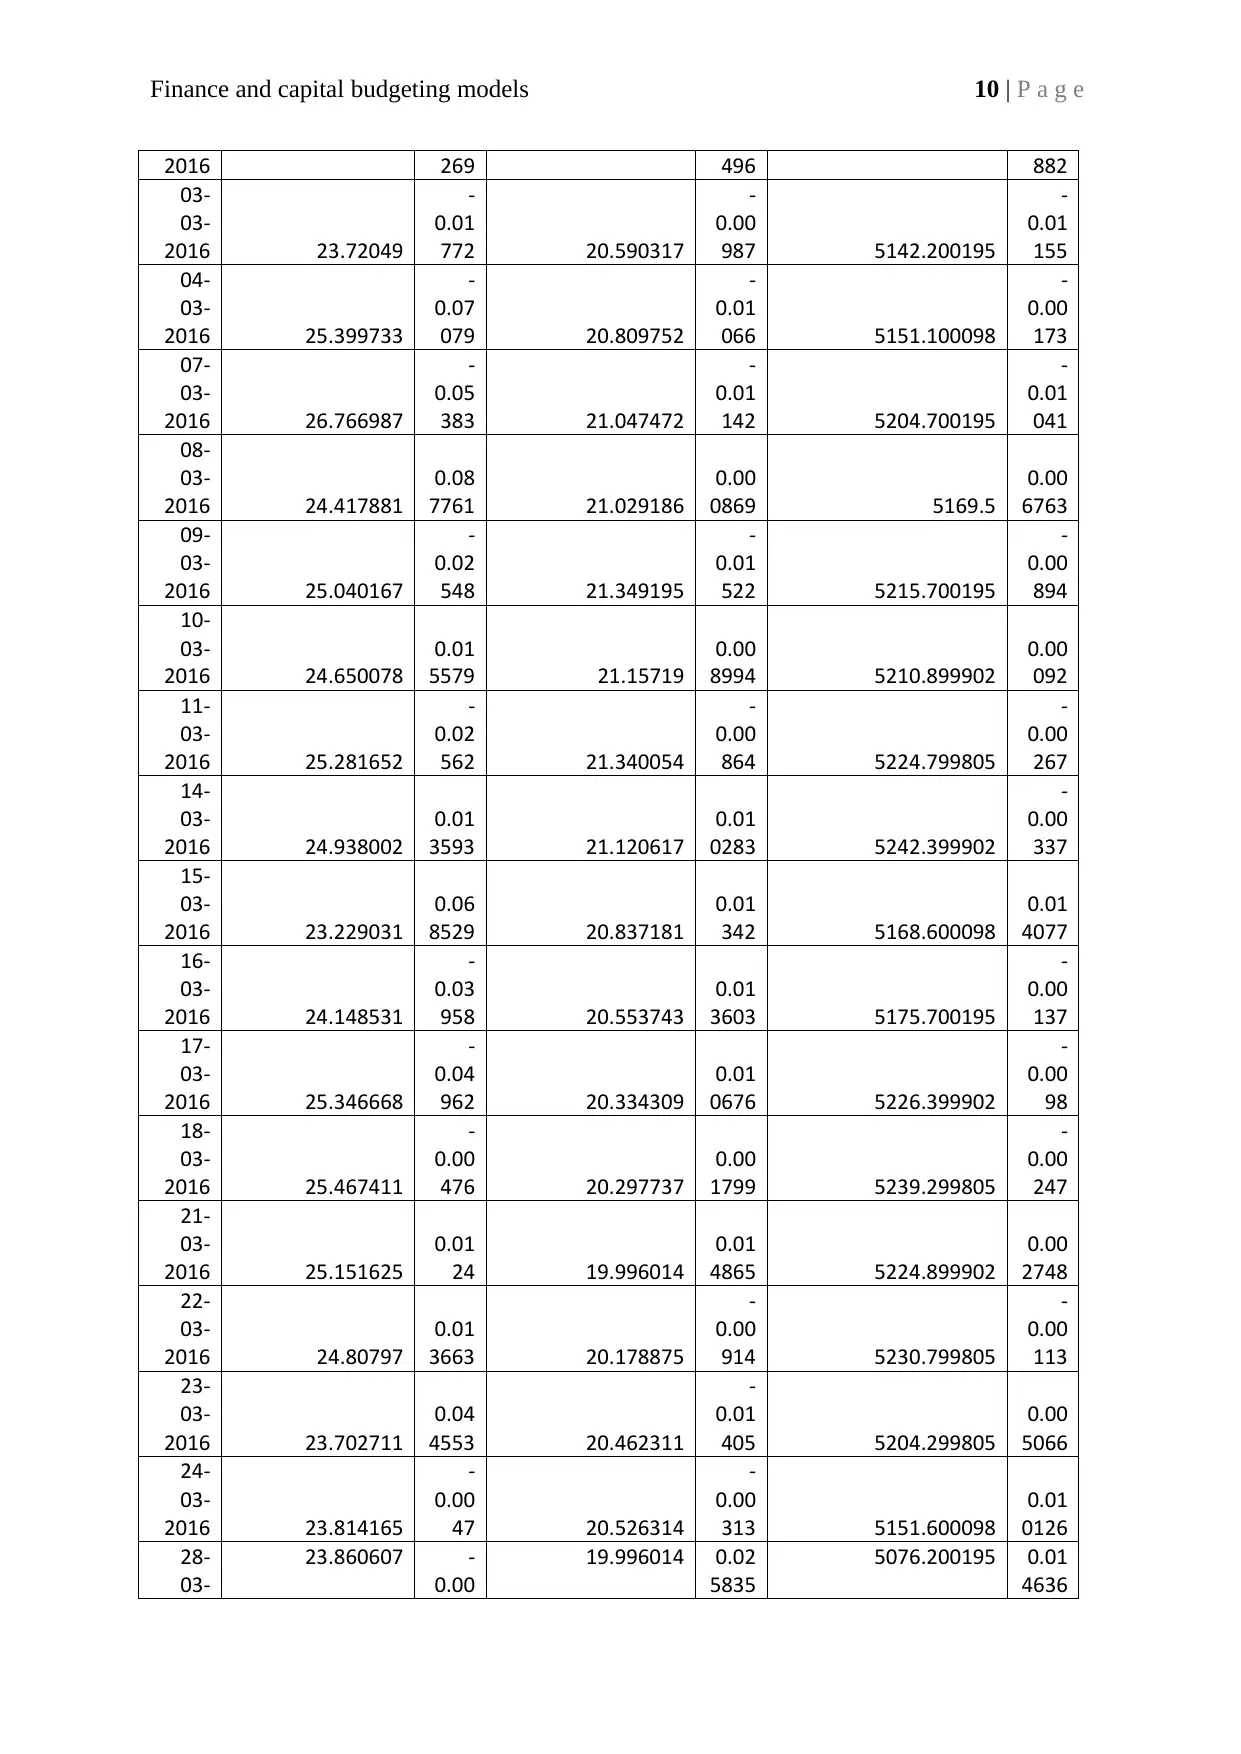
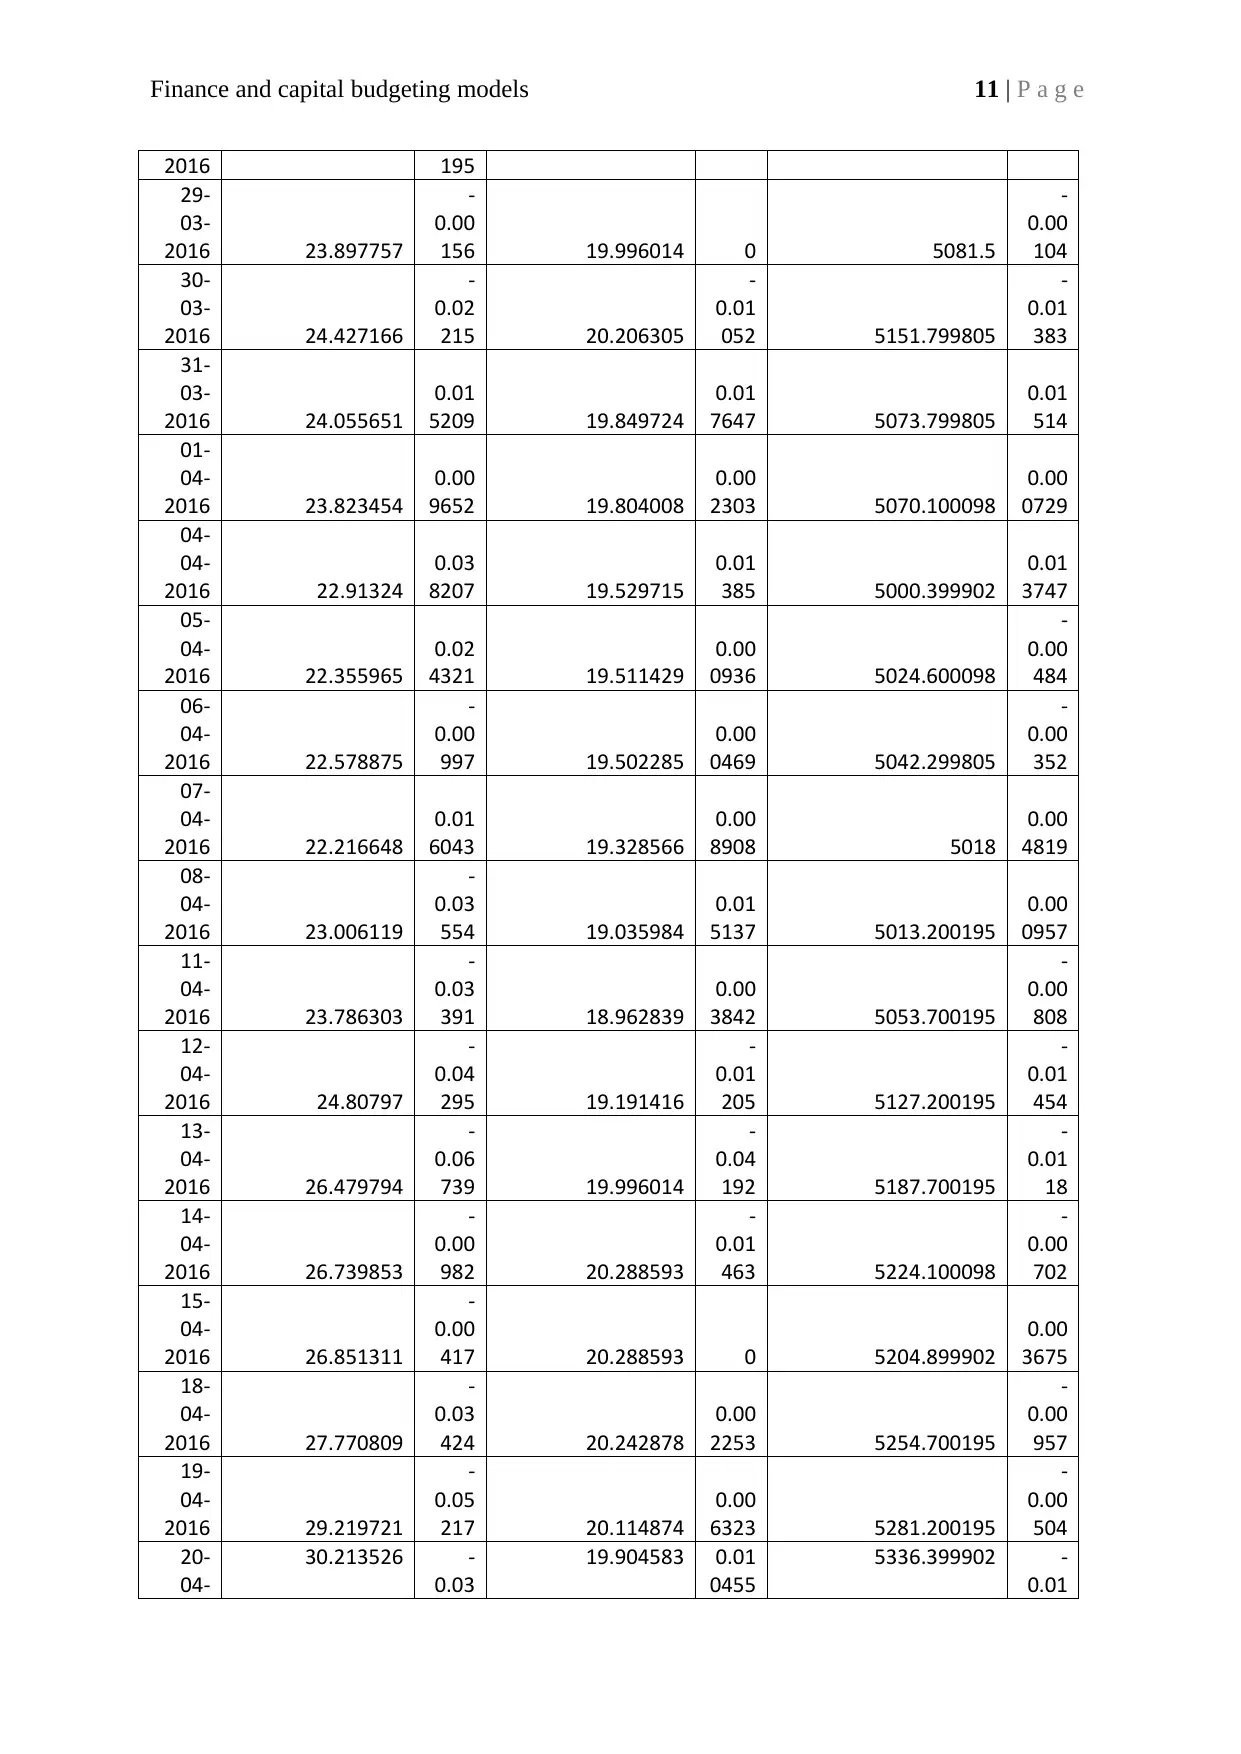
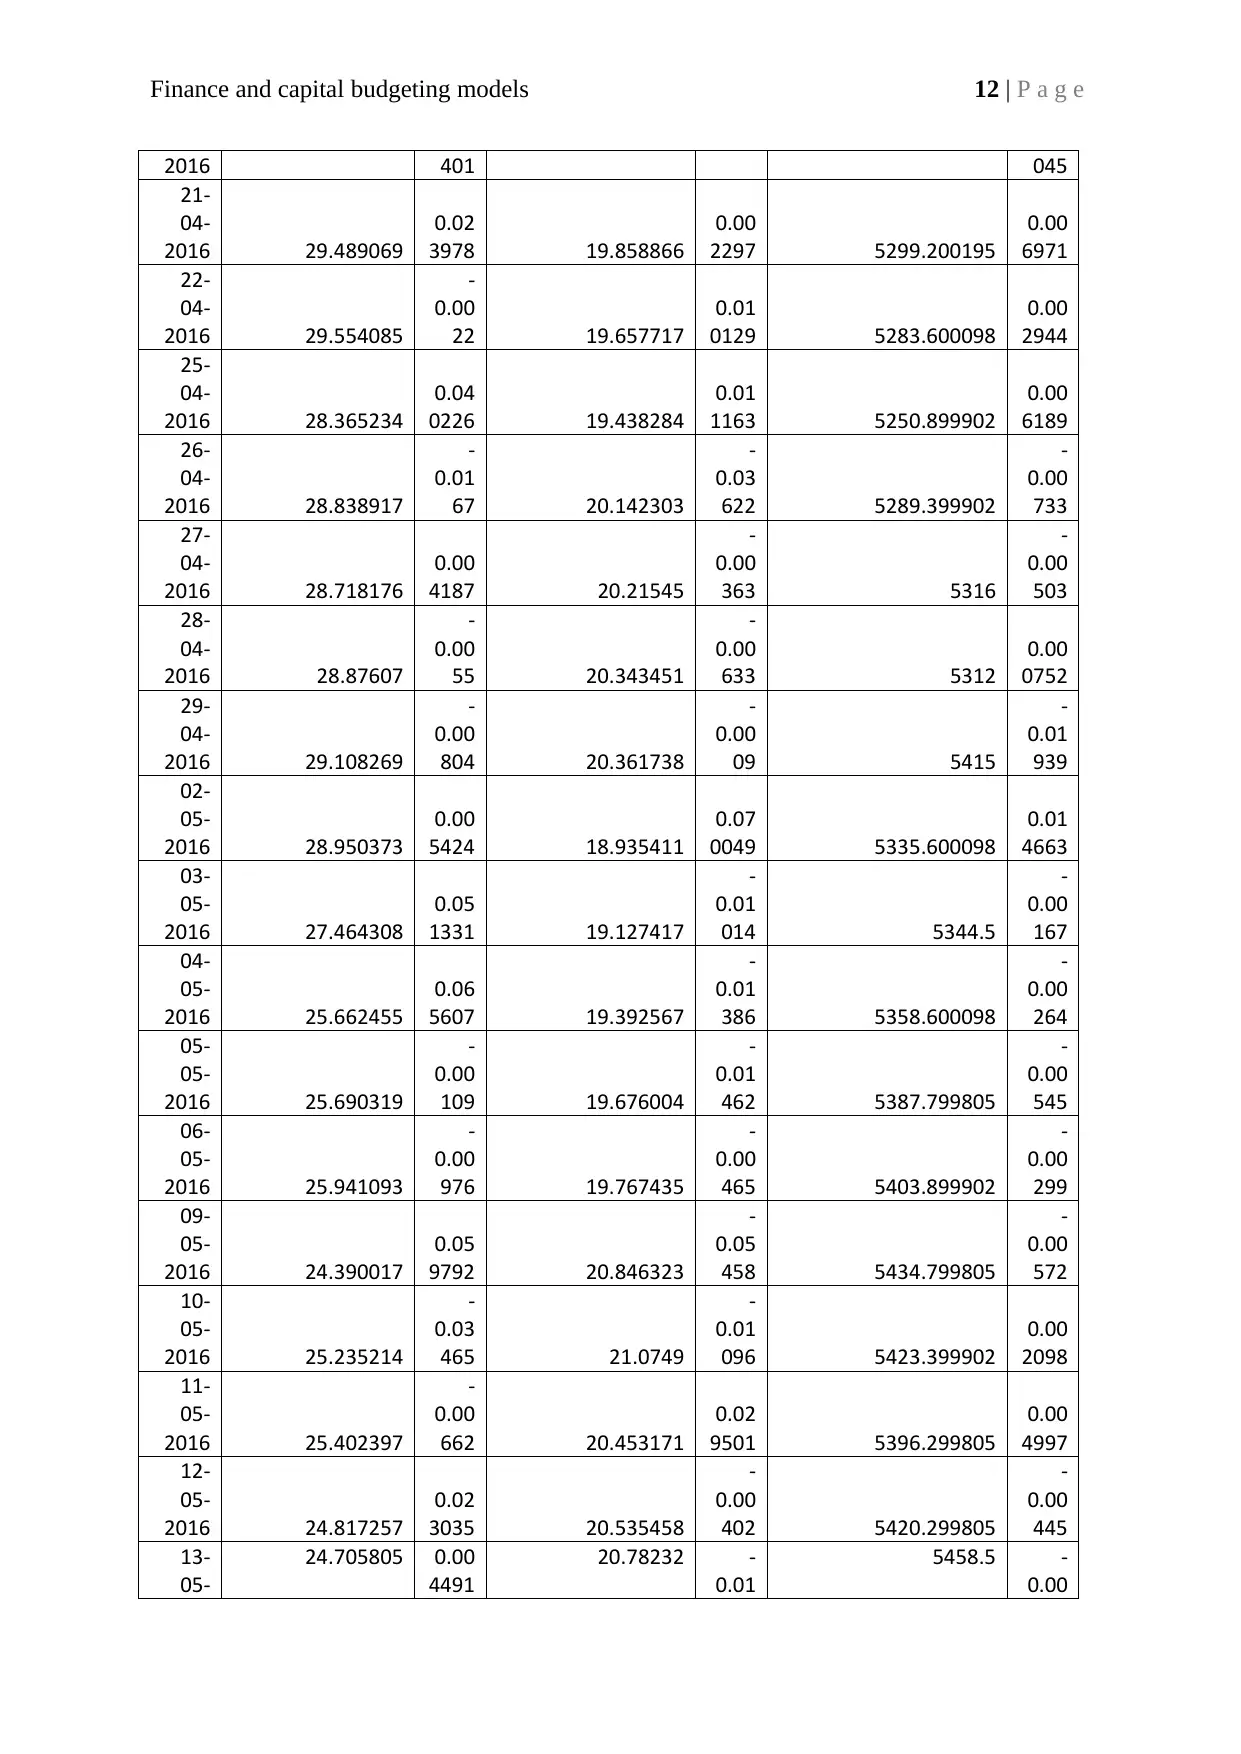
Answer to question no-4
Date
BHP Billiton
Company Adj
Close
Retu
rn
Woolworths
Adjusted Closed
price
Retu
rn
All Ordinary Index
Adjusted Closed price
Retu
rn
31-
12-
2015 23.637901 21.46649 5322.799805
04-
01-
2016 23.380968
0.01
087 21.048717
0.01
9462 5239.200195
0.01
5706
05-
01-
2016 23.188267
0.00
8242 20.773165
0.01
3091 5178
0.01
1681
06-
01-
2016 21.802662
0.05
9755 20.177612
0.02
8669 5068.799805
0.02
1089
07-
01-
2016 20.609755
0.05
4714 20.328724
-
0.00
749 5049.399902
0.00
3827
08-
01-
2016 20.150944
0.02
2262 20.328724 0 4990.700195
0.01
1625
11-
01-
2016 19.637077
0.02
5501 20.355389
-
0.00
131 4982.200195
0.00
1703
12-
01-
18.939686 0.03
5514
20.666498 -
0.01
5041.600098 -
0.01
ANOVA
df SS
MS F Significance F
Regression 1 0.00752 0.00752 190.269 9.7E-37
Residual
48
4 0.019129 3.95E-05
Total
48
5 0.026649
Coefficien
ts
Standar
d Error t Stat P-value
Lower
95%
Upper
95%
Lower
95.0%
Upper
95.0%
Intercept -0.00014
0.00028
5
-
0.4998
2
0.6174
3 -0.0007
0.00041
8 -0.0007
0.00041
8
X Variable 1 0.319581
0.02316
8
13.793
8 9.7E-37
0.27405
7
0.36510
4
0.27405
7
0.36510
4
Answer to question no-4
Date
BHP Billiton
Company Adj
Close
Retu
rn
Woolworths
Adjusted Closed
price
Retu
rn
All Ordinary Index
Adjusted Closed price
Retu
rn
31-
12-
2015 23.637901 21.46649 5322.799805
04-
01-
2016 23.380968
0.01
087 21.048717
0.01
9462 5239.200195
0.01
5706
05-
01-
2016 23.188267
0.00
8242 20.773165
0.01
3091 5178
0.01
1681
06-
01-
2016 21.802662
0.05
9755 20.177612
0.02
8669 5068.799805
0.02
1089
07-
01-
2016 20.609755
0.05
4714 20.328724
-
0.00
749 5049.399902
0.00
3827
08-
01-
2016 20.150944
0.02
2262 20.328724 0 4990.700195
0.01
1625
11-
01-
2016 19.637077
0.02
5501 20.355389
-
0.00
131 4982.200195
0.00
1703
12-
01-
18.939686 0.03
5514
20.666498 -
0.01
5041.600098 -
0.01
Paraphrase This Document
Need a fresh take? Get an instant paraphrase of this document with our AI Paraphraser
Finance and capital budgeting models 8 | P a g e
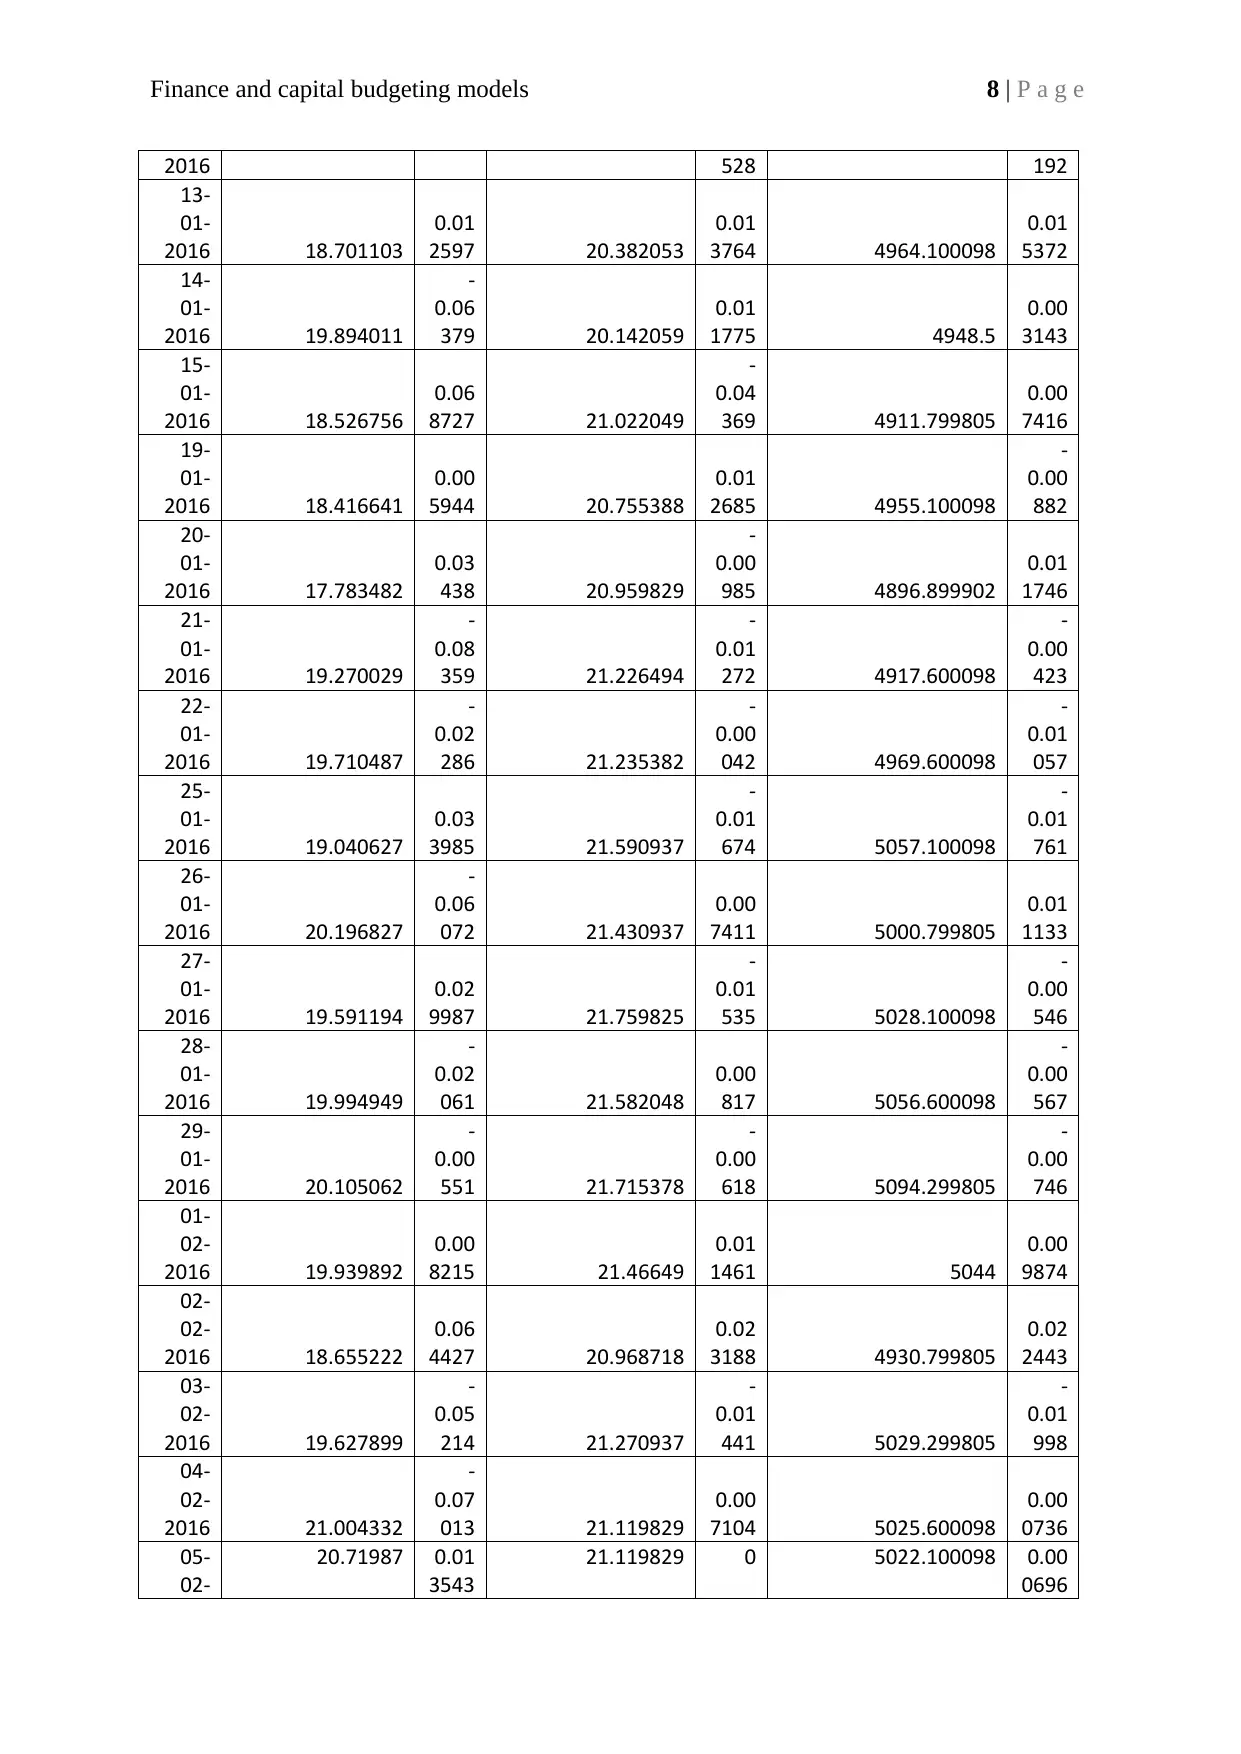
2016 528 192
13-
01-
2016 18.701103
0.01
2597 20.382053
0.01
3764 4964.100098
0.01
5372
14-
01-
2016 19.894011
-
0.06
379 20.142059
0.01
1775 4948.5
0.00
3143
15-
01-
2016 18.526756
0.06
8727 21.022049
-
0.04
369 4911.799805
0.00
7416
19-
01-
2016 18.416641
0.00
5944 20.755388
0.01
2685 4955.100098
-
0.00
882
20-
01-
2016 17.783482
0.03
438 20.959829
-
0.00
985 4896.899902
0.01
1746
21-
01-
2016 19.270029
-
0.08
359 21.226494
-
0.01
272 4917.600098
-
0.00
423
22-
01-
2016 19.710487
-
0.02
286 21.235382
-
0.00
042 4969.600098
-
0.01
057
25-
01-
2016 19.040627
0.03
3985 21.590937
-
0.01
674 5057.100098
-
0.01
761
26-
01-
2016 20.196827
-
0.06
072 21.430937
0.00
7411 5000.799805
0.01
1133
27-
01-
2016 19.591194
0.02
9987 21.759825
-
0.01
535 5028.100098
-
0.00
546
28-
01-
2016 19.994949
-
0.02
061 21.582048
0.00
817 5056.600098
-
0.00
567
29-
01-
2016 20.105062
-
0.00
551 21.715378
-
0.00
618 5094.299805
-
0.00
746
01-
02-
2016 19.939892
0.00
8215 21.46649
0.01
1461 5044
0.00
9874
02-
02-
2016 18.655222
0.06
4427 20.968718
0.02
3188 4930.799805
0.02
2443
03-
02-
2016 19.627899
-
0.05
214 21.270937
-
0.01
441 5029.299805
-
0.01
998
04-
02-
2016 21.004332
-
0.07
013 21.119829
0.00
7104 5025.600098
0.00
0736
05-
02-
20.71987 0.01
3543
21.119829 0 5022.100098 0.00
0696
Finance and capital budgeting models 9 | P a g e
2016
08-
02-
2016 20.839157
-
0.00
576 20.533165
0.02
7778 4882.600098
0.02
7777
09-
02-
2016 19.994949
0.04
0511 19.866507
0.03
2467 4826.5
0.01
149
10-
02-
2016 19.866484
0.00
6425 20.079836
-
0.01
074 4870.899902
-
0.00
92
11-
02-
2016 19.444378
0.02
1247 19.706507
0.01
8592 4816.600098
0.01
1148
12-
02-
2016 20.848335
-
0.07
22 19.999836
-
0.01
488 4893.399902
-
0.01
594
16-
02-
2016 21.252089
-
0.01
937 20.293167
-
0.01
467 4961.600098
-
0.01
394
17-
02-
2016 22.133005
-
0.04
145 20.195389
0.00
4818 4938.399902
0.00
4676
18-
02-
2016 22.013716
0.00
539 20.533165
-
0.01
673 5047.100098
-
0.02
201
19-
02-
2016 22.004536
0.00
0417 20.399834
0.00
6493 5008.299805
0.00
7688
22-
02-
2016 23.206621
-
0.05
463 20.453165
-
0.00
261 5056.600098
-
0.00
964
23-
02-
2016 22.105476
0.04
745 20.390945
0.00
3042 5039.100098
0.00
3461
24-
02-
2016 20.921747
0.05
3549 19.848726
0.02
6591 4943.299805
0.01
9011
25-
02-
2016 20.949274
-
0.00
132 19.457619
0.01
9704 4944.700195
-
0.00
028
26-
02-
2016 20.701515
0.01
1827 19.857616
-
0.02
056 4945.100098
-
8.1E-
05
29-
02-
2016 20.747398
-
0.00
222 20.355389
-
0.02
507 4947.899902
-
0.00
057
01-
03-
2016 21.527374
-
0.03
759 20.088724
0.01
31 4989.600098
-
0.00
843
02-
03-
23.30756 -
0.08
20.389166 -
0.01
5083.5 -
0.01
⊘ This is a preview!⊘
Do you want full access?
Subscribe today to unlock all pages.
Trusted by 1+ million students worldwide
Finance and capital budgeting models 10 | P a g e
2016 269 496 882
03-
03-
2016 23.72049
-
0.01
772 20.590317
-
0.00
987 5142.200195
-
0.01
155
04-
03-
2016 25.399733
-
0.07
079 20.809752
-
0.01
066 5151.100098
-
0.00
173
07-
03-
2016 26.766987
-
0.05
383 21.047472
-
0.01
142 5204.700195
-
0.01
041
08-
03-
2016 24.417881
0.08
7761 21.029186
0.00
0869 5169.5
0.00
6763
09-
03-
2016 25.040167
-
0.02
548 21.349195
-
0.01
522 5215.700195
-
0.00
894
10-
03-
2016 24.650078
0.01
5579 21.15719
0.00
8994 5210.899902
0.00
092
11-
03-
2016 25.281652
-
0.02
562 21.340054
-
0.00
864 5224.799805
-
0.00
267
14-
03-
2016 24.938002
0.01
3593 21.120617
0.01
0283 5242.399902
-
0.00
337
15-
03-
2016 23.229031
0.06
8529 20.837181
0.01
342 5168.600098
0.01
4077
16-
03-
2016 24.148531
-
0.03
958 20.553743
0.01
3603 5175.700195
-
0.00
137
17-
03-
2016 25.346668
-
0.04
962 20.334309
0.01
0676 5226.399902
-
0.00
98
18-
03-
2016 25.467411
-
0.00
476 20.297737
0.00
1799 5239.299805
-
0.00
247
21-
03-
2016 25.151625
0.01
24 19.996014
0.01
4865 5224.899902
0.00
2748
22-
03-
2016 24.80797
0.01
3663 20.178875
-
0.00
914 5230.799805
-
0.00
113
23-
03-
2016 23.702711
0.04
4553 20.462311
-
0.01
405 5204.299805
0.00
5066
24-
03-
2016 23.814165
-
0.00
47 20.526314
-
0.00
313 5151.600098
0.01
0126
28-
03-
23.860607 -
0.00
19.996014 0.02
5835
5076.200195 0.01
4636
Paraphrase This Document
Need a fresh take? Get an instant paraphrase of this document with our AI Paraphraser
Finance and capital budgeting models 11 | P a g e
2016 195
29-
03-
2016 23.897757
-
0.00
156 19.996014 0 5081.5
-
0.00
104
30-
03-
2016 24.427166
-
0.02
215 20.206305
-
0.01
052 5151.799805
-
0.01
383
31-
03-
2016 24.055651
0.01
5209 19.849724
0.01
7647 5073.799805
0.01
514
01-
04-
2016 23.823454
0.00
9652 19.804008
0.00
2303 5070.100098
0.00
0729
04-
04-
2016 22.91324
0.03
8207 19.529715
0.01
385 5000.399902
0.01
3747
05-
04-
2016 22.355965
0.02
4321 19.511429
0.00
0936 5024.600098
-
0.00
484
06-
04-
2016 22.578875
-
0.00
997 19.502285
0.00
0469 5042.299805
-
0.00
352
07-
04-
2016 22.216648
0.01
6043 19.328566
0.00
8908 5018
0.00
4819
08-
04-
2016 23.006119
-
0.03
554 19.035984
0.01
5137 5013.200195
0.00
0957
11-
04-
2016 23.786303
-
0.03
391 18.962839
0.00
3842 5053.700195
-
0.00
808
12-
04-
2016 24.80797
-
0.04
295 19.191416
-
0.01
205 5127.200195
-
0.01
454
13-
04-
2016 26.479794
-
0.06
739 19.996014
-
0.04
192 5187.700195
-
0.01
18
14-
04-
2016 26.739853
-
0.00
982 20.288593
-
0.01
463 5224.100098
-
0.00
702
15-
04-
2016 26.851311
-
0.00
417 20.288593 0 5204.899902
0.00
3675
18-
04-
2016 27.770809
-
0.03
424 20.242878
0.00
2253 5254.700195
-
0.00
957
19-
04-
2016 29.219721
-
0.05
217 20.114874
0.00
6323 5281.200195
-
0.00
504
20-
04-
30.213526 -
0.03
19.904583 0.01
0455
5336.399902 -
0.01
Finance and capital budgeting models 12 | P a g e
2016 401 045
21-
04-
2016 29.489069
0.02
3978 19.858866
0.00
2297 5299.200195
0.00
6971
22-
04-
2016 29.554085
-
0.00
22 19.657717
0.01
0129 5283.600098
0.00
2944
25-
04-
2016 28.365234
0.04
0226 19.438284
0.01
1163 5250.899902
0.00
6189
26-
04-
2016 28.838917
-
0.01
67 20.142303
-
0.03
622 5289.399902
-
0.00
733
27-
04-
2016 28.718176
0.00
4187 20.21545
-
0.00
363 5316
-
0.00
503
28-
04-
2016 28.87607
-
0.00
55 20.343451
-
0.00
633 5312
0.00
0752
29-
04-
2016 29.108269
-
0.00
804 20.361738
-
0.00
09 5415
-
0.01
939
02-
05-
2016 28.950373
0.00
5424 18.935411
0.07
0049 5335.600098
0.01
4663
03-
05-
2016 27.464308
0.05
1331 19.127417
-
0.01
014 5344.5
-
0.00
167
04-
05-
2016 25.662455
0.06
5607 19.392567
-
0.01
386 5358.600098
-
0.00
264
05-
05-
2016 25.690319
-
0.00
109 19.676004
-
0.01
462 5387.799805
-
0.00
545
06-
05-
2016 25.941093
-
0.00
976 19.767435
-
0.00
465 5403.899902
-
0.00
299
09-
05-
2016 24.390017
0.05
9792 20.846323
-
0.05
458 5434.799805
-
0.00
572
10-
05-
2016 25.235214
-
0.03
465 21.0749
-
0.01
096 5423.399902
0.00
2098
11-
05-
2016 25.402397
-
0.00
662 20.453171
0.02
9501 5396.299805
0.00
4997
12-
05-
2016 24.817257
0.02
3035 20.535458
-
0.00
402 5420.299805
-
0.00
445
13-
05-
24.705805 0.00
4491
20.78232 -
0.01
5458.5 -
0.00
⊘ This is a preview!⊘
Do you want full access?
Subscribe today to unlock all pages.
Trusted by 1+ million students worldwide
1 out of 48
Your All-in-One AI-Powered Toolkit for Academic Success.
+13062052269
info@desklib.com
Available 24*7 on WhatsApp / Email
![[object Object]](/_next/static/media/star-bottom.7253800d.svg)
Unlock your academic potential
Copyright © 2020–2026 A2Z Services. All Rights Reserved. Developed and managed by ZUCOL.