Capital Budgeting Project: Investment Decisions and Financial Analysis
VerifiedAdded on  2020/03/04
|16
|2018
|98
Project
AI Summary
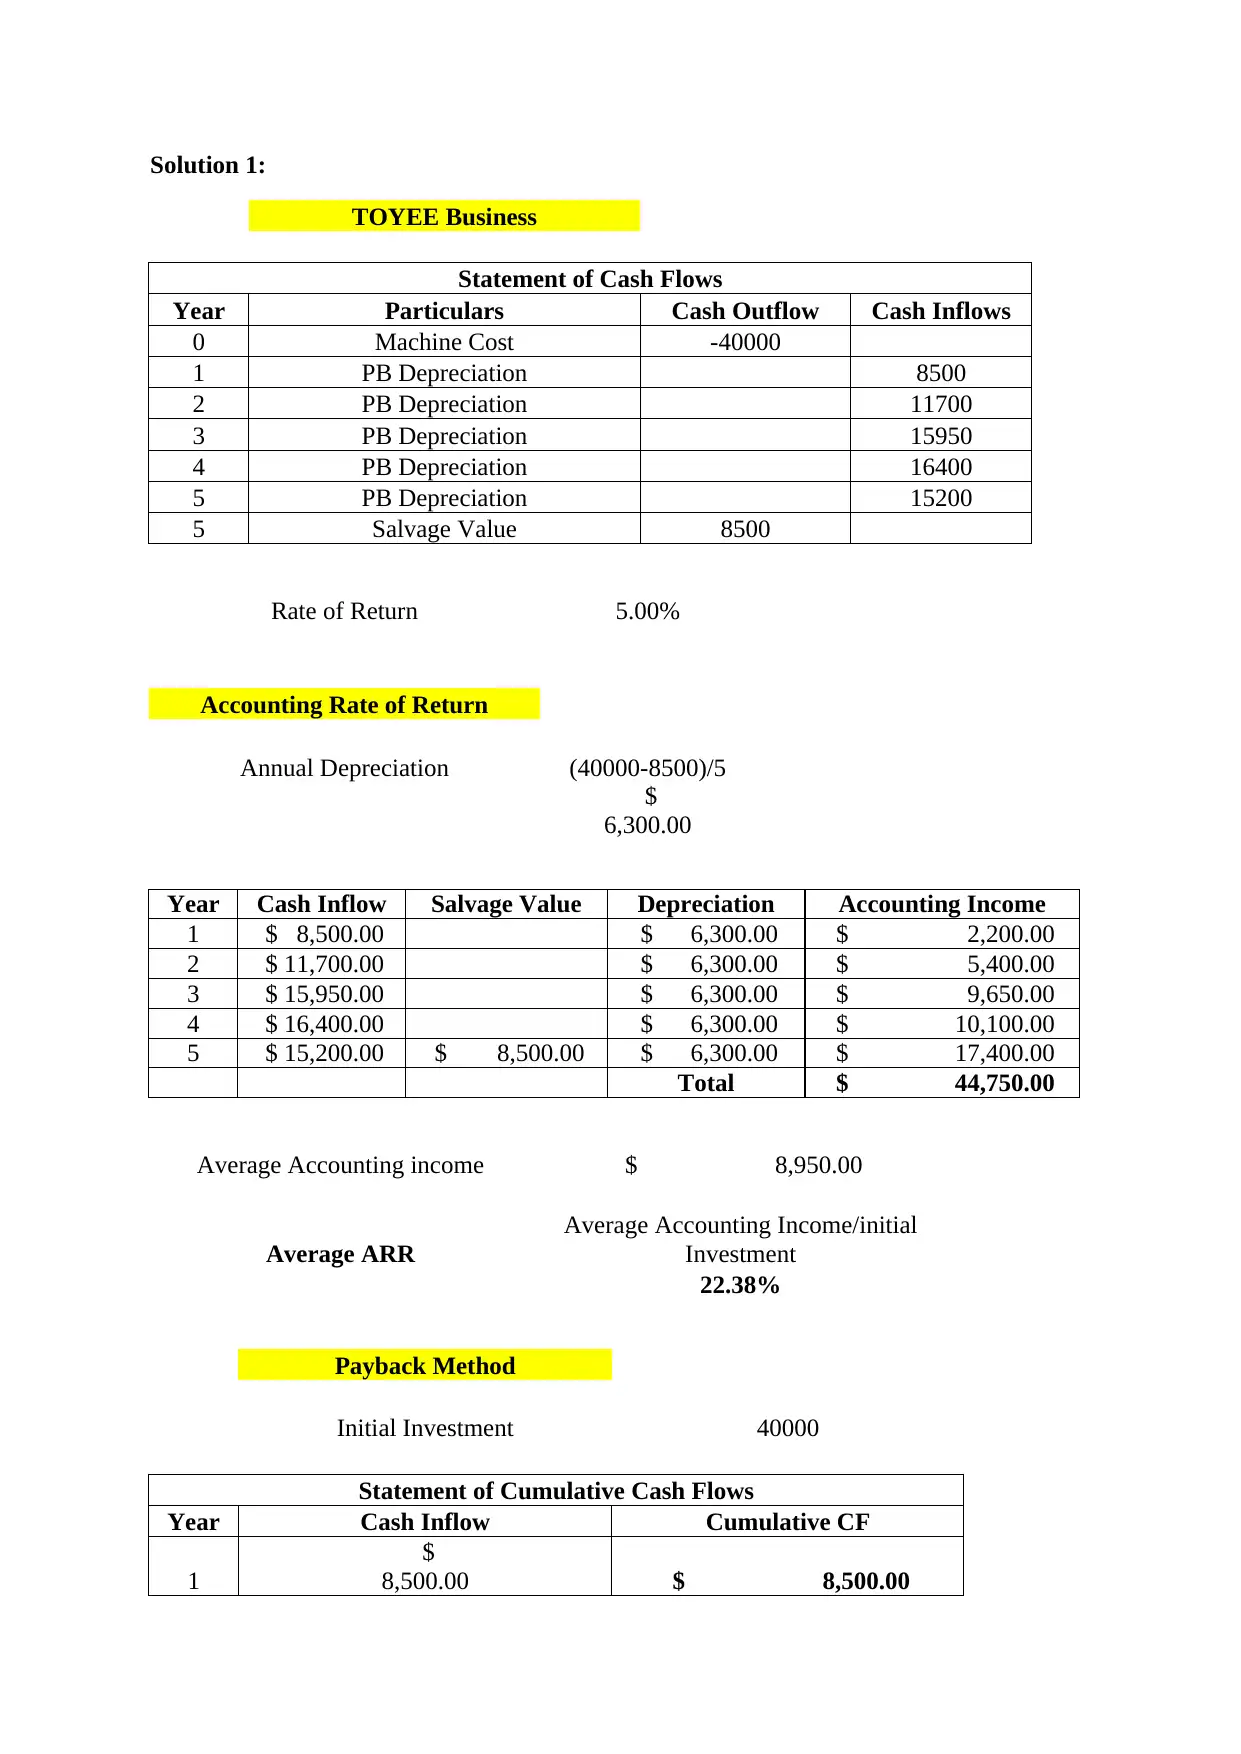
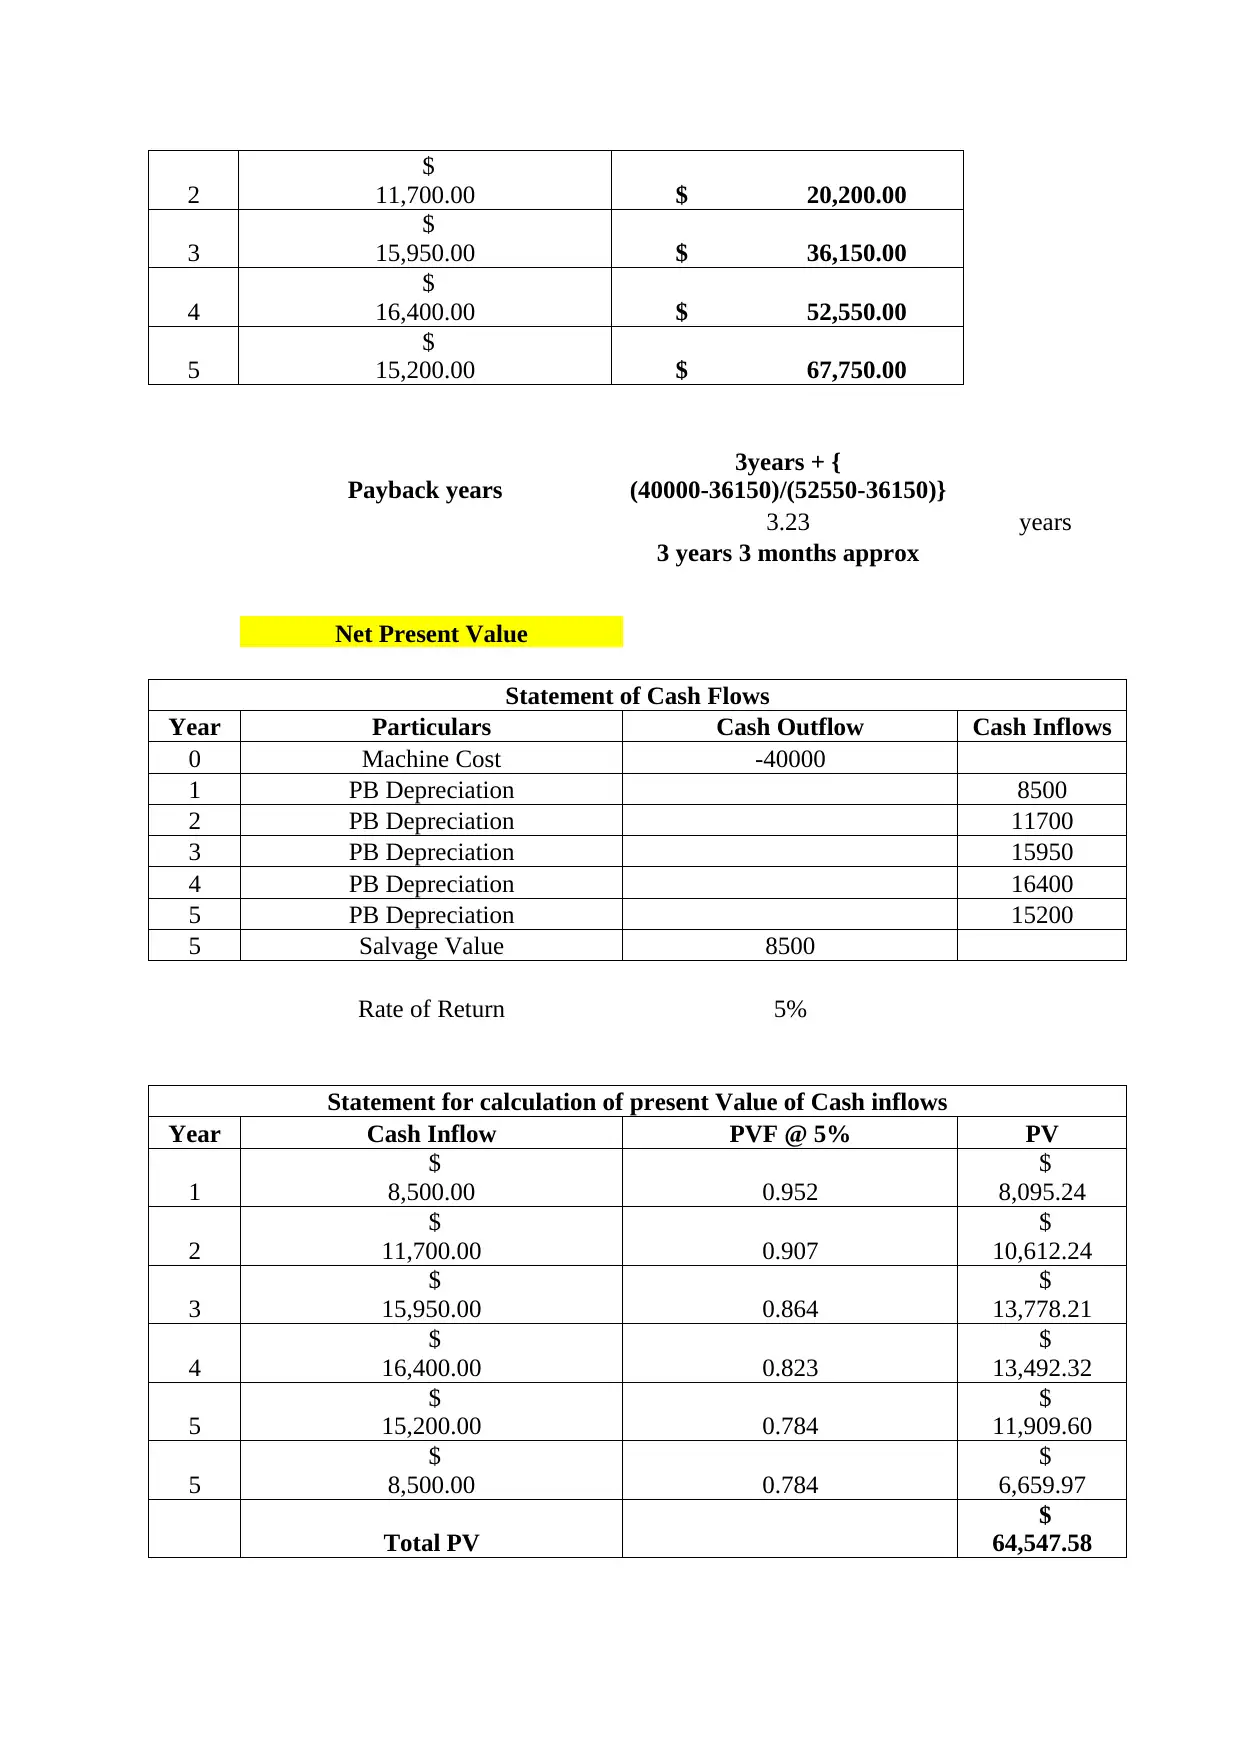
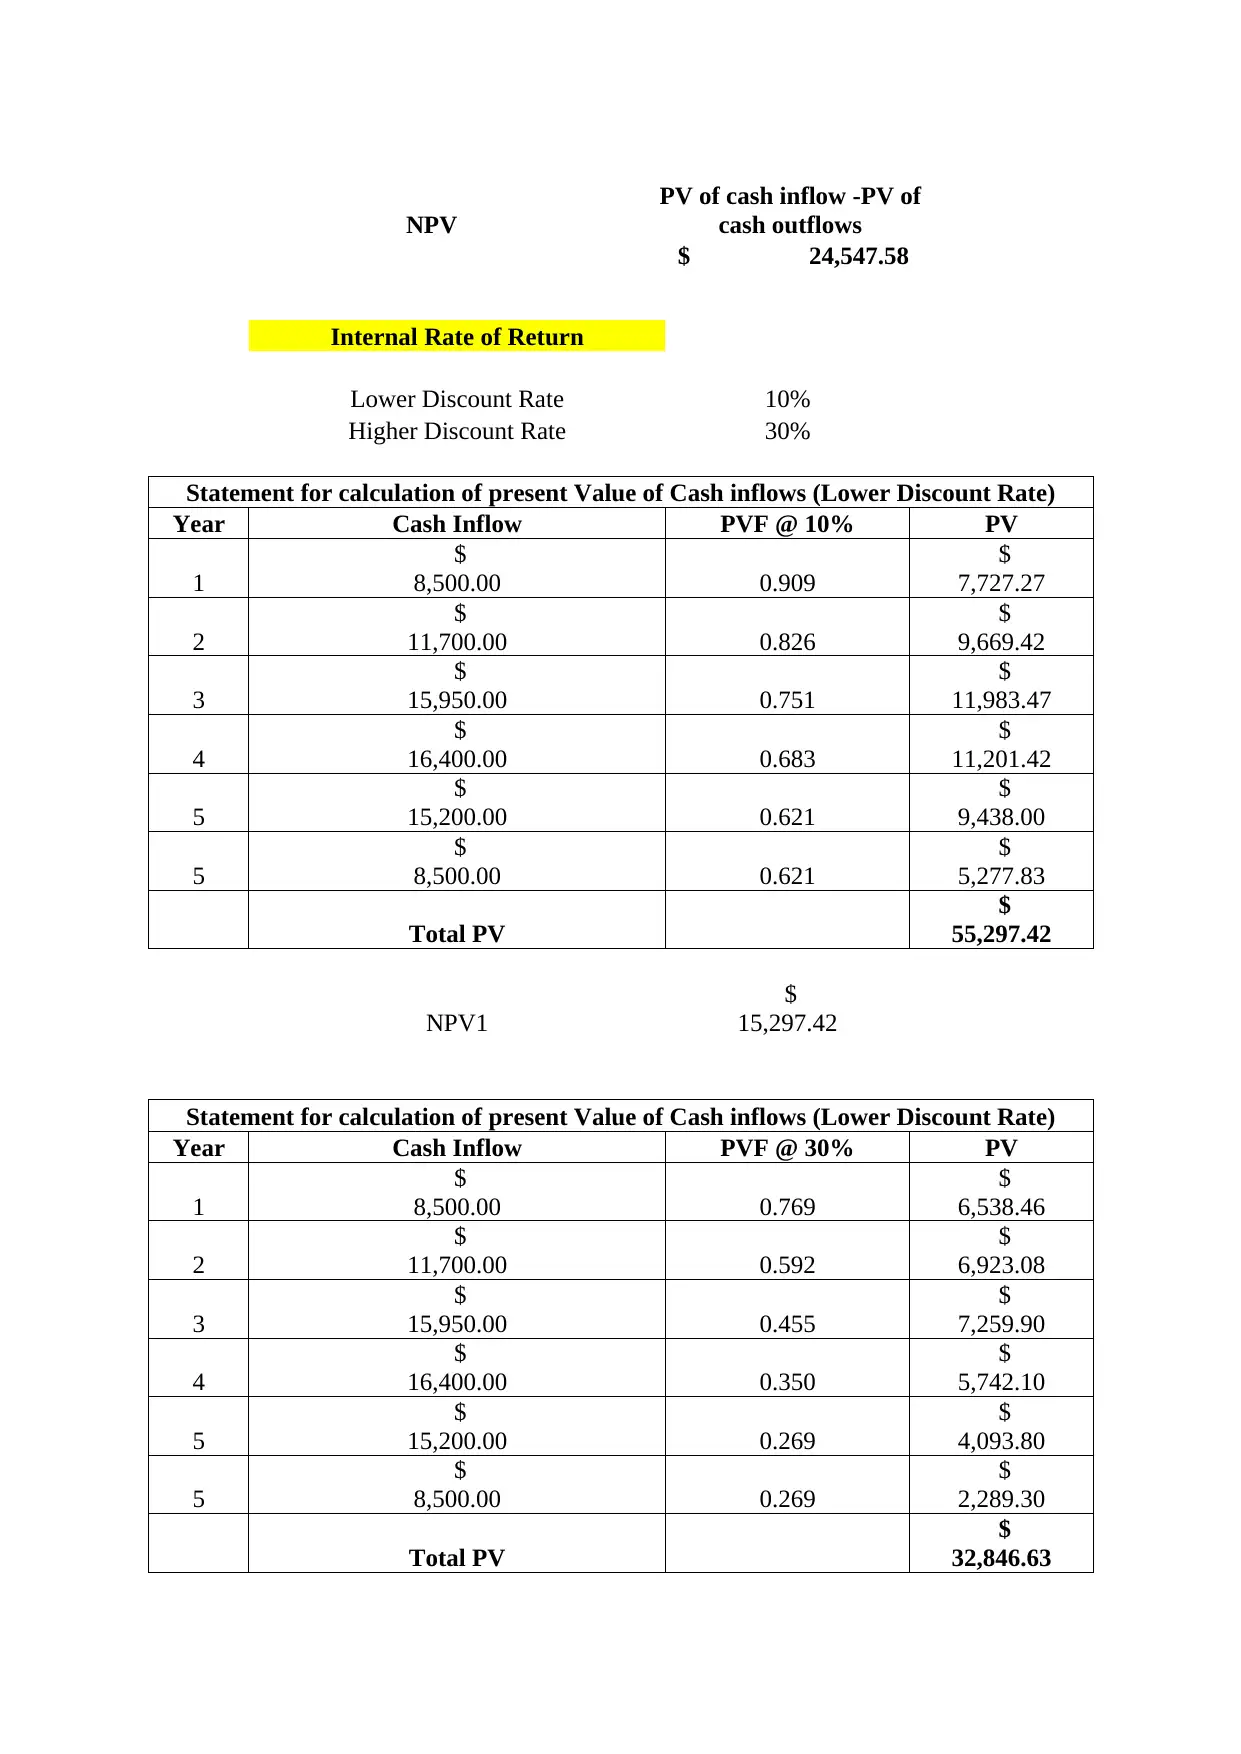
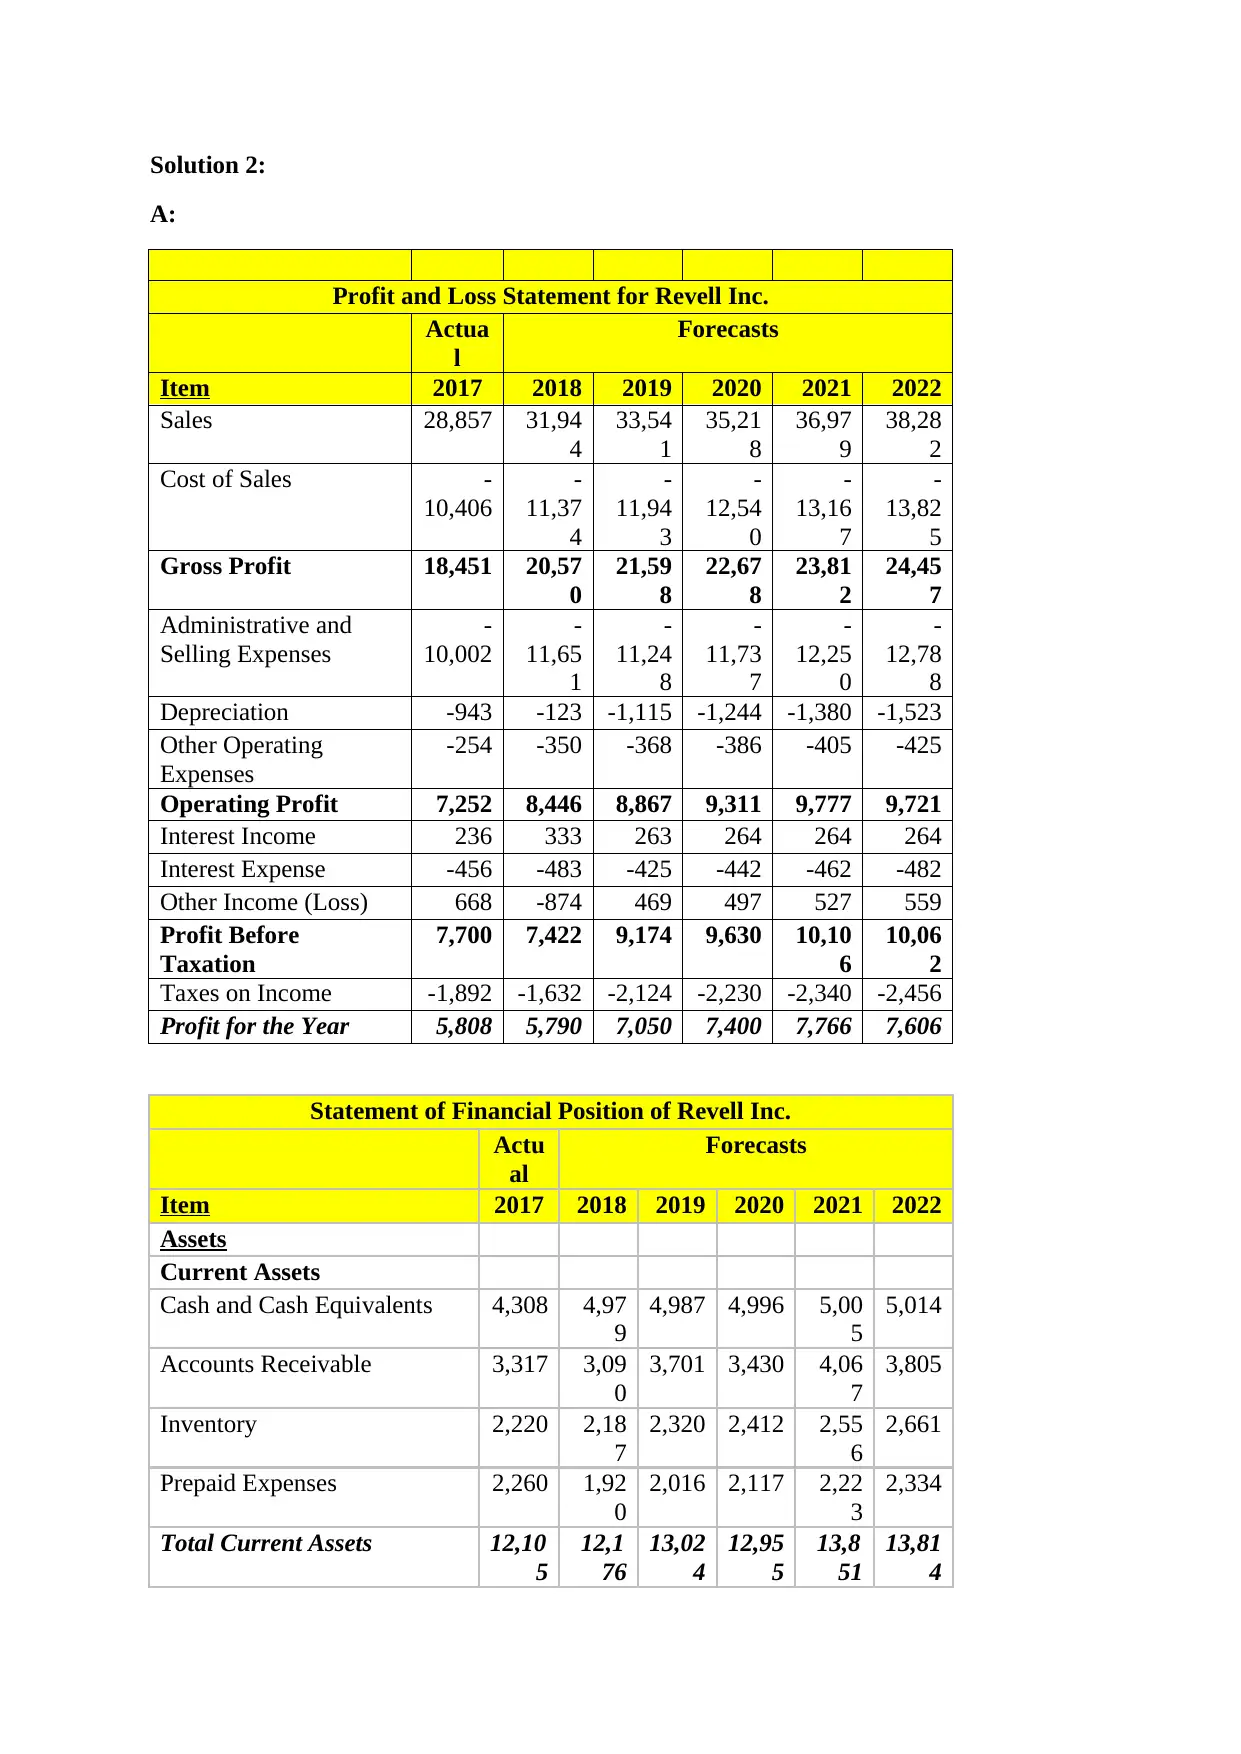
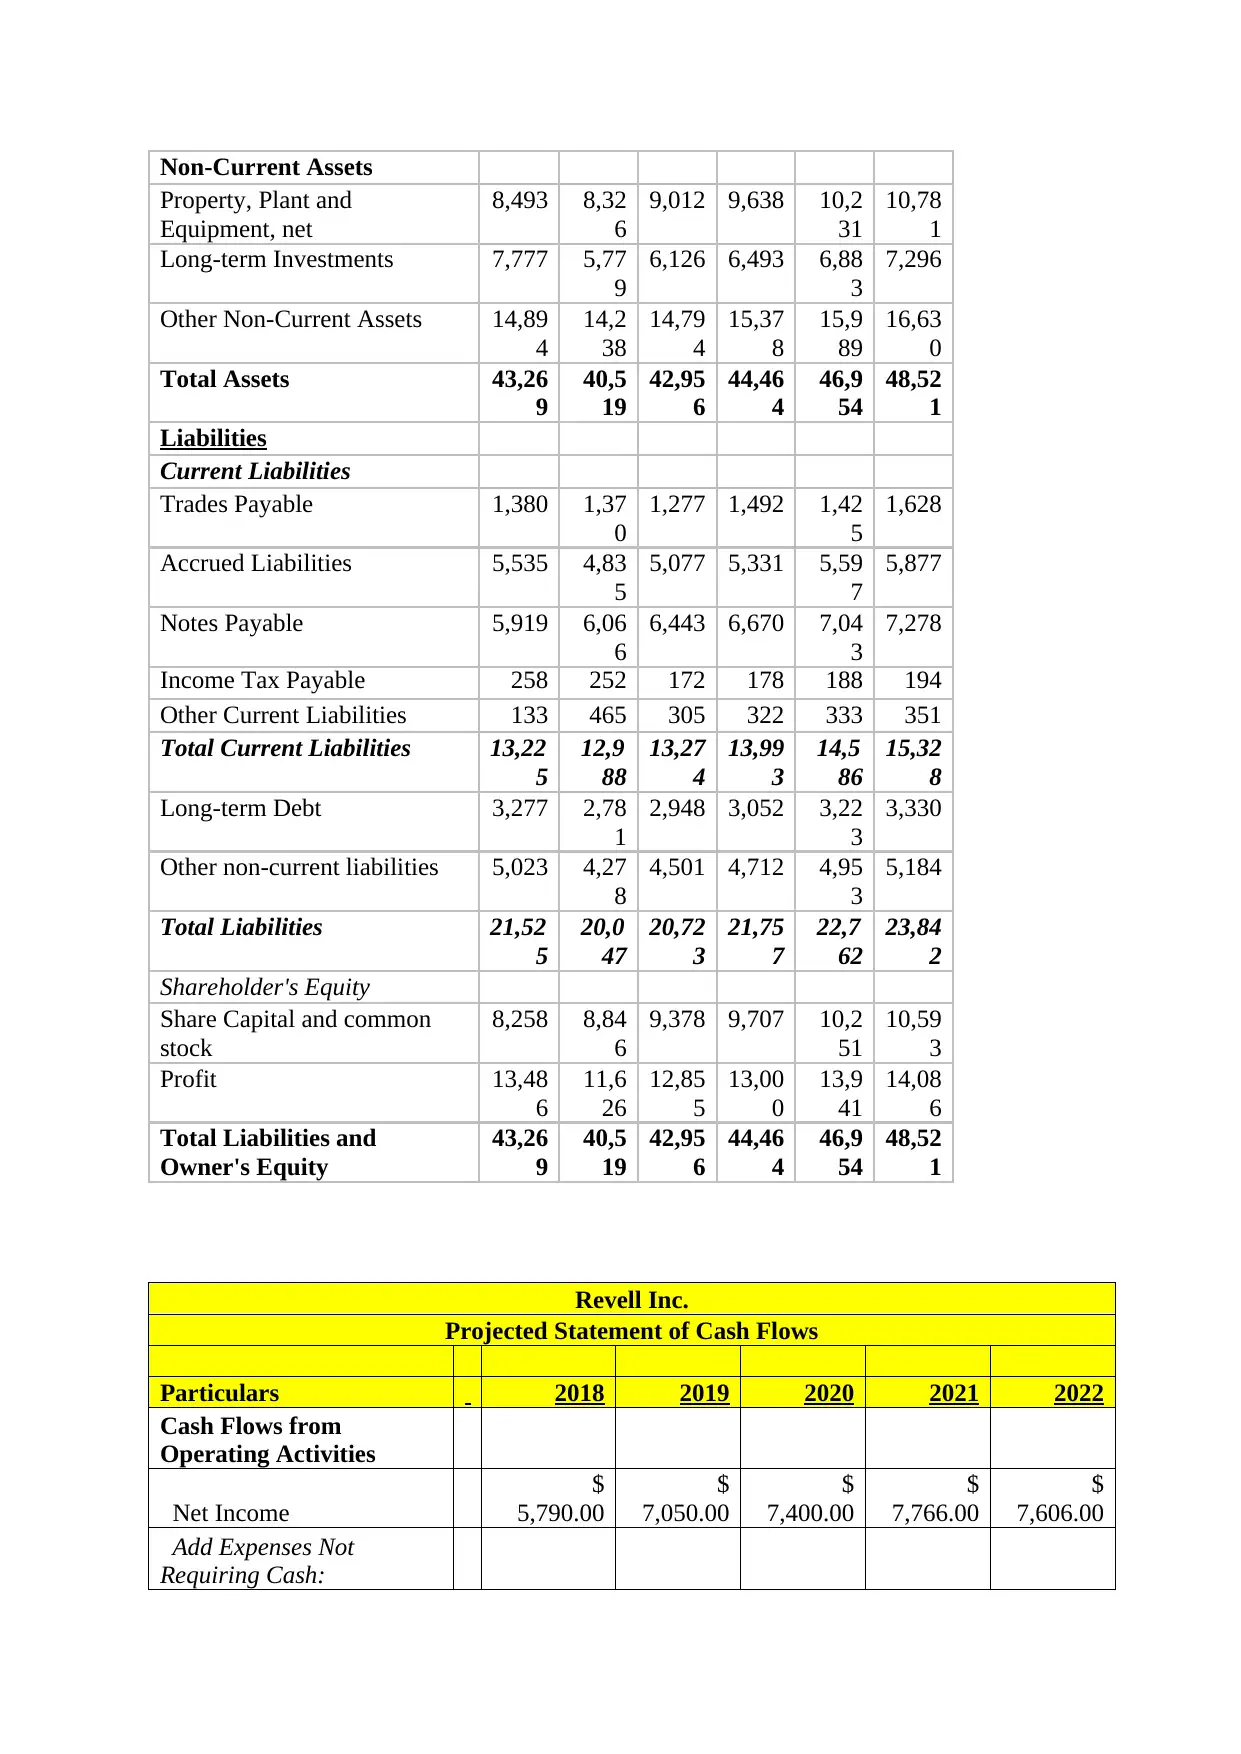
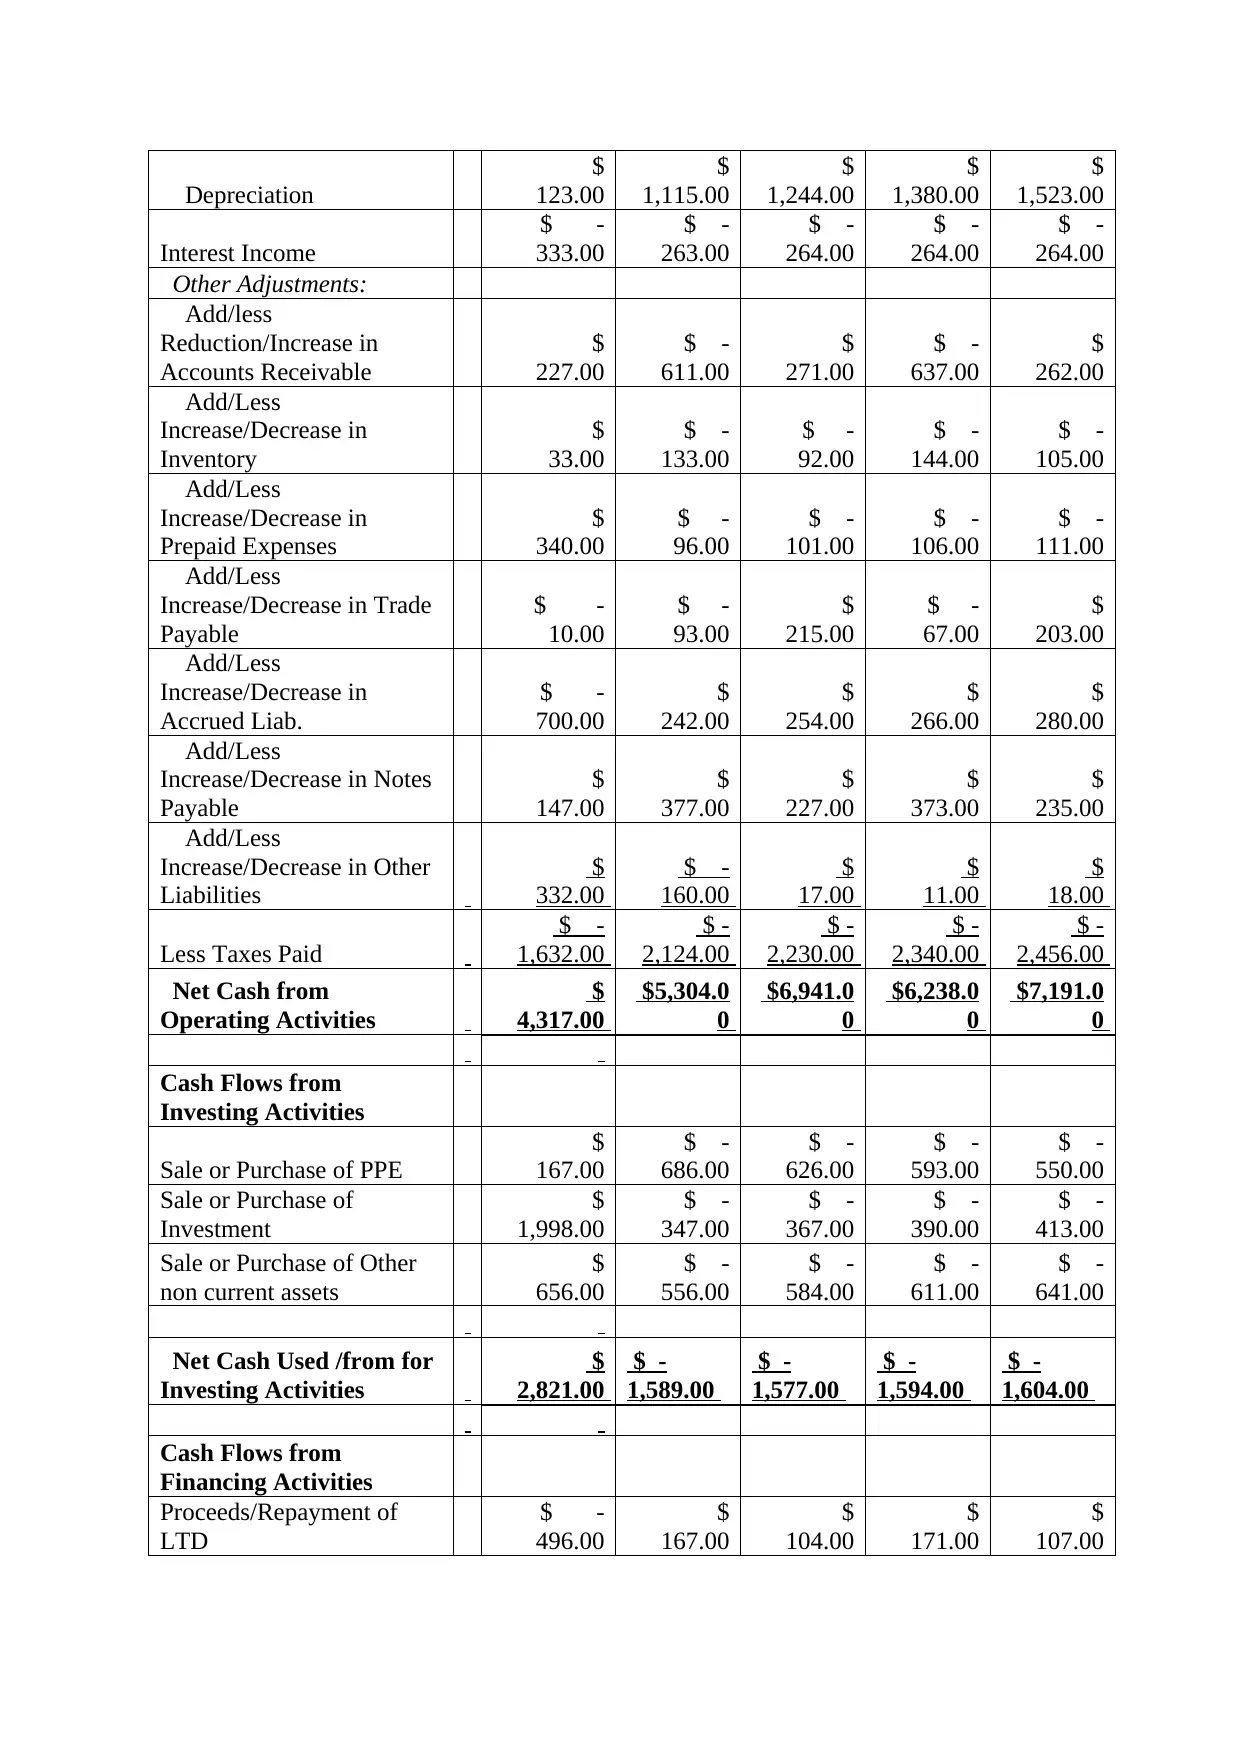
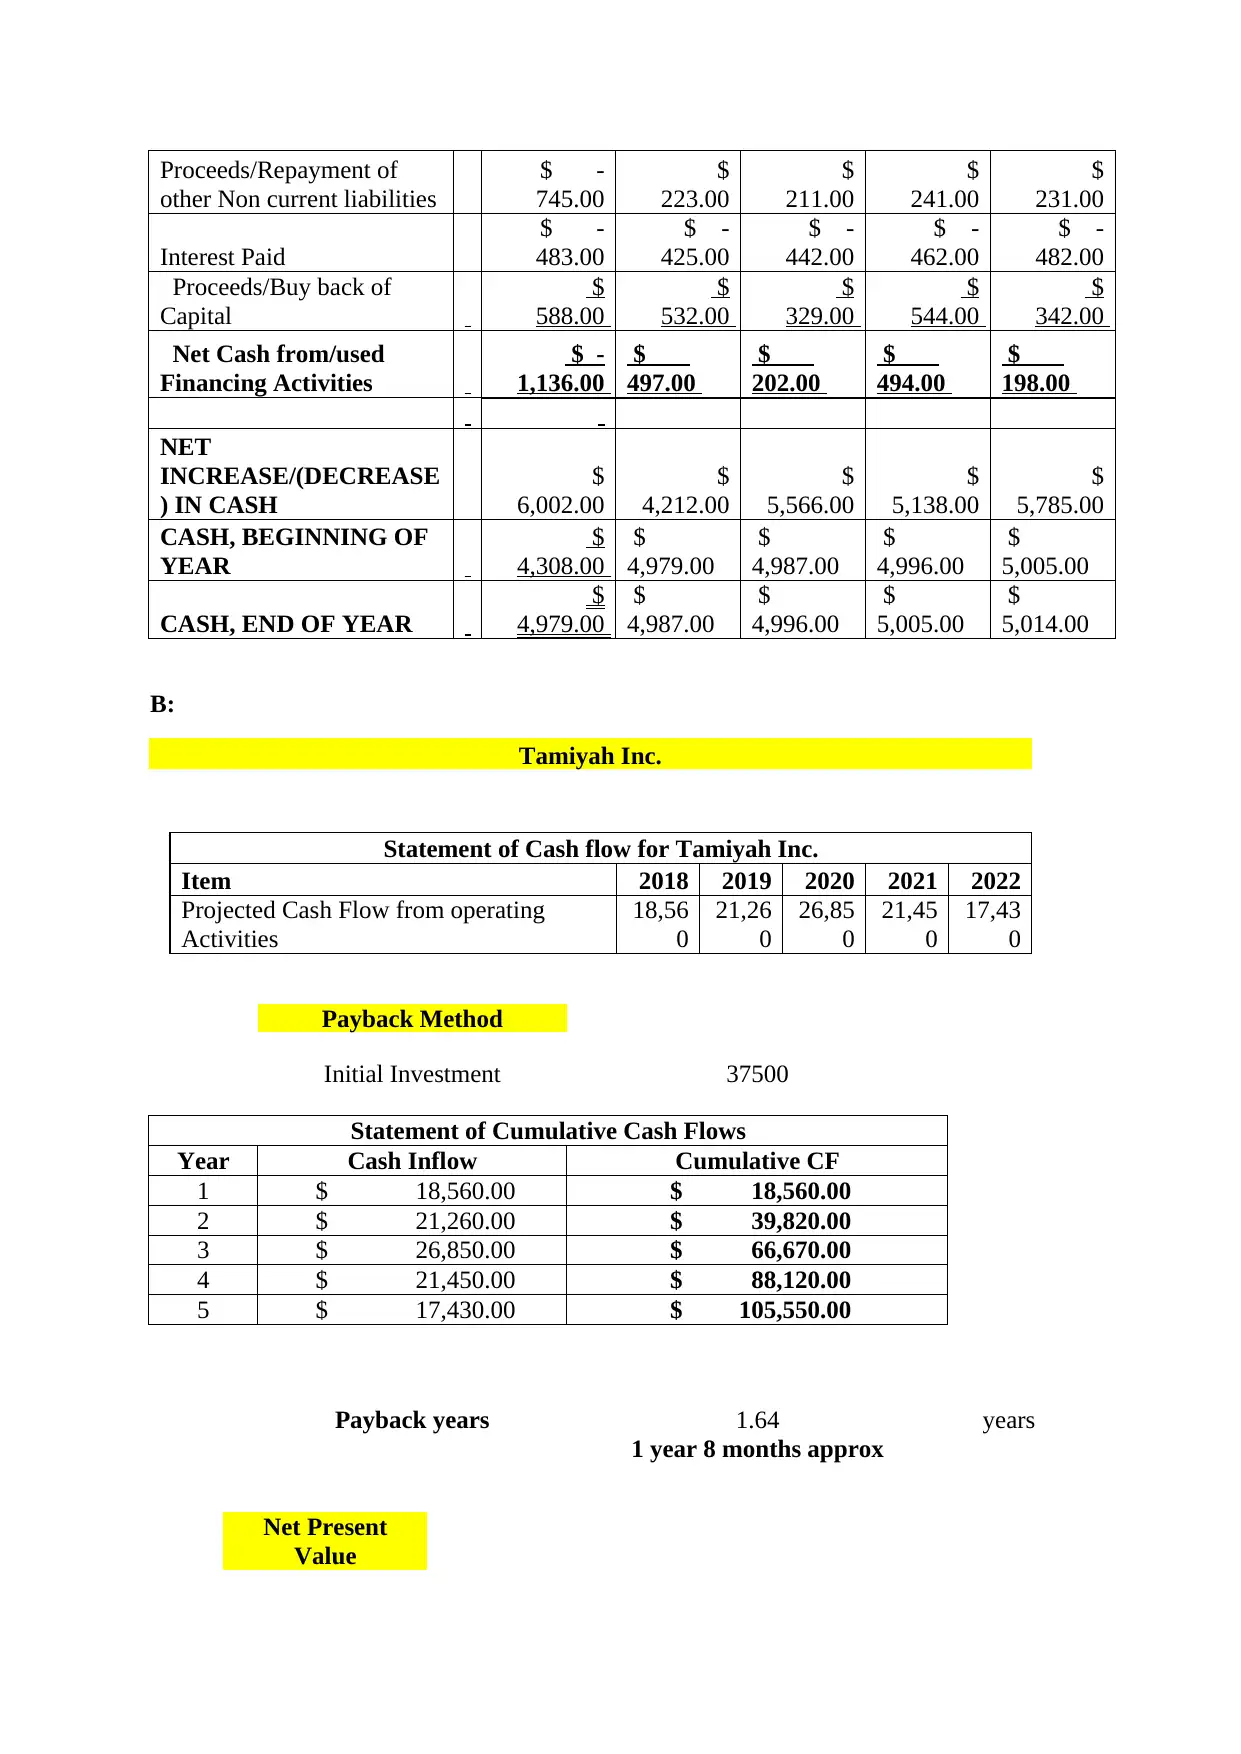
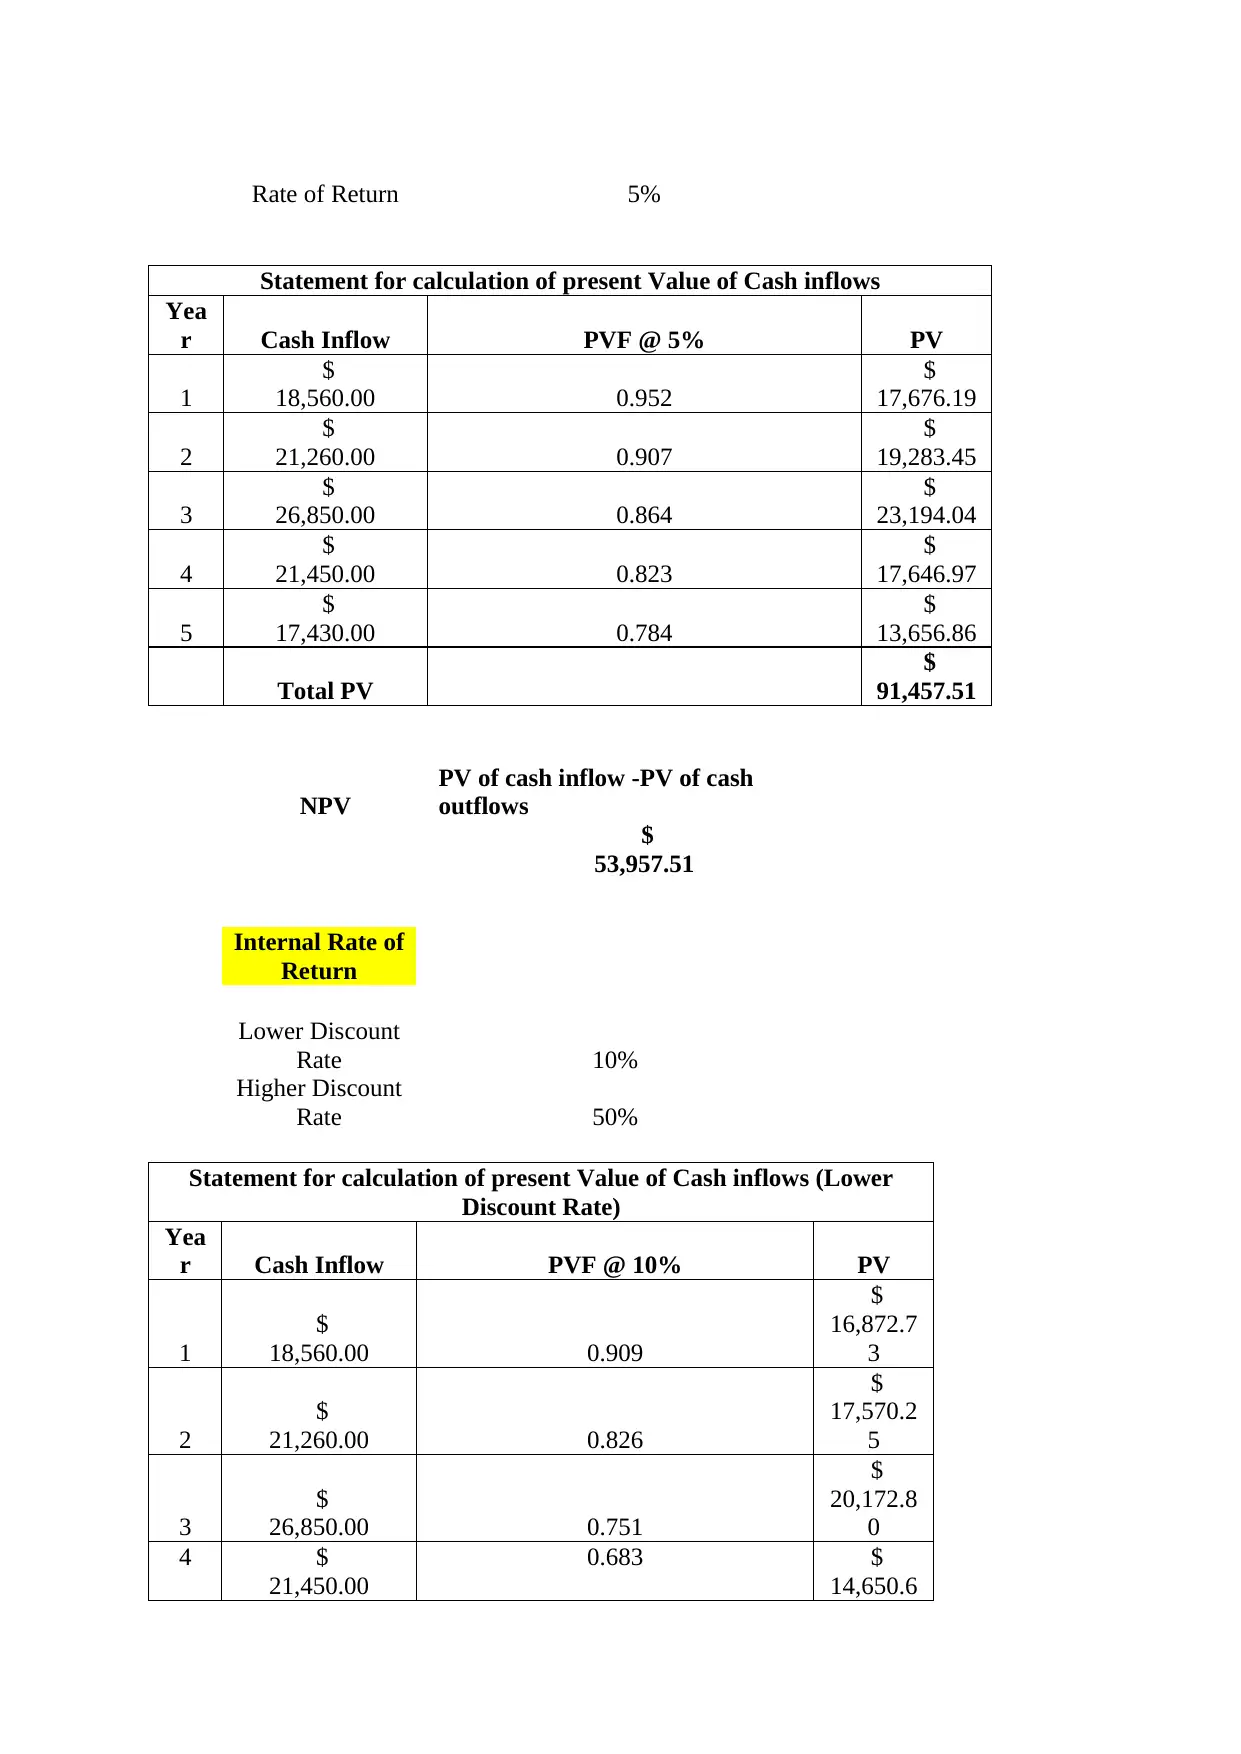
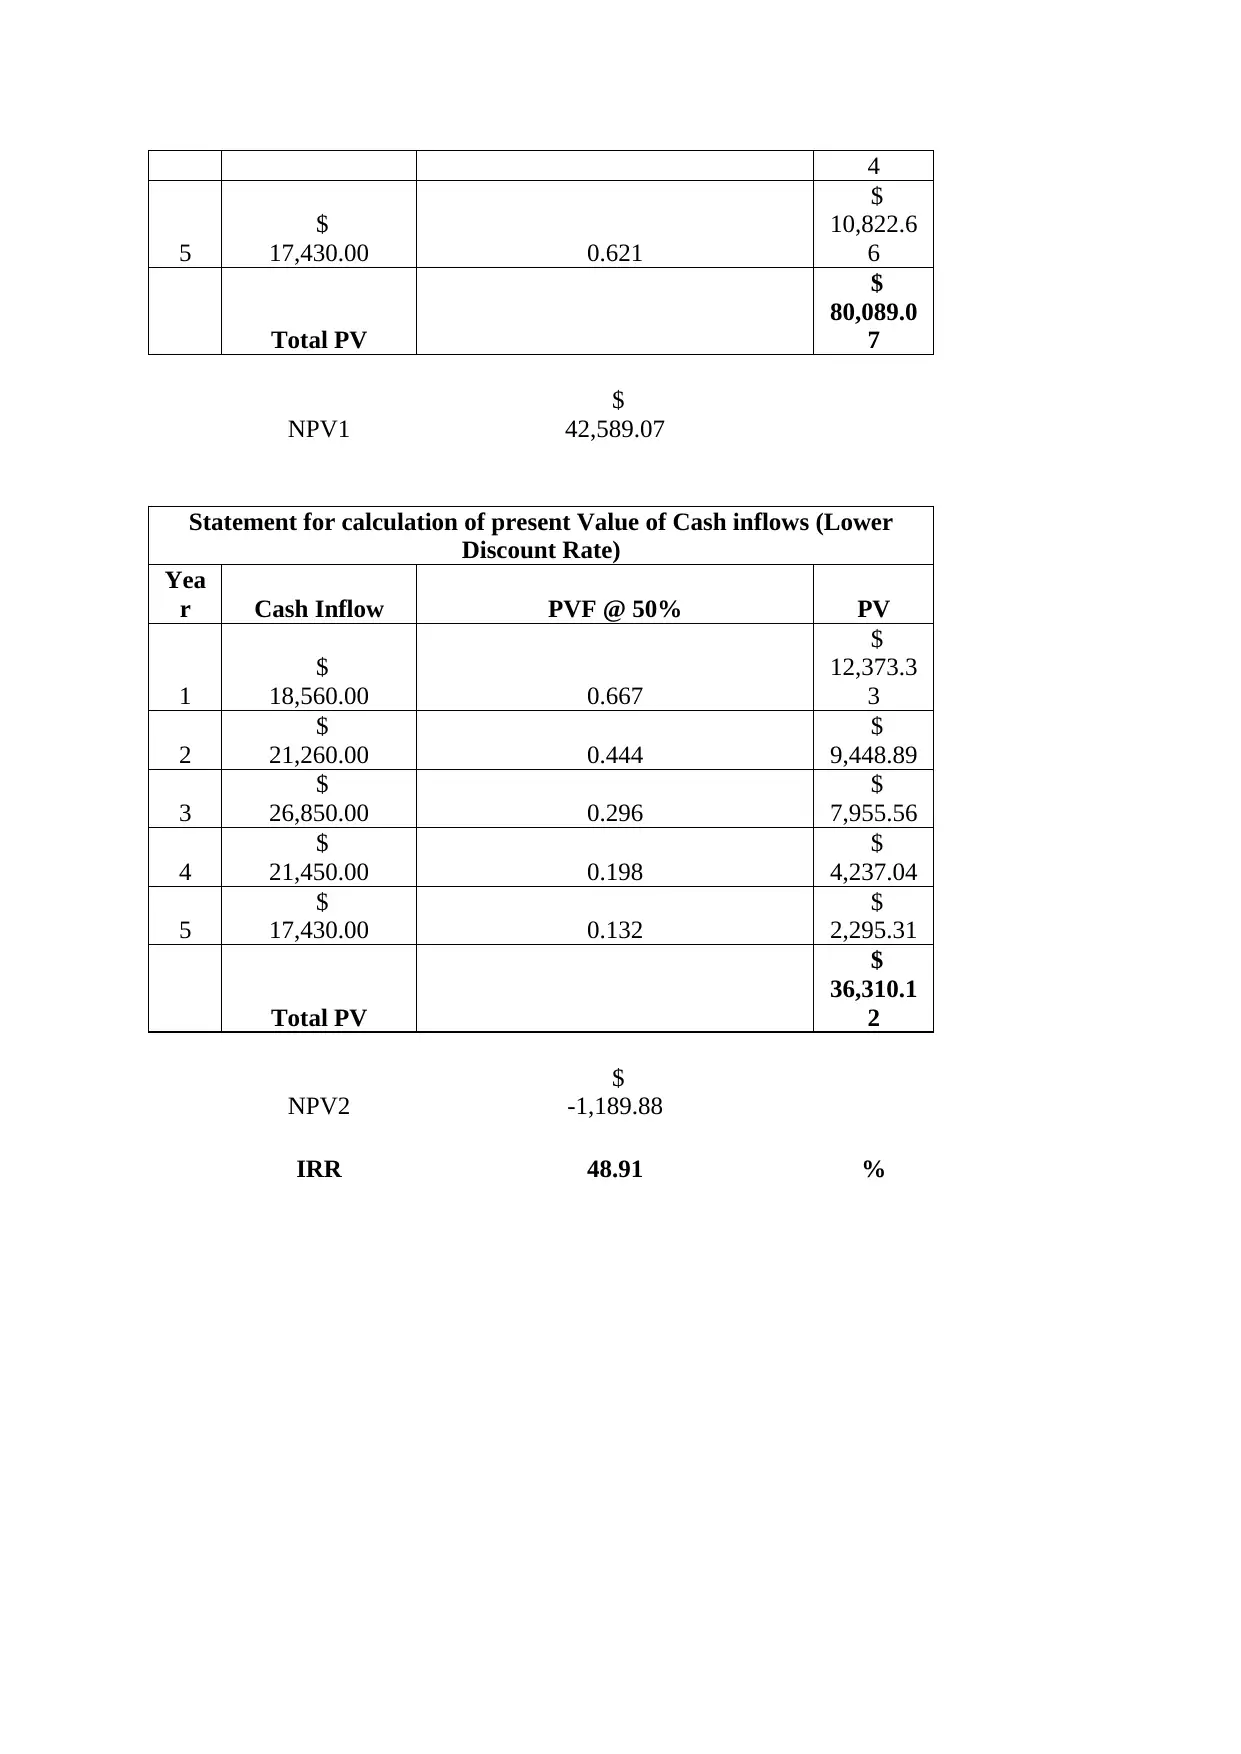
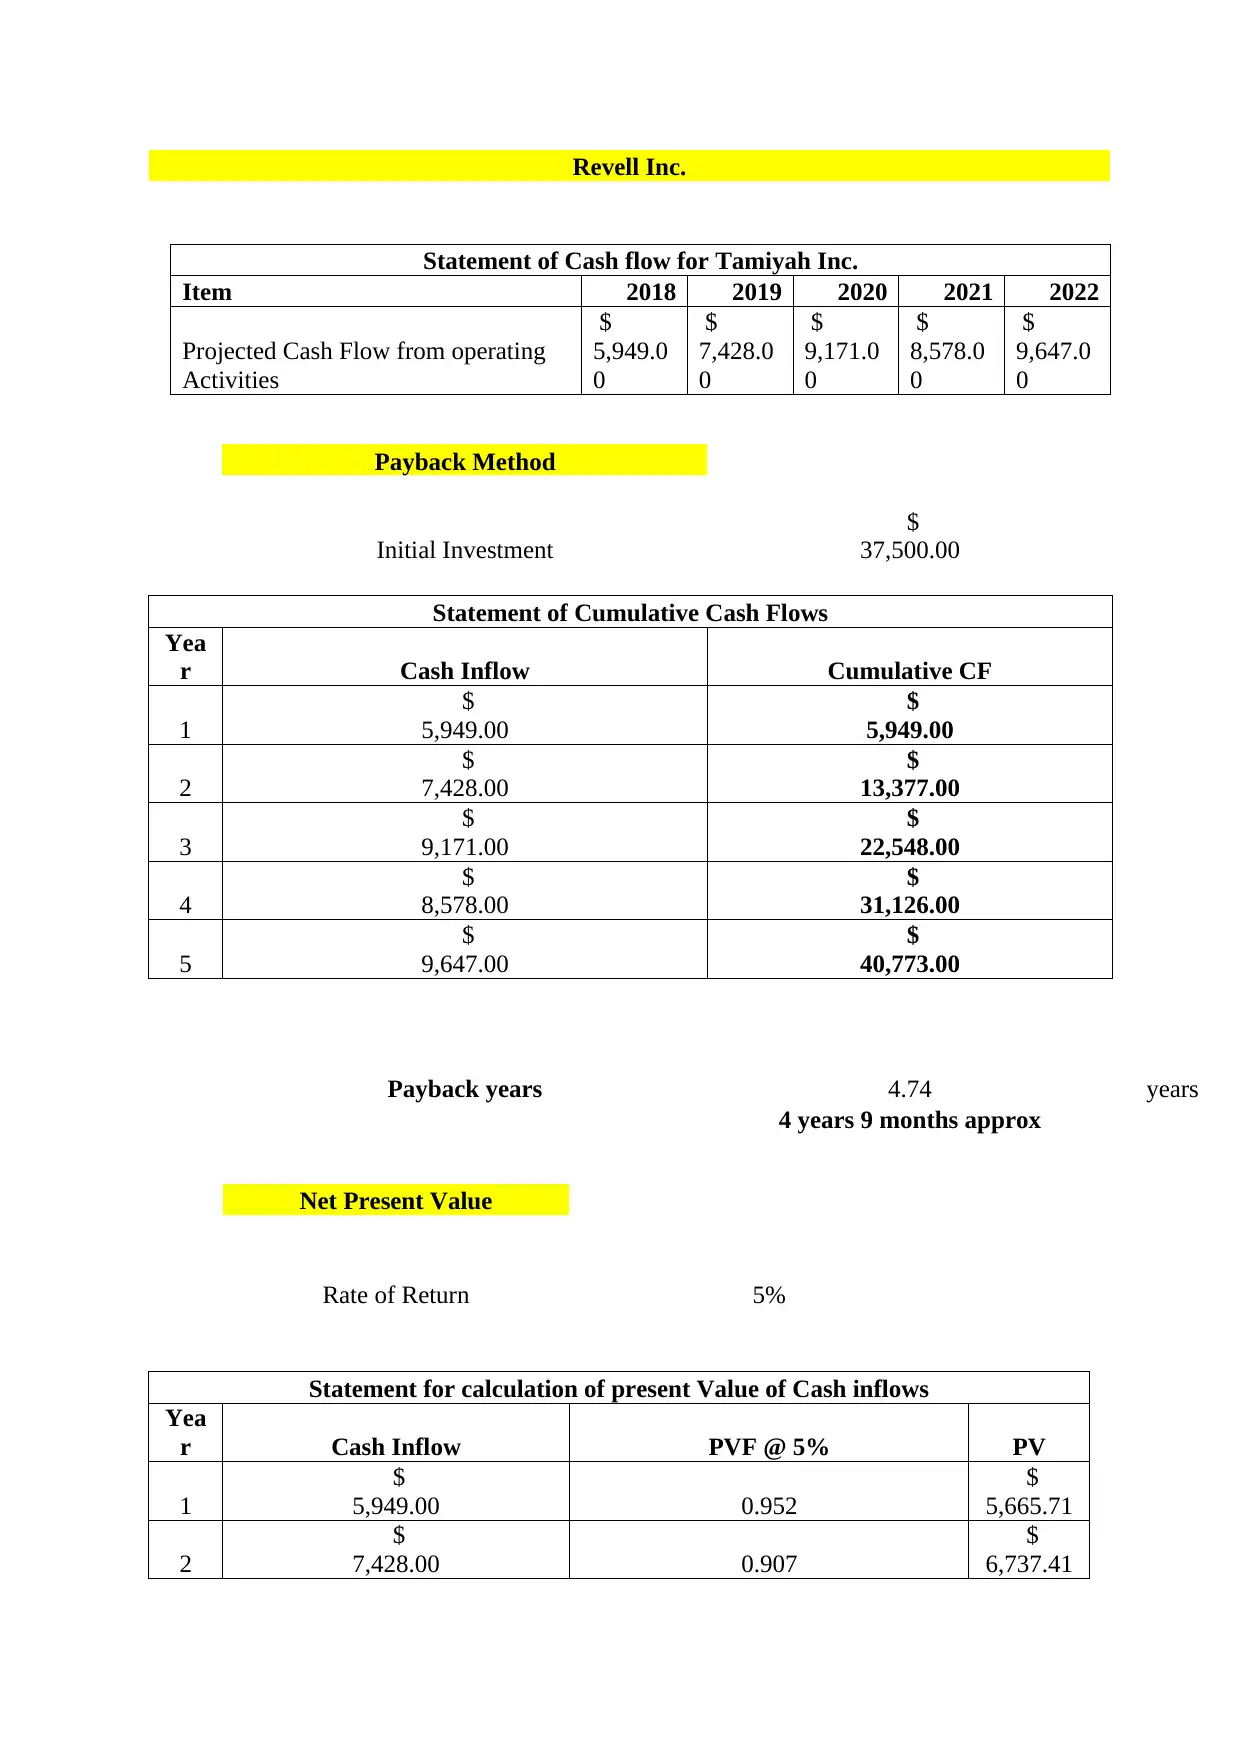
This assignment provides a comprehensive analysis of capital budgeting techniques, evaluating three investment options. It includes detailed financial statements, cash flow projections, and calculations for key metrics such as Internal Rate of Return (IRR), Net Present Value (NPV), and payback periods. The analysis considers two potential investments (TOYEE and Revell Inc. and Tamiyah Inc) and makes recommendations based on the financial viability and profitability of each project. The solutions include calculations of depreciation, accounting income, and cumulative cash flows. The project also discusses the preference for IRR over NPV in capital budgeting decisions, highlighting the reasons for this choice. The analysis culminates in investment recommendations based on the financial data and the application of capital budgeting methods.

Capital Budgeting
Paraphrase This Document
Need a fresh take? Get an instant paraphrase of this document with our AI Paraphraser

Solution 1:
TOYEE Business
Statement of Cash Flows
Year Particulars Cash Outflow Cash Inflows
0 Machine Cost -40000
1 PB Depreciation 8500
2 PB Depreciation 11700
3 PB Depreciation 15950
4 PB Depreciation 16400
5 PB Depreciation 15200
5 Salvage Value 8500
Rate of Return 5.00%
Accounting Rate of Return
Annual Depreciation (40000-8500)/5
$
6,300.00
Year Cash Inflow Salvage Value Depreciation Accounting Income
1 $ 8,500.00 $ 6,300.00 $ 2,200.00
2 $ 11,700.00 $ 6,300.00 $ 5,400.00
3 $ 15,950.00 $ 6,300.00 $ 9,650.00
4 $ 16,400.00 $ 6,300.00 $ 10,100.00
5 $ 15,200.00 $ 8,500.00 $ 6,300.00 $ 17,400.00
Total $ 44,750.00
Average Accounting income $ 8,950.00
Average ARR
Average Accounting Income/initial
Investment
22.38%
Payback Method
Initial Investment 40000
Statement of Cumulative Cash Flows
Year Cash Inflow Cumulative CF
1
$
8,500.00 $ 8,500.00

2
$
11,700.00 $ 20,200.00
3
$
15,950.00 $ 36,150.00
4
$
16,400.00 $ 52,550.00
5
$
15,200.00 $ 67,750.00
Payback years
3years + {
(40000-36150)/(52550-36150)}
3.23 years
3 years 3 months approx
Net Present Value
Statement of Cash Flows
Year Particulars Cash Outflow Cash Inflows
0 Machine Cost -40000
1 PB Depreciation 8500
2 PB Depreciation 11700
3 PB Depreciation 15950
4 PB Depreciation 16400
5 PB Depreciation 15200
5 Salvage Value 8500
Rate of Return 5%
Statement for calculation of present Value of Cash inflows
Year Cash Inflow PVF @ 5% PV
1
$
8,500.00 0.952
$
8,095.24
2
$
11,700.00 0.907
$
10,612.24
3
$
15,950.00 0.864
$
13,778.21
4
$
16,400.00 0.823
$
13,492.32
5
$
15,200.00 0.784
$
11,909.60
5
$
8,500.00 0.784
$
6,659.97
Total PV
$
64,547.58
$
11,700.00 $ 20,200.00
3
$
15,950.00 $ 36,150.00
4
$
16,400.00 $ 52,550.00
5
$
15,200.00 $ 67,750.00
Payback years
3years + {
(40000-36150)/(52550-36150)}
3.23 years
3 years 3 months approx
Net Present Value
Statement of Cash Flows
Year Particulars Cash Outflow Cash Inflows
0 Machine Cost -40000
1 PB Depreciation 8500
2 PB Depreciation 11700
3 PB Depreciation 15950
4 PB Depreciation 16400
5 PB Depreciation 15200
5 Salvage Value 8500
Rate of Return 5%
Statement for calculation of present Value of Cash inflows
Year Cash Inflow PVF @ 5% PV
1
$
8,500.00 0.952
$
8,095.24
2
$
11,700.00 0.907
$
10,612.24
3
$
15,950.00 0.864
$
13,778.21
4
$
16,400.00 0.823
$
13,492.32
5
$
15,200.00 0.784
$
11,909.60
5
$
8,500.00 0.784
$
6,659.97
Total PV
$
64,547.58
⊘ This is a preview!⊘
Do you want full access?
Subscribe today to unlock all pages.

Trusted by 1+ million students worldwide

NPV
PV of cash inflow -PV of
cash outflows
$ 24,547.58
Internal Rate of Return
Lower Discount Rate 10%
Higher Discount Rate 30%
Statement for calculation of present Value of Cash inflows (Lower Discount Rate)
Year Cash Inflow PVF @ 10% PV
1
$
8,500.00 0.909
$
7,727.27
2
$
11,700.00 0.826
$
9,669.42
3
$
15,950.00 0.751
$
11,983.47
4
$
16,400.00 0.683
$
11,201.42
5
$
15,200.00 0.621
$
9,438.00
5
$
8,500.00 0.621
$
5,277.83
Total PV
$
55,297.42
NPV1
$
15,297.42
Statement for calculation of present Value of Cash inflows (Lower Discount Rate)
Year Cash Inflow PVF @ 30% PV
1
$
8,500.00 0.769
$
6,538.46
2
$
11,700.00 0.592
$
6,923.08
3
$
15,950.00 0.455
$
7,259.90
4
$
16,400.00 0.350
$
5,742.10
5
$
15,200.00 0.269
$
4,093.80
5
$
8,500.00 0.269
$
2,289.30
Total PV
$
32,846.63
Paraphrase This Document
Need a fresh take? Get an instant paraphrase of this document with our AI Paraphraser

NPV2
$ -
7,153.37
IRR 23.63 %
Recommendations
On the basis of above information it is advised that Jason should start this business.
$ -
7,153.37
IRR 23.63 %
Recommendations
On the basis of above information it is advised that Jason should start this business.

Solution 2:
A:
Profit and Loss Statement for Revell Inc.
Actua
l
Forecasts
Item 2017 2018 2019 2020 2021 2022
Sales 28,857 31,94
4
33,54
1
35,21
8
36,97
9
38,28
2
Cost of Sales -
10,406
-
11,37
4
-
11,94
3
-
12,54
0
-
13,16
7
-
13,82
5
Gross Profit 18,451 20,57
0
21,59
8
22,67
8
23,81
2
24,45
7
Administrative and
Selling Expenses
-
10,002
-
11,65
1
-
11,24
8
-
11,73
7
-
12,25
0
-
12,78
8
Depreciation -943 -123 -1,115 -1,244 -1,380 -1,523
Other Operating
Expenses
-254 -350 -368 -386 -405 -425
Operating Profit 7,252 8,446 8,867 9,311 9,777 9,721
Interest Income 236 333 263 264 264 264
Interest Expense -456 -483 -425 -442 -462 -482
Other Income (Loss) 668 -874 469 497 527 559
Profit Before
Taxation
7,700 7,422 9,174 9,630 10,10
6
10,06
2
Taxes on Income -1,892 -1,632 -2,124 -2,230 -2,340 -2,456
Profit for the Year 5,808 5,790 7,050 7,400 7,766 7,606
Statement of Financial Position of Revell Inc.
Actu
al
Forecasts
Item 2017 2018 2019 2020 2021 2022
Assets
Current Assets
Cash and Cash Equivalents 4,308 4,97
9
4,987 4,996 5,00
5
5,014
Accounts Receivable 3,317 3,09
0
3,701 3,430 4,06
7
3,805
Inventory 2,220 2,18
7
2,320 2,412 2,55
6
2,661
Prepaid Expenses 2,260 1,92
0
2,016 2,117 2,22
3
2,334
Total Current Assets 12,10
5
12,1
76
13,02
4
12,95
5
13,8
51
13,81
4
⊘ This is a preview!⊘
Do you want full access?
Subscribe today to unlock all pages.

Trusted by 1+ million students worldwide

Non-Current Assets
Property, Plant and
Equipment, net
8,493 8,32
6
9,012 9,638 10,2
31
10,78
1
Long-term Investments 7,777 5,77
9
6,126 6,493 6,88
3
7,296
Other Non-Current Assets 14,89
4
14,2
38
14,79
4
15,37
8
15,9
89
16,63
0
Total Assets 43,26
9
40,5
19
42,95
6
44,46
4
46,9
54
48,52
1
Liabilities
Current Liabilities
Trades Payable 1,380 1,37
0
1,277 1,492 1,42
5
1,628
Accrued Liabilities 5,535 4,83
5
5,077 5,331 5,59
7
5,877
Notes Payable 5,919 6,06
6
6,443 6,670 7,04
3
7,278
Income Tax Payable 258 252 172 178 188 194
Other Current Liabilities 133 465 305 322 333 351
Total Current Liabilities 13,22
5
12,9
88
13,27
4
13,99
3
14,5
86
15,32
8
Long-term Debt 3,277 2,78
1
2,948 3,052 3,22
3
3,330
Other non-current liabilities 5,023 4,27
8
4,501 4,712 4,95
3
5,184
Total Liabilities 21,52
5
20,0
47
20,72
3
21,75
7
22,7
62
23,84
2
Shareholder's Equity
Share Capital and common
stock
8,258 8,84
6
9,378 9,707 10,2
51
10,59
3
Profit 13,48
6
11,6
26
12,85
5
13,00
0
13,9
41
14,08
6
Total Liabilities and
Owner's Equity
43,26
9
40,5
19
42,95
6
44,46
4
46,9
54
48,52
1
Revell Inc.
Projected Statement of Cash Flows
Particulars 2018 2019 2020 2021 2022
Cash Flows from
Operating Activities
Net Income
$
5,790.00
$
7,050.00
$
7,400.00
$
7,766.00
$
7,606.00
Add Expenses Not
Requiring Cash:
Paraphrase This Document
Need a fresh take? Get an instant paraphrase of this document with our AI Paraphraser

Depreciation
$
123.00
$
1,115.00
$
1,244.00
$
1,380.00
$
1,523.00
Interest Income
$ -
333.00
$ -
263.00
$ -
264.00
$ -
264.00
$ -
264.00
Other Adjustments:
Add/less
Reduction/Increase in
Accounts Receivable
$
227.00
$ -
611.00
$
271.00
$ -
637.00
$
262.00
Add/Less
Increase/Decrease in
Inventory
$
33.00
$ -
133.00
$ -
92.00
$ -
144.00
$ -
105.00
Add/Less
Increase/Decrease in
Prepaid Expenses
$
340.00
$ -
96.00
$ -
101.00
$ -
106.00
$ -
111.00
Add/Less
Increase/Decrease in Trade
Payable
$ -
10.00
$ -
93.00
$
215.00
$ -
67.00
$
203.00
Add/Less
Increase/Decrease in
Accrued Liab.
$ -
700.00
$
242.00
$
254.00
$
266.00
$
280.00
Add/Less
Increase/Decrease in Notes
Payable
$
147.00
$
377.00
$
227.00
$
373.00
$
235.00
Add/Less
Increase/Decrease in Other
Liabilities
$
332.00
$ -
160.00
$
17.00
$
11.00
$
18.00
Less Taxes Paid
$ -
1,632.00
$ -
2,124.00
$ -
2,230.00
$ -
2,340.00
$ -
2,456.00
Net Cash from
Operating Activities
$
4,317.00
$5,304.0
0
$6,941.0
0
$6,238.0
0
$7,191.0
0
Cash Flows from
Investing Activities
Sale or Purchase of PPE
$
167.00
$ -
686.00
$ -
626.00
$ -
593.00
$ -
550.00
Sale or Purchase of
Investment
$
1,998.00
$ -
347.00
$ -
367.00
$ -
390.00
$ -
413.00
Sale or Purchase of Other
non current assets
$
656.00
$ -
556.00
$ -
584.00
$ -
611.00
$ -
641.00
Net Cash Used /from for
Investing Activities
$
2,821.00
$ -
1,589.00
$ -
1,577.00
$ -
1,594.00
$ -
1,604.00
Cash Flows from
Financing Activities
Proceeds/Repayment of
LTD
$ -
496.00
$
167.00
$
104.00
$
171.00
$
107.00
$
123.00
$
1,115.00
$
1,244.00
$
1,380.00
$
1,523.00
Interest Income
$ -
333.00
$ -
263.00
$ -
264.00
$ -
264.00
$ -
264.00
Other Adjustments:
Add/less
Reduction/Increase in
Accounts Receivable
$
227.00
$ -
611.00
$
271.00
$ -
637.00
$
262.00
Add/Less
Increase/Decrease in
Inventory
$
33.00
$ -
133.00
$ -
92.00
$ -
144.00
$ -
105.00
Add/Less
Increase/Decrease in
Prepaid Expenses
$
340.00
$ -
96.00
$ -
101.00
$ -
106.00
$ -
111.00
Add/Less
Increase/Decrease in Trade
Payable
$ -
10.00
$ -
93.00
$
215.00
$ -
67.00
$
203.00
Add/Less
Increase/Decrease in
Accrued Liab.
$ -
700.00
$
242.00
$
254.00
$
266.00
$
280.00
Add/Less
Increase/Decrease in Notes
Payable
$
147.00
$
377.00
$
227.00
$
373.00
$
235.00
Add/Less
Increase/Decrease in Other
Liabilities
$
332.00
$ -
160.00
$
17.00
$
11.00
$
18.00
Less Taxes Paid
$ -
1,632.00
$ -
2,124.00
$ -
2,230.00
$ -
2,340.00
$ -
2,456.00
Net Cash from
Operating Activities
$
4,317.00
$5,304.0
0
$6,941.0
0
$6,238.0
0
$7,191.0
0
Cash Flows from
Investing Activities
Sale or Purchase of PPE
$
167.00
$ -
686.00
$ -
626.00
$ -
593.00
$ -
550.00
Sale or Purchase of
Investment
$
1,998.00
$ -
347.00
$ -
367.00
$ -
390.00
$ -
413.00
Sale or Purchase of Other
non current assets
$
656.00
$ -
556.00
$ -
584.00
$ -
611.00
$ -
641.00
Net Cash Used /from for
Investing Activities
$
2,821.00
$ -
1,589.00
$ -
1,577.00
$ -
1,594.00
$ -
1,604.00
Cash Flows from
Financing Activities
Proceeds/Repayment of
LTD
$ -
496.00
$
167.00
$
104.00
$
171.00
$
107.00

Proceeds/Repayment of
other Non current liabilities
$ -
745.00
$
223.00
$
211.00
$
241.00
$
231.00
Interest Paid
$ -
483.00
$ -
425.00
$ -
442.00
$ -
462.00
$ -
482.00
Proceeds/Buy back of
Capital
$
588.00
$
532.00
$
329.00
$
544.00
$
342.00
Net Cash from/used
Financing Activities
$ -
1,136.00
$
497.00
$
202.00
$
494.00
$
198.00
NET
INCREASE/(DECREASE
) IN CASH
$
6,002.00
$
4,212.00
$
5,566.00
$
5,138.00
$
5,785.00
CASH, BEGINNING OF
YEAR
$
4,308.00
$
4,979.00
$
4,987.00
$
4,996.00
$
5,005.00
CASH, END OF YEAR
$
4,979.00
$
4,987.00
$
4,996.00
$
5,005.00
$
5,014.00
B:
Tamiyah Inc.
Statement of Cash flow for Tamiyah Inc.
Item 2018 2019 2020 2021 2022
Projected Cash Flow from operating
Activities
18,56
0
21,26
0
26,85
0
21,45
0
17,43
0
Payback Method
Initial Investment 37500
Statement of Cumulative Cash Flows
Year Cash Inflow Cumulative CF
1 $ 18,560.00 $ 18,560.00
2 $ 21,260.00 $ 39,820.00
3 $ 26,850.00 $ 66,670.00
4 $ 21,450.00 $ 88,120.00
5 $ 17,430.00 $ 105,550.00
Payback years 1.64 years
1 year 8 months approx
Net Present
Value
⊘ This is a preview!⊘
Do you want full access?
Subscribe today to unlock all pages.

Trusted by 1+ million students worldwide

Rate of Return 5%
Statement for calculation of present Value of Cash inflows
Yea
r Cash Inflow PVF @ 5% PV
1
$
18,560.00 0.952
$
17,676.19
2
$
21,260.00 0.907
$
19,283.45
3
$
26,850.00 0.864
$
23,194.04
4
$
21,450.00 0.823
$
17,646.97
5
$
17,430.00 0.784
$
13,656.86
Total PV
$
91,457.51
NPV
PV of cash inflow -PV of cash
outflows
$
53,957.51
Internal Rate of
Return
Lower Discount
Rate 10%
Higher Discount
Rate 50%
Statement for calculation of present Value of Cash inflows (Lower
Discount Rate)
Yea
r Cash Inflow PVF @ 10% PV
1
$
18,560.00 0.909
$
16,872.7
3
2
$
21,260.00 0.826
$
17,570.2
5
3
$
26,850.00 0.751
$
20,172.8
0
4 $
21,450.00
0.683 $
14,650.6
Paraphrase This Document
Need a fresh take? Get an instant paraphrase of this document with our AI Paraphraser

4
5
$
17,430.00 0.621
$
10,822.6
6
Total PV
$
80,089.0
7
NPV1
$
42,589.07
Statement for calculation of present Value of Cash inflows (Lower
Discount Rate)
Yea
r Cash Inflow PVF @ 50% PV
1
$
18,560.00 0.667
$
12,373.3
3
2
$
21,260.00 0.444
$
9,448.89
3
$
26,850.00 0.296
$
7,955.56
4
$
21,450.00 0.198
$
4,237.04
5
$
17,430.00 0.132
$
2,295.31
Total PV
$
36,310.1
2
NPV2
$
-1,189.88
IRR 48.91 %
5
$
17,430.00 0.621
$
10,822.6
6
Total PV
$
80,089.0
7
NPV1
$
42,589.07
Statement for calculation of present Value of Cash inflows (Lower
Discount Rate)
Yea
r Cash Inflow PVF @ 50% PV
1
$
18,560.00 0.667
$
12,373.3
3
2
$
21,260.00 0.444
$
9,448.89
3
$
26,850.00 0.296
$
7,955.56
4
$
21,450.00 0.198
$
4,237.04
5
$
17,430.00 0.132
$
2,295.31
Total PV
$
36,310.1
2
NPV2
$
-1,189.88
IRR 48.91 %

Revell Inc.
Statement of Cash flow for Tamiyah Inc.
Item 2018 2019 2020 2021 2022
Projected Cash Flow from operating
Activities
$
5,949.0
0
$
7,428.0
0
$
9,171.0
0
$
8,578.0
0
$
9,647.0
0
Payback Method
Initial Investment
$
37,500.00
Statement of Cumulative Cash Flows
Yea
r Cash Inflow Cumulative CF
1
$
5,949.00
$
5,949.00
2
$
7,428.00
$
13,377.00
3
$
9,171.00
$
22,548.00
4
$
8,578.00
$
31,126.00
5
$
9,647.00
$
40,773.00
Payback years 4.74 years
4 years 9 months approx
Net Present Value
Rate of Return 5%
Statement for calculation of present Value of Cash inflows
Yea
r Cash Inflow PVF @ 5% PV
1
$
5,949.00 0.952
$
5,665.71
2
$
7,428.00 0.907
$
6,737.41
⊘ This is a preview!⊘
Do you want full access?
Subscribe today to unlock all pages.

Trusted by 1+ million students worldwide
1 out of 16
Related Documents

Your All-in-One AI-Powered Toolkit for Academic Success.
 +13062052269
info@desklib.com
Available 24*7 on WhatsApp / Email
Unlock your academic potential
Copyright © 2020–2025 A2Z Services. All Rights Reserved. Developed and managed by ZUCOL.